Modified DCA Strategy - Crypto Fear/Greed IndexThis indicator uses historical crypto fear and greed index (0-100) data and labels the low points (extreme fear) and the high points (extreme greed).
The strategy is to DCA at the points of extreme fear, and to sell at points of extreme greed.
When backtested, profit margins are significantly higher than regular DCA strategy.
Not financial advice. Use at your own risk.
在脚本中搜索"the strat"

JPM VIX Signal - Non OverlayJPMorgan Chase & Co . strategists have identified what they say is a near bulletproof indicator to strengthen their argument that stock markets are poised to rally.
The buy signal is triggered when the Cboe Volatility Index ( VIX ) rises by more than 50% of its 1-month (30 day) moving average, which it last did on January 25th 2022, according to the strategists led by Mislav Matejka. The indicator has proven 100% accurate outside of recessions over the last three decades.
Instructions:
Symbol - SPY
Timeframe - Daily
Signal - Indicator exceeds horizontal line of 1.5

JPMorgan VIX Buy SignalJPMorgan Chase & Co. strategists have identified what they say is a near bulletproof indicator to strengthen their argument that stock markets are poised to rally.
The buy signal is triggered when the Cboe Volatility Index (VIX) rises by more than 50% of its 1-month (30 day) moving average, which it last did on January 25th 2022, according to the strategists led by Mislav Matejka. The indicator has proven 100% accurate outside of recessions over the last three decades.
Instructions:
Symbol - VIX
Timeframe - Daily
Red Triangle - Close / 30 Day SMA >= 1.5

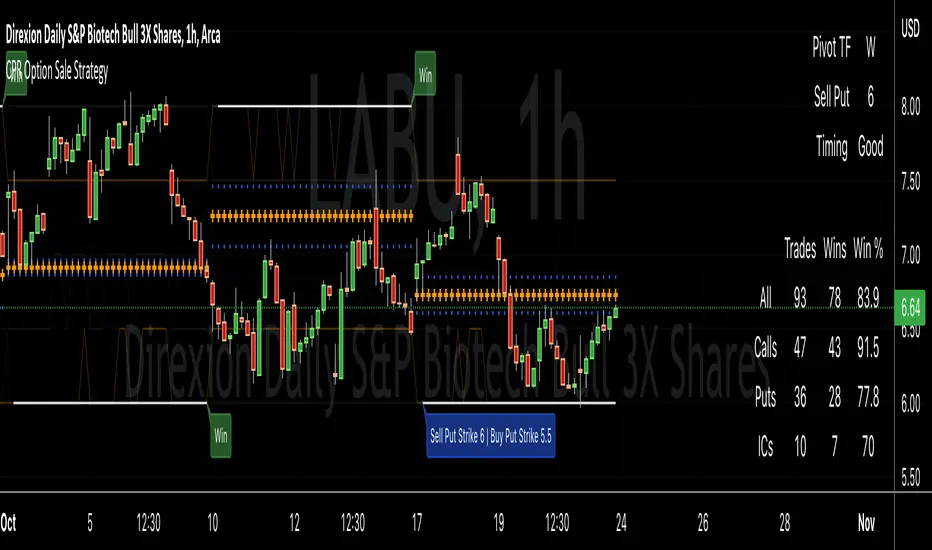
CPR Option Selling StrategyGood afternoon traders,
This is a script I built for option selling, in attempt to have a high success rate.
The gist of how it works:
It uses the opening or close of the current chart's timeframe opening bar when referenced against a designated (higher) timeframe's central pivot range (CPR).
Using that comparison, this script calculates an option to sell: put, call, or iron condor. It will calculate a call value using an average of the CPR central pivot and the max value of the prior higher timeframe's high or R1 (whichever is higher.)
It does the same for the put side, but uses the higher timeframe's low or S1 (whichever is lower.)
It will use the option on the other side of the source (open or close) of the CPR as the "option in play."
Settings:
There are many settings, most are simply "viewable" settings, and probably self explanatory, others, not so much:
"Source for Trigger" - this is the value used on the "opening bar," such as the close. This value is the one compared to the Central Pivot Range in determining whether to sell a call (if the source is lower,) sell a put (if the source is higher,) or an iron condor if it's in the CPR.
"Show Historical Win/Loss Percentages" - this shows a table in the bottom right of the W/L percentages for the current ticker and settings. Used for a quick glance at historical success rates.
"Extend Developing Levels Into the Future" - This will extend the developing values for CPR values, call and put values into the future (good for trying to trade early or setting up pre-market trades, assuming there will not be huge gap in one direction or another.)
"Select Higher Timeframe" - "Auto" will choose the higher timeframe for you. "Manual" will use the next field...
"If Manual, Timeframe for Pivots" - allows you to choose a different higher timeframe.
The next two sections are simply whether to show the plots for different levels of traditional and/or camarilla pivot points.
The last section will allow you to just filter on certain days. Really only useful for "backtesting" certain 0DTE trades on some daily options during the hourly chart.
Example use:
An example use (which I completed last week) on the chart referenced in this share: I sold a put-spread for $0.90, selling a 590 and buying a 570 strike in the middle of the week. I was looking at an hourly timeframe chart with a weekly pivot timeframe for the strategy.
Obviously, making only $0.90 on a $20 spread, there is a lot more to lose than to make, but I did some other analysis to go with it, so I felt safe, and I had a stop set for $1.50. So it worked, along with 3 other plays I did, very similar, and if that "Historical Win/Loss Percentage" is accurate, which I am fairly certain it is, I felt good about it.
The key all comes down to what you sell it for, right? That piece only you can determine. :)
Happy trading and enjoy,
Deuce
Volume Adaptive Chikou Scalping StudyIDEA PLACEMENT
This indicator uses “Chikou” cross concept of Ichimoku cloud indicator and enhances usage of High/Low data with Volume Breakout and Volatility based dynamic adaption.
I’ve been working on making Moving Averages more adaptive based on Volume Breakout and Volatility but as we know Mas work better on close values. I wanted to create a study that may have maximum data available and that’s how I came up with the concept of making adaptive Ichimoku Cloud. Except, I used different concept than Ichimoku. As we know that Tenkan-sen and Kijun-sen from Ichimoku Cloud average out highest and lowest values within 26 and 9 period respectively but I tried making it Volume Breakout and Volatility based Adaptive but couldn’t get better results.
Along the way I came up with an idea of instead of averaging out just keeping the High/Low values data separate and intact and to do so I took Linear regression of High values of Volume Breakout and Volatility based Adaptive dynamic period and similarly with Low values.
Then the strategy was to use Chikou for crossover and crossunder indication and for this purpose I used Chikou with same dynamic length as used before in High/Low linear regression.
The idea becomes simple as when Adaptive Dynamic Chikou crosses Adaptive Dynamic Linear Regression of High/Low values then Lowest / Highest value within current Adaptive Dynamic Length becomes the next Support / Resistance.
SIGNALS
Not every Chikou cross would give signal instead signal should be supported by either Volume Breakout or Volatility whatever you have selected from.
FIBONACCI EVELOPE BANDS
I’ve included ATR based Fibonacci multiple bands which would act as good support/resistance zones.
DEFAULT SETTINGS
I’ve set default Minimum length to 20 and Maximum length to 50 which I’ve found works best for almost all timeframes but you can change this delta to adpat your timeframe accordingly with more precision.
Dynamic length adoption is enabled based on both Volume and Volatility but only one or none of them can also be selected.
Trend signals verification is enabled based on Volume but Volatility can also be enabled for more precise confirmations.
In “RVSI” settings TFS Volume Oscillator is set to default but others work good too especially Volume Zone Oscillator. For more details about Volume Breakout you can check “MZ RVSI Indicator”
ATR breakout is set to be true if period 14 exceeds period 46 but can be changed if more adaption with volatility is required.
FURTHER ENHANCEMENTS
I’ve used Linear Regression of High/Low values because I found better results with it but SMA and HMA can also be used. I’m planning to perpetually use this study for Dynamically length adaption and trades confirmations in other strategies.

prince of the pit-ver6About the script:
This script is a full translation of my strategy. the strategy name is POTP (prince of the pit in memory of the legend trader Mr. Richard Denis). for any strategy you need entry point., stop point and exit rules. for the long and short opportunities, I used “dunchian channel “with average of 26 candles and these two lines above and below the charts will reveals the major support and resistance levels and with sup, res it will show you buy and sell opportunities. with calculation the average of last 14 candles closed price the script shows you the best place for your stop. Exit point are based on the 50 EMA plotted on charts and also lost the last sup or res on donchian.
How to use it:
First of all, always use it on 4H time frame because it will cover lots of your losses and also the candles on 4H charts are more accurate.
The channel has two colors, green and red. when the green is above the red its buy opportunities and vice versa. Your stop loss must be below the entry candle`s dot in long positions and above in short ones. If the price goes in favor, you can save some of your profit by moving the stop level. for this matter use the dots positon, when three of them formed a line and aligned, move your SL below them.
Exit rules; the first rule is if the red and green line switch position, clearly you have to close the position immediately. as the second exit rule; If points are formed twice opposite they direction of the trade you have to close the position, for example in long position if we see two points lower than the last ones it’s time to leave the table .as the last rule if the chart breaks the EMA with a solid candle against our trade direction, we will leave. with these set of rules most of the losses caused by a side market will be covered.
Tips: if the stop levels are too far, you can change the script time frame in to 2H, but do not leave the 4H chart time frame.
For the channel I`ve set the 26 candles and 14 candles for the stop loss points by default, in the script setting you can change it. feel free to change it and retest.
hop you enjoy …

Median Convergence DivergenceIntroduction
The Median Convergence Divergence (MCD) is a derivative of the Moving Average Convergence Divergence (MACD). The difference is the change in the use of the measure of central tendency. In MACD, moving average (mean) is used, whereas, in MCD, the median is used instead. The purpose of using the median is to eliminate the outlying values, which would be calculated for a moving average. The outliers would affect the value of the moving average.
For example: 3, 5, 7, 8, 5, 4, 2, 1, 6, 21, 8. The data set average is 6.3, whereas the median value is 5. There is a difference of about 23% in the example. The reason is the outlying value '21' in the data set.
As the markets are volatile, outlying values can always emerge. A moving average will consider those values; on the other hand, the median will ignore. If the strategy calls for a tool to ignore the outliers, the Median Convergence Divergence would be a great centered oscillator.
The default values have changed to suit the current trading days in a week. When the MACD was introduced, there would be six trading days in a week. Therefore, it used 12 (2 weeks), 26(4 weeks), and 9 ( 1.5 weeks). But now that there are five trading days per week. The default values are adapted to them. Feel free to change them as per your wish.
Recommended Settings
The current settings are set to be used for the Daily Time Frame: 5 day period for the fast line, a 20 day period for the slow line, and a 10 day period for the signal line. (5 days represent a trading week, 10 days is two weeks, and 20 days is 4 weeks or a month)
For the weekly charts, use 4 week period for the fast line, 13 week period for the slow line, and 8 week period for the signal line. (4 weeks represent a month, 8 weeks is two months, and 13 weeks is 3 months or quarterly)
And for monthly charts, use 3 month period for the fast line, 12 month period for the slow line, and 6 month period for the signal line. (3 months is quarterly, 6 months is bi-yearly, and 12 month is yearly)
It'll be challenging to measure for intraday since there are many different timeframes within intraday. The settings mentioned above should also be customized as per the requirements of the trading strategy.
Strategy
The strategy application is the same as the MACD, i.e., Signal Line Crossovers, Zero Line Crossovers, and Divergence.
Signal Line Crossovers: When the MCD line crosses above the Signal line, it's a bullish crossover. When the MCD line crosses below the Signal line, it's a bearish crossover.
Zero Line Crossovers: It's a bullish crossover when the MCD line crosses above the Zero line. When the MCD line crosses below the Zero Line, it's a bearish crossover.
Divergence: When price shows a lower low, but MCD shows a higher low, it's a bullish divergence. When the price shows a higher high but MCD shows a lower high, it's a bearish divergence.
Using other indicators in conjunction with the Median Convergence Divergence is recommended to take entry and exit signals.

RSI Effective Volume Reversal IndicatorAbout The Indicator
I want to start with a few short paragraphs of how this indicator came to be and why it's different than 80% of the indicators on this platform. If you are just interested in how the indicator works, you can skip the story, although I recommend at least skimming through it.
Originally, this indicator was developed to be part of a trend-trading strategy that analyzed the three main components - Price , Volume and Strength . It was broken down to 2 indicators - on-chart and off-chart, similarly to my first premium indicator "Trend Indicator for Directional Trading". Despite the similar concept, the current one is miles ahead in almost any regard.
As most of you know, strategies (especially the really good ones) are fairly more complex to use and navigate. You need to input the parameters for generating and tweaking the indicator, then you need to enter your risk management parameters like stop loss, position size, etc. and finally you need to set the exit criteria, like specified percent target, trial stop or an indicator condition. So, what was supposed to be a simple strategy that anyone can use and make money with, turned out to be a very complex one with over 20 parameters to tweak. I know from experience that when it comes to trading, less is more. This is especially true for the indicators.
As a result, I decided to split the project into two separate strategies - one for trend/directional trading and one for volume and strength (the one you are looking at right now). The problem was that as a standalone strategy it didn't perform all that well. And it shouldn't come as a surprise to anyone who has been trading long enough - divergences are one of the biggest tricksters there are - easy to identify only in hindsight. They are the new-trader's doom. I lost a decent amount of money chasing tops and bottoms through divergences and for that reason it's always been somewhat a goal of mine to create an indicator that can assist in this conquest (call it a personal vendetta). This indicator comes as close as I've ever been to this goal.
Right, but I just said a few lines above that this indicator doesn't work that well for divergences? That's true, but only if you completely automate it and let it buy every bullish and sell every bearish divergence. I have extensively tested it on the securities I actively trade (SPX500, Crude Oil, Gas, Gold, Copper) and with the right settings it does generate positive return (what strategy wouldn't with enough optimization, right?), but I would have made so much more money if I didn't fight the trend.
So, I decided to do something else - convert the strategy back to an indicator and use it for discretional trading in which it assists (not explicitly tell) me in making the decisions. And oh boy, did I hit the sweet spot there! It has been notoriously difficult for most scripts and indicators to identify proper support and resistance levels or at least not nearly as good as the human eye can do. This is especially the case with ascending and descending channels. Seeing how well it worked in helping me open longs and shorts at key levels, I decided to strip it from all unnecessary features and simplify the interface for easier navigation (about 300 lines of code less). This brings me to my next point.
How Does It Work?
The indicator relies on two main components in order to identify reversals - RSI module and Effective Volume module, hence the name RSI Effective Volume Reversal Indicator (not very creative, I know). You select which one you want to display via the dropdown menu. Now let me outline how each one works.
RSI module (top) - similarly to the traditional RSI, it is bound between 0 and 100. Oversold area is marked in green (15-25) and overbought area is marked in red (75-85). You can change those as you please, but I found those to be the perfect spots for identifying potential opportunities. This is where the similarities end. As you've noticed, it's not nearly as choppy as the traditional RSI, just the opposite - it's rather smooth, resembling Heikin-Ashi candles. Further, the way the candle is formed can indicate if we are approaching a top or bottom and if you should be looking for an opportunity to open a trade against the trend. Believe it or not, I've been developing and using this indicator for the past 6 months, so there's a lot to be said about the formation of those candles with clear examples, but I will leave those for the guide book that comes along with each purchase/subscription.
Effective Volume (bottom) - As I already have developed quite an extensive indicator that utilizes the effective volume profile, I just grabbed certain elements from it, simplified it and smoothed it via a new custom-made moving average along with some other minor updates. The results from RSI and Effective Volume may seem quite similar, but they actually reveal slightly different information and can be used to complement each other. In terms of coloring - green gradient above 50 and red gradient below 50.
What To Expect
It's important to understand that technical analysis does not predict prices. I am not claiming this indicator to be the crystal ball that will tell you when to long or short with max leverage. All I am saying is that it's a pretty good tool to help you time your trades, show real exhaustion of trends and reveal when a new direction is forming.
This indicator has been, and most likely will continue to be, work in progress. I've been experimenting with tons of features to make it better for the past 6 months and I finally believe it is stable and beneficial enough in order for you to use it. There's always something more that I would like to add and/or change, but I know that if I continue digging and improving, the indicator would have never seen the light of day. That's why I want to add the critical component to it - you. Through your feedback and recommendations, I believe we can make this indicator truly a masterpiece.
With that being said, I do have some future improvements planned, which I will be releasing on the go. Some are major, like updating it to v.5 and adding new features that are only available to the newest version of PineScript, while others are minor, such as color variations and more one-click customizations.
I hope I managed to portray an objective picture (with reasonable amount of words) of something that I've put a lot of work into, so that you can successfully use and make even more money on the markets. Once again, each purchase/subscription of this indicator comes with a guide in which I go into great detail explaining how to use the indicator, so rest assured that you will be able to take full advantage of it.

Swing Dream - PAINT BARS | MA | EMA | DMA | VWAP | TABLE | ADR %- Swing Dream -
Script created for breakout-swing traders, in the style of QullaMaggie * , Dan Zanger, Oliver Kell, and Stockbee.
The following indicators are used by most successful breakout-swing traders such as mentioned above.
(As published) it contains:
Painted Bars, also known as inside/outside candles. Used for candle analysis and to determine breakout pivots & levels. For instance; use it in different timeframes and seek formations (ex, 3-1-2). For further inspiration, study Rob Smith's The Strat .
MA, Simple Moving Averages (Basic levels = 10,20,50,200). Use this indicator to define resistance/support areas as well as the overall long/swing-term trend. In breakout strategies such as EP, Flags, etc this can be used for trailing stops; an example, post-breakout, let the price ride the 20ma before exiting your position.
EMA, Exponential Moving Averages with periods inspired by Qullamaggie (10,20,65). Use this on shorter timeframes (ex, 1h) and for the same principles as MAs.
VWAP, Volume-Weighted Average Price. As for the previous, utilize this as a level indicator to find areas of resistance/support. Good for swing-trading as it implies whenever holders are profitable or not.
DMA, Displaced Moving Average (Horizontal). Personally, I use this a lot. Works very well for trailing stops (post breakout) and "bounce" areas. Choose your own offset and period.
ADR%, Average Daily Range Percentage. Displayed in the table and used to define a symbol's volatility. A very good tool for Qullamaggie-style trading. Personally, I try to find setups with over 6% ADR. Basic definition; low ADR% = Increased chance of a symbol to move slower and in smaller ranges. A higher value equals the opposite.
Table. A table with basic symbol-related information. Could save you plenty of time whenever you scan or search for new swing setups. Looking to add more features here.
Why should you use this script? Well, instead of having tens of different indicators, use this script and combine everything together with EP, Flag, or breakout principles. Suited for every plan, and more efficient in my opinion.
View settings to turn on/off different indicators.
* If you're looking for an introduction and further explanation of how Qullamaggie uses mentioned indicators, I could recommend checking out his website, stream, or participation in "Chat With Traders".
At last, I want to credit: @jkcqld @neolao @TheScrutiniser
This Script will get updated and improved.
// TechFille006

NEXT Stochastic 3xVW (Triple Volume Weighted)Overview:
This responsive version of the Stochastic oscillator modifies and extends the original to incorporate volume. It does so on 2 levels: by using Volume-Weighted Moving Average (VWMA) as input and applying a triple volume weighting filter within the internal algorithm, intelligently blending volume with what is otherwise pure momentum/distribution analysis. The result is more binary-like curve behavior (%K and %D oscillator lines), whose polarizing movement acts as both a signal and filter.
Below is a screenshot comparing NEXT Stochastic 3xVW with default settings to the original Stochastic oscillator on NQ M1 chart.
Application and Strategy Ideas:
NEXT Stochastic 3xVW is intended to be used like the original Stochastic oscillator within the context of technical analysis: identifying overvalued (above upper limit) and undervalued (below lower limit) price action, as well as establishing a bias baseline (bullish if over 50; bearish if under 50). Higher NEXT Stochastic 3xVW bottoms compared to lower price bottoms signify bullish divergence; lower NEXT Stochastic 3xVW tops compared to higher price tops signify bearish divergence. Trading %K/%D line crossing is also a popular strategy, with %K crossing over %D indicating bullish sentiment and %K crossing under %D indicating bearish sentiment.
Below is a screenshot showing NEXT Stochastic 3xVW overbought/oversold intraday strategy on SPY M1 chart. NEXT Stochastic 3xVW is set to 5,10,1,3 with long signal issued at lower limit of 30 and short at upper limit of 70.
Input Parameters:
VWMA Length - controls the averaging length of the volume-weighted moving average (based on close price and volume); used as Stochastic input
%K Length - volume-driven averaging length of the %K oscillator line - this is the faster of the two Stochastic lines
%K Smoothing - volume-driven smoothing factor of the %K line
%D Smoothing - volume-driven averaging length of the %D oscillator line (a %K derivative, post smoothing) - this is the slower of the two Stochastic lines
Upper Limit - the NEXT Stochastic 3xVW level above which market is considered overbought, default is 80
Base Bias - the NEXT Stochastic 3xVW level above which market bias is considered bullish, and below bearish
Lower Limit - the NEXT Stochastic 3xVW level below which market is considered oversold, default is 20
Signals and Alerts:
Discover and visualize NEXT Stochastic 3xVW strategies using the companion NEXT Strategy Visualizer indicator. While the %K/%D cross alerts can be set via NEXT Stochastic 3xVW indicator, the Strategy Visualizer will only plot long/short signals when %K or %D cross over or under overbought/oversold levels (as hown in the above SPY M1 screenshot). That being said, the next version of the Strategy Visualizer will also support %K/%D crosses.
Here is how to set NEXT Stochastic 3xVW %K/%D crossing alerts: open a chart, attach NEXT Stochastic 3xVW, and right-click on chart -> Add Alert. Condition: Next Stochastic >> %K >> Crossing >> Next Stochastic >> %D

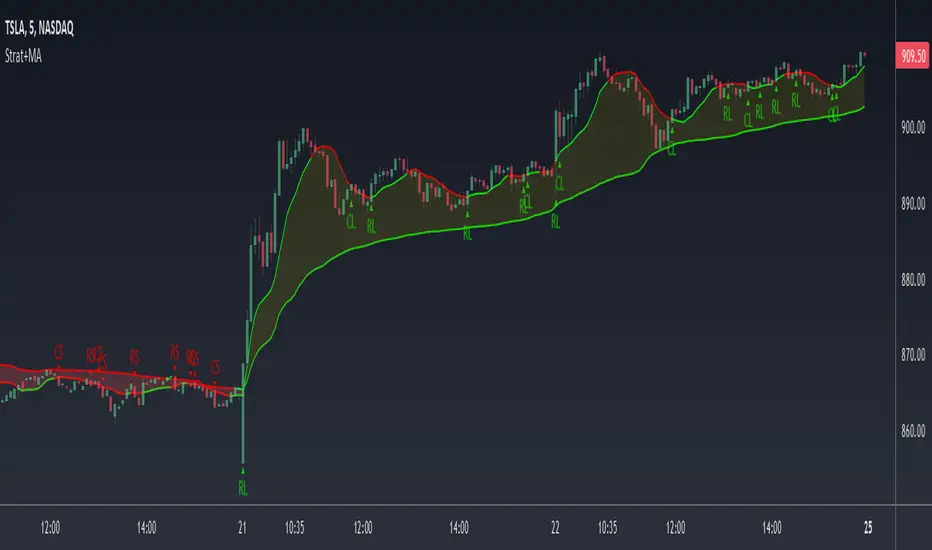
Strat+MA1= Inside Candle
2= One side, high or low of the previous candle is taken out
3= Engulfing Candle/Outside Candle. i.e. both sides of the previous candle are taken out
Enter any 2 moving averages.
Shows Strat setups(reversals/continuations) or when candles are above MA 1 and crosses MA 2
Choose between SMA, EMA or VWMA
Strat Setups: 22, 212, 312, etc.
RL = Reversal Long
CL = Continuation Long
RS = Reversal Short
CL = Continuation Short
L = Candle is above MA1 and has crossed above MA2
S = Candle is below MA1 and has crossed below MA2
Reversals Long(RL):
22 = last candle 2 down. current candle 2 up
212 = 3rd candle 2 down, last candle inside and current candle 2 up
312 = 3rd candle outside candle, last candle inside and current 2 up
Continuations Long(CL):
22 = last candle 2 up, current candle 2 up
212 = 3rd candle 2 up, last candle inside and current candle 2 up
312 = 3rd candle outside candle, last candle inside and current 2 up
Reversals Short(RS):
22 = last candle 2 up. current candle 2 down
212 = 3rd candle 2 up, last candle inside and current candle 2 down
312 = 3rd candle outside candle, last candle inside and current 2 down
Continuations ShortCS):
22 = last candle 2 down, current candle 2 down
212 = 3rd candle 2 down, last candle inside and current candle 2 down
312 = 3rd candle outside candle, last candle inside and current 2 down
You can choose to have the strat setups shown or just when the candles are above MA1 and cross MA2
When MA2 is above MA1, the fill is green and red when MA2 is below MA1
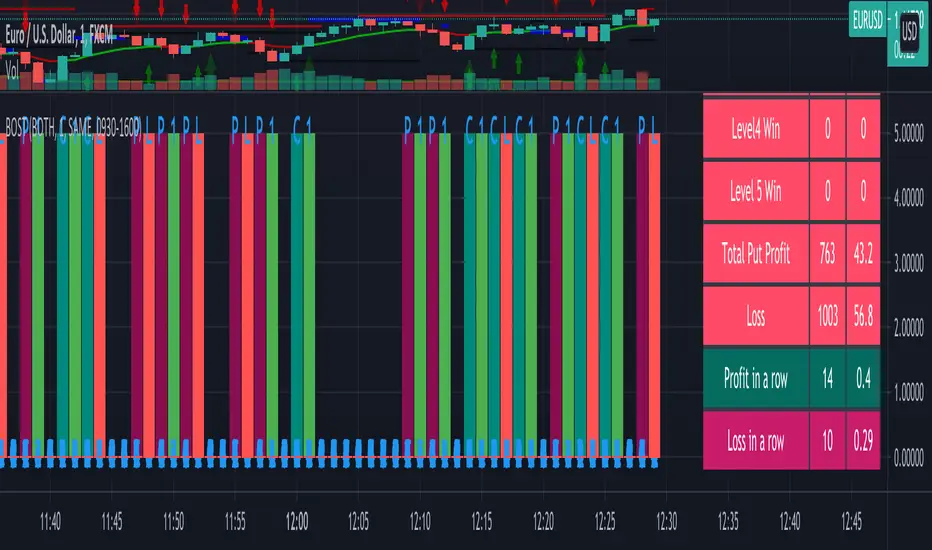
Binary Option Strategy Tester with MartingaleIn Binary options, strategy testing is a bit different. The script is just a try to test Binary options strategies.
Assumption:
We are opening position at next candle after signal come
We are taking the position at opening price
Our call will be profitable if we get a green candle and put will be profitable if we get a red candle
We can open only one trade at a time. So if we are in trade, subsequent signals will be ignored.
The script is not counting your profit or loss, it just counting the winning and losing trades.
Input Options:
Choose long only or short only test. Default is both.
You can continue your trade with Martingale Level, up to 5. Default is 1 (no Martingale)
You can choose Martingale trade type
SAME: if call subsequent trade will be call only and vice versa
OPPOSITE: if call subsequent trade will be put
FOLLOW CANDLE COLOR: Subsequent trade will follow previous candle color
OPPOSITE CANDLE COLOR: Subsequent trade will opposite of previous candle color
You can choose trading session to test. Default is false.
The strategy is taken from Vdub Binary Options SniperVX v1 (by @vdubus) . I have deleted extra parts and kept only the necessary part.
Without Martingale
Result Table
With Martingale
I am very new to Pine script, so waiting for your comments and review.
HYE Combo Market [Indicator] (Vwap Mean Reversion+Trend Hunter)Indicator version of the strategy:
* Alerts added.
TIPS AND WARNINGS
1-) The standard settings of this combo script is designed and tested with daily timeframe. For lower timeframes, you should change the indicator settings and find the best value for yourself.
2-) Only the mean vwap line is displayed on the graph. For a detailed view, you can delete the "//" marks from the plot codes in the script code.
3-) This is an indicator for educational and experimental purposes. It cannot be considered as investment advice. You should be careful and make your own risk assessment when opening real market trades using this indicator.

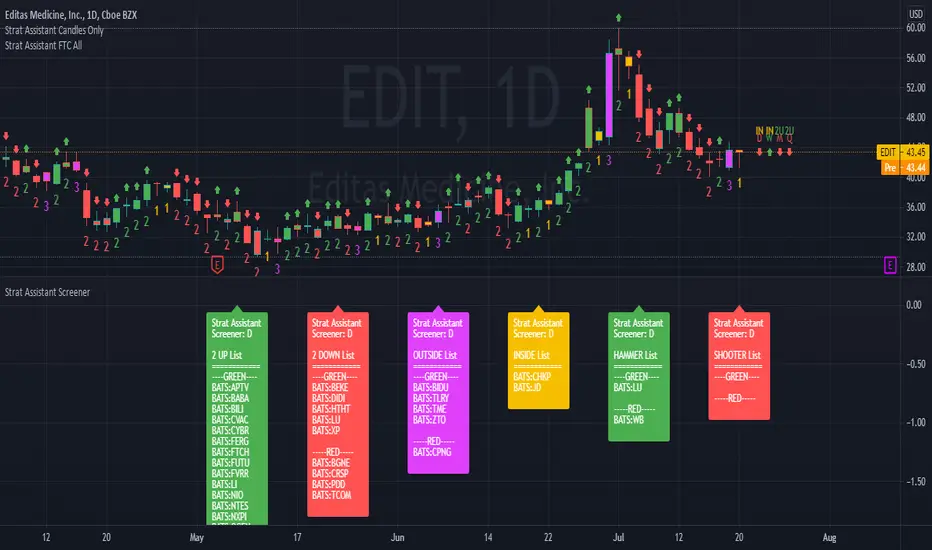
Strat Assistant Screener MiniStrat Assistant Screener Mini
----------------------------
█ OVERVIEW
This script is intended to provide screening/scanning functionality for the strat for the time period provided in the input (Day is the default).
When added, the script provides a chart with labels separated for each type of candle (2 up, 2 down, outside, inside) as well as actionable signals (inside already provided, hammer, shooter). This script functions the same way as the other strat assistant screener however is limited to 5 tickers and is used more for intraday trading and speed.
█ DETAIL
Inputs
----------
Security/Screener Time Frame: The screener will only run for one time frame, the time frame selected and this can be changed
Actionable Wick Percentage: The percentage of the WICK to determine a hammer or a shooter. For example, the default is .75 or 75%, which means 75% of the candle must be a WICK (top wick 75% for shooter, bottom wick 75% for hammer). If you wish to be more conservative scale it down or more aggressive scale it up
Label Index Offset Factor: There are 6 separate labels that will appear at the bottom separated by this indicator. If you feel like things are too tight or too narrow you can adjust this to spread things out further, or push them closer together.
Security/SXX: The various securities that can be input to track. If you find this is a pain, you can always copy the source code, put it in the pine editor yourself, and manually modify them there. This is the mini version limited to 5 stocks for performance and intraday trading.
Outputs
----------
The screener will provide a second chart at the bottom of the primary chart with labels for the types of candles and actionable signals
Each label will be present even if no results are found.
The label will display the time frame selected toward the end of the header - Strat Assistant Screener:
Each label is colored for quick reference to indicate the various bull/bear/inside/outside "patterns"
Best Practices
----------
While it's limited, it's still not instant. So give it time.
This screener is best used for intraday. If you want something with more data, try the the non mini versino.
The bottom chart can be scaled and moved just like the top one, play around with it to determine what works best for you. I recommend decreasing the scale and then moving it up so you can see it better.
When the time frame is changed, it will take a minute, you can verify the results by seeing the time frame change in the label - Strat Assistant Screener:
I have not played with this thoroughly intraday yet. So it may be buggy/slower.
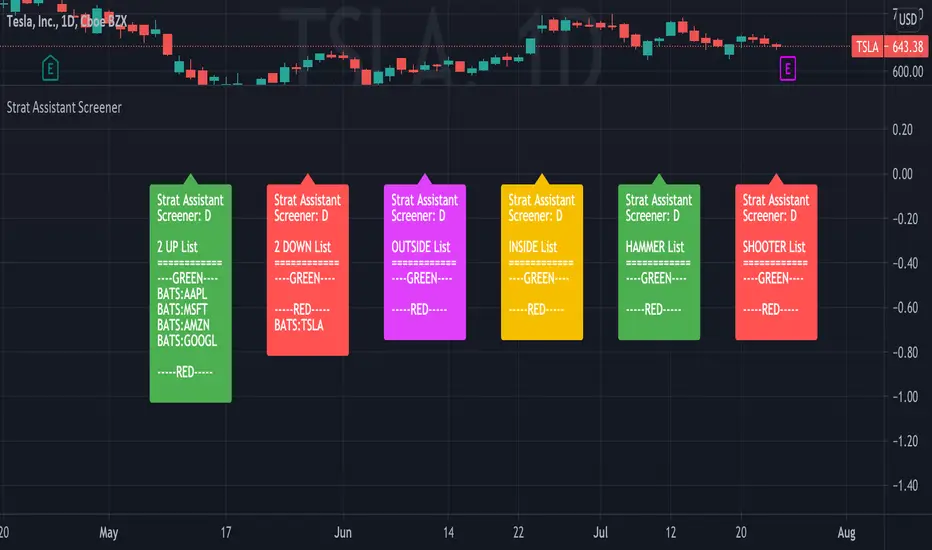
Strat Assistant ScreenerStrat Assistant Screener
----------------------------
█ OVERVIEW
This script is intended to provide screening/scanning functionality for the strat for the time period provided in the input (Day is the default).
When added, the script provides a chart with labels separated for each type of candle (2 up, 2 down, outside, inside) as well as actionable signals (inside already provided, hammer, shooter). Trading view is limited to 40 "security/ticker/symbol" calls so only 40 at a time are available. It's best to run this on higher time frames as it will occasionally push peak trading view memory limits and throw an error. Various inputs are provided a detailed below. It's not FAST so be patient please.
█ DETAIL
Inputs
----------
Security/Screener Time Frame: The screener will only run for one time frame, the time frame selected and this can be changed
Actionable Wick Percentage: The percentage of the WICK to determine a hammer or a shooter. For example, the default is .75 or 75%, which means 75% of the candle must be a WICK (top wick 75% for shooter, bottom wick 75% for hammer). If you wish to be more conservative scale it down or more aggressive scale it up
Label Index Offset Factor: There are 6 separate labels that will appear at the bottom separated by this indicator. If you feel like things are too tight or too narrow you can adjust this to spread things out further, or push them closer together.
Security/SXX: The various securities that can be input to track. If you find this is a pain, you can always copy the source code, put it in the pine editor yourself, and manually modify them there. Trading view limits you to 40 securities/symbols/tickers so I've pushed the limit as far as I can with this script.
Outputs
----------
The screener will provide a second chart at the bottom of the primary chart with labels for the types of candles and actionable signals
Each label will be present even if no results are found.
The label will display the time frame selected toward the end of the header - Strat Assistant Screener:
Each label is colored for quick reference to indicate the various bull/bear/inside/outside "patterns"
Best Practices
----------
It is not fast, so please be patient and let it run.
This screener is best used as a utility a few times a day, not recommended for intraday. I will create a scaled down version of this will only 5 securities/symbols/tickers that can be used intraday.
The screener pushes the limits of training views provided memory, so you may occasionally see errors, please try a higher time frame.
The bottom chart can be scaled and moved just like the top one, play around with it to determine what works best for you. I recommend decreasing the scale and then moving it up so you can see it better.
When the time frame is changed, it will take a minute, you can verify the results by seeing the time frame change in the label - Strat Assistant Screener:
I have not played with this thoroughly intraday yet. So it may be buggy/slower.
InvictusHello,
I introduce my strategy that provide signals for entering in the market and signal for exit.
This indicator attempts to show a trader when is the best time to open a long or short position. The calculations are partially based on volatility, SMA, EMA and predefined values depending on used timeframe.
We collect data from comparing the current price, calculating the average move of the market, top, bottom and close of the latest bars. The middle line is an adaptive moving average, which is the base of the signals and we also use it as a Trend Line to determine if we are in long or short "condition". The basic idea of this indicator is to show the best place to open a Long or Short position and when to close it.
It is very simple - there are 2 type of signals - LONG (in green) and SHORT (in red). You can close your position when a TP (Take profit) shows up or based on your calculations.
You can chose from several options which strategy you want (there is a "Strategy" select in the settings). The strategies that are proving better according to our tests are marked with a diamond.
Don't forget to always trade with caution, trading is dangerous don't trade more than you can afford to lose.
Please contact me via personal message if you want to test the strategy or for more information.
Thank you.

Add funds simulator This script is intended to help understanding better and practice how to exit DCA deals that are in negative.
Multiple factors factors are relevant when trying to exit a bad deal:
How much funds are invested
What's the current average position price
How far the price has already dropped from that average
Is the price bouncing significantly and frequently to the upside providing multiple opportunities to exit or is it still a free-falling knife dumping heavy?
What are your TP % expectations
This scripts allows you to enter all these parameters visualising them all together in a single chart.
The RSI exit strategy
You can then make use of a simple exit strategy based on RSI.
The strategy will trigger entries where you are planning to add funds.
The chart will show you based on all this information how much funds you would have required to exit in profit and rescue the deal in green.
It will also flag if the exit strategy would have failed by plotting a red label indicating all the times where the TP wouldn't have been reached.
Comments
Adding funds to a red deal and making it worst is one of the worst nightmares of traders using dollar-cost-average strategies.
I hope this script can help you visualise better and practice adding funds in a safe chart before ever jumping into real-money!
If you guys like this script we can add more features in the future, just leave a comment if you have new ideas.

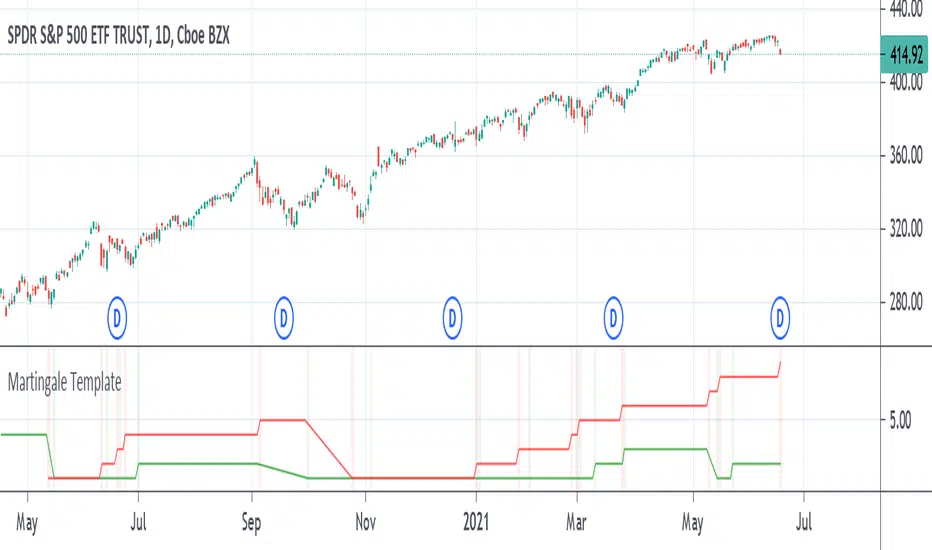
Martingale TemplateA template example on how to apply the famous Martingale gambling strategy. When your strategy gets an exit signal for your long position that leaves you without profit, you re-enter on the next entry long condition with double the capital of the previous amount entered with. You keep doubling the amount of capital entered with until you finally exit with a profit. If the strategy isn't sound enough then it could take several attempts and it can take only as much as a dozen tries to eat away at all your capital as the capital required to double on the next entry increases greatly over time by consecutive products of 2.
The strategy used is just a simple moving average crossover, above the moving average is going long, below the moving average is going short. It can be replaced with whatever strategy that you want. The colored vertical bars show long and short positions and exits. The default option on the tick box under the settings show the number of attempts at entering before finally exiting with a profit, the other option shows the amount of capital it took starting from 1.
KayeDinero TrendSetter HFX NFXThis script combines my volume and trend indicators with an added flare.
The mindset for this strategy is a trending market, where price is moving in a consistent direction with some reversals.
The most unique concept of this script is the background calculator (divergent). This is different from other scripts on the platform because of the close tie in with the relative strength index as well as the on balance volume. The divergent lets you know of overbought and oversold conditions.
Another unique take, is the use of the Keltner Channels, which provides insight on volatility.
Best Traded during Hours 3am to 12am EST (NY Time).
This method works best in trending markets.
Time Frame, 1,3,5,15,30min
Currency Pairs: All Major, Exotic, Crypto
Here's The Strategy:
Oversold and Buy: When those are present, proceed to take a buy (call) option.
Overbought and Sell: When those are present, proceed to take a sell (put) option.
Keep in mind, timeframe will depend on your time of trading in the markets.
Morning typically 2-4min
Afternoon / Evening: 3-5min
Hint:
Best Trades on reversals at top and bottom of Keltner Channels.

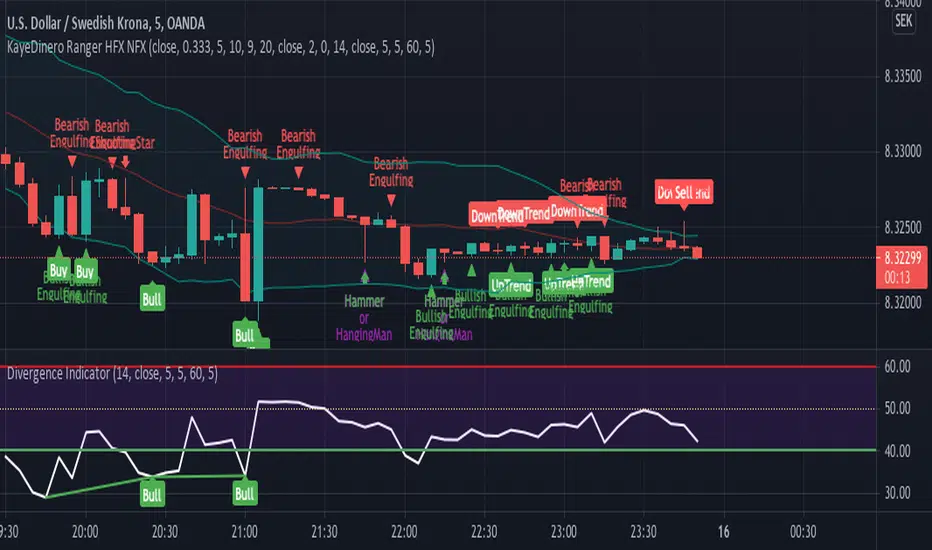
KayeDinero Ranger HFX NFXThis script combines my favorite indicators with an added flare.
The mindset for this strategy is a ranging market, where price is moving in a consistent wave like pattern.
The most unique concept of this script is the candlestick indications. This is different from other scripts on the platform because of the close tie in with the relative strength index as well as the on balance volume.
Best Traded during Hours 3am to 12am EST (NY Time).
This method works best in volatile markets.
Time Frame, 1,3,5,15,30min
Currency Pairs: All Major, Exotic,
Here's The Strategy:
Uptrend and Buy: When those are present, proceed to take a buy (call) option.
Downtrend and Sell: When those are present, proceed to take a sell (put) option.
Keep in mind, timeframe will depend on your time of trading in the markets.
Morning typically 2-4min
Afternoon / Evening: 3-5min
Hint:
Best Trades on reversals at top and bottom of Bollinger bands.
Legacy Scalper - Trend Trading SystemLegacy Scalper Trend Trading System
Welcome to the Legacy Scalper
This indicator is based on a trend trading strategy using multiple EMA's, with an added colored algo to help traders enter orders while simultaneously reducing noise in the markets by changing candlesticks to one solid color dependant upon direction of price.
This indicator capitalizes on short term momentum while ensuring that you are trading with the trend using the commonly known fact of EMA's being above or below price to ensure the trend.
The customization and plotting of different length EMA's allows for freedom to design your own system within the realm of the indicators, or use the recommended strategies below.
////////
The Legacy Scalper plots 3 main EMA's listed as following:
-50 EMA
-200 EMA
-800 EMA
Additionaly there is an algo coded into the mix that allows for:
- Tradingview alarms for buys and sells
- change of period (frequency) for buys and sells
- color selection of the moving average
- change all candlestick color dependant upon buy and sell alerts.
////////
The Strategies (Or Create Your Own)
Basic
Sell only when you get an alert above the 50 EMA (Only 50 EMA plotted on screen)
Buy only when you get an alert with the 50 EMA below price (Only 50 EMA plotted on screen)
Sell Example:
Intermediate
Sell only when 50EMA is below the 200EMA and you get a sell alert
Buy only when the 50 EMA is above the 200EMA and you get a buy Alert
Buy Example:
Advanced
Sell only when you get a sell alert with all EMA's above price
Buy only when you get a buy alert with all EMA's below price
Example:
Legacy Mode
Backtesting is highly recommended
Remove EMA's and plot a high period MA and take alerts both ways to capitalize on longer moves
And/Or
Add Ema's for swing trading with a higher plot MA
Example:
NOTES:
This is designed to work on all time frames
This is designed to work on all financial instruments
Feel free to backtest which period setting is best, however visually glancing at most charts the default setting appears the best across all instruments.
Feel free to add in other indicators for additional confirmation such as an RSI, TDI, Stoch, or WAE
DISCLAIMER
THIS IS NOT FINANCIAL OR INVESTMENT ADVICE AND SHOULD NOT BE INTERPRETED AS SUCH.
Trading foreign exchange on margin carries a high level of risk, and may not be suitable for all investors. Past performance is not indicative of future results. The high degree of leverage can work against you as well as for you. Before deciding to invest in foreign exchange you should carefully consider your investment objectives, level of experience, and risk appetite. The possibility exists that you could sustain a loss of some or all of your initial investment and therefore you should not invest money that you cannot afford to lose. You should be aware of all the risks associated with foreign exchange trading, and seek advice from an independent financial advisor if you have any doubts.

#TheStrat - Highs and Lows of Candles of 4 Custom Time framesThe bread and butter of strat traders is multi-timeframe analysis. We do MTFA in 2 different ways: 1) By Looking for entries confirmed by Full Timeframe Continuity which is just another way of saying that on multiple timeframes, the candles currently forming are all uniform in direction(ie. all red candles or all green candles), and 2) Looking for Strat reversal on lower timeframes that trigger your higher timeframes reversals.
This script is concerned with the latter piece of multi-timeframe analysis, and its application to the strat
Anyone who has watched Sara's videos teaching the strat can see how she uses the highs and lows of her major time periods, the monthly, weekly, and daily, to find entries from her lower time periods to trigger her higher timeframes. This script performs the process of marking the highs and lows of 4-major time periods automatically so that you do not need to mark every single chart you use manually. I have found this script to be very useful, and convenient. I hope that other stratters find it as useful as I am. Below outlines how to use this, although it is mostly self-explanatory. Special thanks and credit to millerrm, who I used his original code snippets to rework his original script to something more tailored to my personal use cases.
Settings -
You can change the time periods of the candles that you would like to mark to any time frame using the 4 dropdown boxes marked TF#
You can choose to toggle the lines for each given time period on and off, in the settings by checking off each time period.
The default colors are purple, blue, orange, and white, in order respective of time from shortest to highest
The default time periods are 3hr, 6hr, 12hr, and daily

CPR, Camarilla & Moving AverageThis script is created primarily for Intraday trading but can also be used for short and long term trading. This is a combination of Central Pivot Range (CPR), Moving Averages and Camarilla Pivot levels (with inner levels). This helps you to combine the strategies of CPR and Moving Averages to identify the best trading opportunities with greater edge. Central Pivot Range and Camarilla pivots are taken from PivotBoss by Franc Ochoa.
Key features:
# Daily CPR levels
# Weekly CPR levels
# Monthly CPR levels
# Previous Day High and Lows
# Previous Week Highs and Lows
# Previous Month Highs and Lows
# Camarilla Pivots with inner Levels
# CPR Levels for the next Day, Week and Month
# 5 Simple moving averages and 5 Exponential Moving Averages
What separates this script from other scripts with CPR and Moving averages?
# One of the few indicators (if not the only one) which combines the 2 types of Moving Averages, CPR and also Camarilla Pivots.
# CPR Levels for not just the next Day, but for next Week(Weekly CPR) and Month(Monthly CPR) also.
# Hide the previous day's levels according to your wish. This is the most unique feature of this indicator. You can set the number of Daily CPR levels you want to load in the chart. This is not just for the Daily CPR but also for the Weekly and Monthly CPR also. This makes the chart less cluttered and prevents the candles from getting buried in the indicators. Please notice how the previous day's CPR levels are hidden in the displayed demo chart on the script page. In the chart, only one trading day's data is shown(by default).
# This script is OPEN SOURCE.
Strategies :
For CPR & Camarilla Strategies for intraday trading and swing trading refer to the book 'Secrets of a Pivot Boss: Revealing Proven Methods for Profiting in the Market' by Franklin O. Ochoa.
Moving averages strategies :
Moving averages can be combined and also used individually for several strategies
* 9 EMA can be used as trailing stop loss for strong moving trends that helps you to catch big moves.
* 20sma can be used not just trailing stop loss but also for taking re-entry to the trend.
* Golden cross - The golden cross occurs when a short-term moving average crosses over a major long-term moving average to the upside. This indicates a bullish turn in the market. Eg: 50 SMA cuts 200 SMA from below.
* Death Cross - The death cross occurs when the short term moving average crosses the long-term average from above. This indicates a bearish turn in the market. Eg: 50 SMA cuts 200 SMA from above.
* When 20 SMA is above 50 SMA and 20 SMA and 50 SMA are angling up like parallel lines, then it denotes bullish strength. If this happens right after Golden Cross, big moves to the upside can be expected.
* When 20 SMA is below 50 SMA and 20 SMA and 50 SMA are angling down like parallel lines, then it denotes bearish strength. If this happens right after Death Cross, big moves to the downside can be expected.
* When 20SMA and 50 SMA are going flat and crossing each other, then it denotes sideways sentiment.
Moving average strategies are taken from the book 'How to Make Money in Intraday Trading' by Ashwani Gujral. For learning more about how to combine CPR and Moving averages in your trading please refer to this book.
