Hilega-MilegaPublishing this script on special request.
script siulates the strategy given by very polite and veteran trader from Patna ( NK Stock Talk ) . according to him, one can predict the market movement in any timeframe by applying some correlations of volume and price on top of strength.
He recommends to apply weighted moving avergage ( to predict volume factor ) on top of RSI and EMA to predict price ( on top of RSI again ) along with VWAP . i could not include VWAP here in script but it can be added separatly by just striking "/" on chart.
for more information and understanding on the strategy, one can refer the channel of NK Stock talk
search "Hilega To Milega (Hilbe_milbe ) Trading & Investing super System" on youtube.
Hopefully this will be usefull for all those who are using basic serverice of trading view and could not do indicator on top of indicator.
Disclaimer : I am just publishing for public use and nothing is recommendation. please understand it first before applying to trading. purpose of this script is solely on giving example how pine can be used to solved indicator on indicator problems. all credit to person who created this strategy.
Thanks
-daytraderph
在脚本中搜索"the strat"

Alert// Short+long: SAR+HMA+Bollinger+support/resistanceHello, dear friends.
This script can be used for various strategies. Whether it's a scalp like now or more positional purchases. To determine the minimum and maximum, SAR ,resistance points, support points+HMA+ Bollinger channel are used. The entry occurs when the SAR intersects with the HMA , if it is above or below the support/ resistance levels.
In the settings there is a "back" how many bars to use back to search for these conditions.Also the standard setting is SAR+ multiplier.
The strategy based on these alerts is the same, but the conditions stipulate that the entry into the deal does not occur (while you are in the deal) if the purchase is more expensive than the previous one.

Interstellar / buy and sell
Interstellar is the buy and sell indicator for trading on TradingView
Buy and sell signals are tested, improved, developed and tried until we reach the highest precision we aspire to, so that we do not need further updates.
Before publishing the Interstellar indicator, we made sure that we reached the best and most accurate version, which exceeded the accuracy of the signals 90%
How does the Interstellar indicator work?
The algorithm behind buy and sell signals is based on a set of more important and accurate technical indicators that give signals to change direction early.
When conditions are met on all indicators, it produces only very accurate and high probability trading signals and significantly reduces false signals.
For a more detailed illustration of the strategy, see the following image:
i.imgur.com
Look at the picture above and imagine with me that there are a bunch of technical indicators going next to each other to get to level 20 and Level 20 represents the killer point that gives the entry or exit signals.
When all these indicators agree and reach Level 20, you have met all the requirements of the strategy and the buy or sell signal will appear on the chart.
i.imgur.com
In the image above we note that the RSI has not reached the 20th level, what happens in this case?
In this case the signals will not appear on the chart for the incompleteness of the terms of the strategy.
But in the next candle we will have one indicator which is the RSI indicator only and when it returns to level 20 the terms of the strategy are completed and the signal appears on the chart. The rest of the other indicators we will not need because they met the conditions in the previous candle.
When this situation occurs 9 out of 10 times returns the index at a level of 20
In this way the signals of the interstellar indicator are formed on the chart.
Note: The indicators shown in the image above are only for explanation and may not be part of the indicator
/
Why is the Interstellar Index the best deal you get?
It helps you find the best areas for early entry and exit.
It gives more profitable signals than false signals.
Unique strategy and easiest way to trade with high profit rate.
It works in all markets like stocks and forex, but the index is primarily developed in the cryptocurrency market.
Comes with an indicator called Interstellar Trend, this indicator displays Interstellar signals on all timeframes and helps to find solid opportunities.
Works great on large timeframes like 1d and 4h. It also works great on smaller timeframes but prefers to keep up with the trend.
It gives very high profit scores on background tests conducted over a historical period of 24 months.
Not repainted. Once the candle closes, the signal will not change.
Finally, try the indicator for yourself and you will not regret it. There is a 3-day free trial! Let me know if you are interested in the comments section. Send a message directly or request a free 3-day trial.

MACD oscillator with EMA alert version 4HThis is the study/indicator alert version of the macd + ema strategy.
The strategy details are the following :
Is a simple, yet efficient strategy, which is made from a combination of an oscillator and a moving average.
Its setup for 4h candles with the current settings, however it can be adapted to other different timeframes.
It works nicely ,beating the buy and hold for both BTC and ETH over the last 3 years.
As well with some optimizations and modifications it can be adapted to futures market, indexes(NASDAQ, NIFTY etc), forex( GBPUSD ), stocks and so on.
Components:
MACD
EMA
Time condition
Long/short option
For long/exit short we enter when we are above the ema , histogram is positive and current candle is higher than previous.
For short /exit long , when close below ema , histo negative and current candles smaller than previous
If you have any questions please let me know !

Using `varip` variables [PineCoders]█ OVERVIEW
The new varip keyword in Pine can be used to declare variables that escape the rollback process, which is explained in the Pine User Manual's page on the execution model . This publication explains how Pine coders can use variables declared with varip to implement logic that was impossible to code in Pine before, such as timing events during the realtime bar, or keeping track of sequences of events that occur during successive realtime updates. We present code that allows you to calculate for how much time a given condition is true during a realtime bar, and show how this can be used to generate alerts.
█ WARNINGS
1. varip is an advanced feature which should only be used by coders already familiar with Pine's execution model and bar states .
2. Because varip only affects the behavior of your code in the realtime bar, it follows that backtest results on strategies built using logic based on varip will be meaningless,
as varip behavior cannot be simulated on historical bars. This also entails that plots on historical bars will not be able to reproduce the script's behavior in realtime.
3. Authors publishing scripts that behave differently in realtime and on historical bars should imperatively explain this to traders.
█ CONCEPTS
Escaping the rollback process
Whereas scripts only execute once at the close of historical bars, when a script is running in realtime, it executes every time the chart's feed detects a price or volume update. At every realtime update, Pine's runtime normally resets the values of a script's variables to their last committed value, i.e., the value they held when the previous bar closed. This is generally handy, as each realtime script execution starts from a known state, which simplifies script logic.
Sometimes, however, script logic requires code to be able to save states between different executions in the realtime bar. Declaring variables with varip now makes that possible. The "ip" in varip stands for "intrabar persist".
Let's look at the following code, which does not use varip :
//@version=4
study("")
int updateNo = na
if barstate.isnew
updateNo := 1
else
updateNo := updateNo + 1
plot(updateNo, style = plot.style_circles)
On historical bars, barstate.isnew is always true, so the plot shows a value of "1". On realtime bars, barstate.isnew is only true when the script first executes on the bar's opening. The plot will then briefly display "1" until subsequent executions occur. On the next executions during the realtime bar, the second branch of the if statement is executed because barstate.isnew is no longer true. Since `updateNo` is initialized to `na` at each execution, the `updateNo + 1` expression yields `na`, so nothing is plotted on further realtime executions of the script.
If we now use varip to declare the `updateNo` variable, the script behaves very differently:
//@version=4
study("")
varip int updateNo = na
if barstate.isnew
updateNo := 1
else
updateNo := updateNo + 1
plot(updateNo, style = plot.style_circles)
The difference now is that `updateNo` tracks the number of realtime updates that occur on each realtime bar. This can happen because the varip declaration allows the value of `updateNo` to be preserved between realtime updates; it is no longer rolled back at each realtime execution of the script. The test on barstate.isnew allows us to reset the update count when a new realtime bar comes in.
█ OUR SCRIPT
Let's move on to our script. It has three parts:
— Part 1 demonstrates how to generate alerts on timed conditions.
— Part 2 calculates the average of realtime update prices using a varip array.
— Part 3 presents a function to calculate the up/down/neutral volume by looking at price and volume variations between realtime bar updates.
Something we could not do in Pine before varip was to time the duration for which a condition is continuously true in the realtime bar. This was not possible because we could not save the beginning time of the first occurrence of the true condition.
One use case for this is a strategy where the system modeler wants to exit before the end of the realtime bar, but only if the exit condition occurs for a specific amount of time. One can thus design a strategy running on a 1H timeframe but able to exit if the exit condition persists for 15 minutes, for example. REMINDER: Using such logic in strategies will make backtesting their complete logic impossible, and backtest results useless, as historical behavior will not match the strategy's behavior in realtime, just as using `calc_on_every_tick = true` will do. Using `calc_on_every_tick = true` is necessary, by the way, when using varip in a strategy, as you want the strategy to run like a study in realtime, i.e., executing on each price or volume update.
Our script presents an `f_secondsSince(_cond, _resetCond)` function to calculate the time for which a condition is continuously true during, or even across multiple realtime bars. It only works in realtime. The abundant comments in the script hopefully provide enough information to understand the details of what it's doing. If you have questions, feel free to ask in the Comments section.
Features
The script's inputs allow you to:
• Specify the number of seconds the tested conditions must last before an alert is triggered (the default is 20 seconds).
• Determine if you want the duration to reset on new realtime bars.
• Require the direction of alerts (up or down) to alternate, which minimizes the number of alerts the script generates.
The inputs showcase the new `tooltip` parameter, which allows additional information to be displayed for each input by hovering over the "i" icon next to it.
The script only displays useful information on realtime bars. This information includes:
• The MA against which the current price is compared to determine the bull or bear conditions.
• A dash which prints on the chart when the bull or bear condition is true.
• An up or down triangle that prints when an alert is generated. The triangle will only appear on the update where the alert is triggered,
and unless that happens to be on the last execution of the realtime bar, it will not persist on the chart.
• The log of all triggered alerts to the right of the realtime bar.
• A gray square on top of the elapsed realtime bars where one or more alerts were generated. The square's tooltip displays the alert log for that bar.
• A yellow dot corresponding to the average price of all realtime bar updates, which is calculated using a varip array in "Part 2" of the script.
• Various key values in the Data Window for each parts of the script.
Note that the directional volume information calculated in Part 3 of the script is not plotted on the chart—only in the Data Window.
Using the script
You can try running the script on an open market with a 30sec timeframe. Because the default settings reset the duration on new realtime bars and require a 20 second delay, a reasonable amount of alerts will trigger.
Creating an alert on the script
You can create a script alert on the script. Keep in mind that when you create an alert from this script, the duration calculated by the instance of the script running the alert will not necessarily match that of the instance running on your chart, as both started their calculations at different times. Note that we use alert.freq_all in our alert() calls, so that alerts will trigger on all instances where the associated condition is met. If your alert is being paused because it reaches the maximum of 15 triggers in 3 minutes, you can configure the script's inputs so that up/down alerts must alternate. Also keep in mind that alerts run a distinct instance of your script on different servers, so discrepancies between the behavior of scripts running on charts and alerts can occur, especially if they trigger very often.
Challenges
Events detected in realtime using variables declared with varip can be transient and not leave visible traces at the close of the realtime bar, as is the case with our script, which can trigger multiple alerts during the same realtime bar, when the script's inputs allow for this. In such cases, elapsed realtime bars will be of no use in detecting past realtime bar events unless dedicated code is used to save traces of events, as we do with our alert log in this script, which we display as a tooltip on elapsed realtime bars.
█ NOTES
Realtime updates
We have no control over when realtime updates occur. A realtime bar can open, and then no realtime updates can occur until the open of the next realtime bar. The time between updates can vary considerably.
Past values
There is no mechanism to refer to past values of a varip variable across realtime executions in the same bar. Using the history-referencing operator will, as usual, return the variable's committed value on previous bars. If you want to preserve past values of a varip variable, they must be saved in other variables or in an array .
Resetting variables
Because varip variables not only preserve their values across realtime updates, but also across bars, you will typically need to plan conditions that will at some point reset their values to a known state. Testing on barstate.isnew , as we do, is a good way to achieve that.
Repainting
The fact that a script uses varip does not make it necessarily repainting. A script could conceivably use varip to calculate values saved when the realtime bar closes, and then use confirmed values of those calculations from the previous bar to trigger alerts or display plots, avoiding repaint.
timenow resolution
Although the variable is expressed in milliseconds it has an actual resolution of seconds, so it only increments in multiples of 1000 milliseconds.
Warn script users
When using varip to implement logic that cannot be replicated on historical bars, it's really important to explain this to traders in published script descriptions, even if you publish open-source. Remember that most TradingViewers do not know Pine.
New Pine features used in this script
This script uses three new Pine features:
• varip
• The `tooltip` parameter in input() .
• The new += assignment operator. See these also: -= , *= , /= and %= .
Example scripts
These are other scripts by PineCoders that use varip :
• Tick Delta Volume , by RicadoSantos .
• Tick Chart and Volume Info from Lower Time Frames by LonesomeTheBlue .
Thanks
Thanks to the PineCoders who helped improve this publication—especially to bmistiaen .
Look first. Then leap.

Ninja Scalping: IndicatorThis is a strategy version for scalping signals. The objective of these signals is to accumulate more BTC through buying and selling of Altcoins. Thus, it is expected that these signals yield BTC gains when the crypto market has bullish days, as when BTC bleeds, other coins bleed even more. Let us get ready for the altseason!!
As mentioned above, the goal is to increase BTC's holdings through buying and selling of Alts. However, different Alts react differently against BTC. Therefore, there is no set of parameters that works for all Alts. The good news is that I tried my best to limit the number of parameters required to be tuned for a specific Alt to two. Also, this strategy helps back-test and tune the parameters for the desired Altcoin, with no guarantee that what happened in the past would happen in the future. This strategy is generally conservative, and it does not enter many trades. However, you can be more aggressive by changing the multiplier value: the smaller the value, the more aggressive the strategies. One can be more aggressive when the market is super bullish. Actually, you can test this by playing with the dates for the back-testing to have an idea of what would be suitable parameters when BTC is strong or weak. For the image attached, the strategy is back-tested from Jan 1, 2021, to March 18, 2021, assuming an initial capital of 1 BTC.
For the time span parameter, typical values are 5, 10, 14, 21, 34, 50, and 100. For the multiplier, typical values range between 0.01 and 2.
Use it at your own risk. Feedbacks are more than welcome. Happy trading!

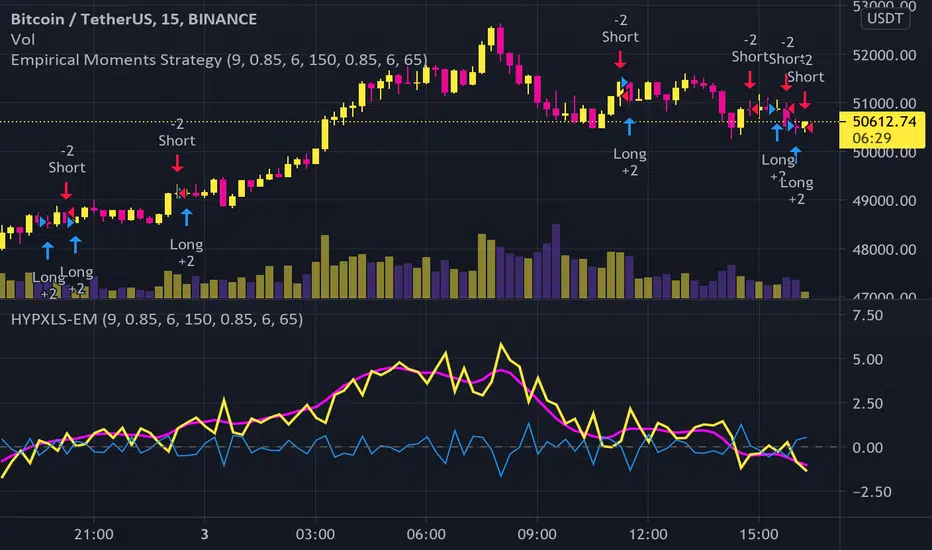
Empirical MomentsBINANCE:BTCUSDT I thought I’d make an indicator for the “fast trader”. This indicator compares the changing high prices with the close prices and in doing so, detects positive “anomalies” (the outlier drift). It gets more complicated than that; the practical indicator is the “empirically weighted drift”, which is a weighted average of the former with its derivatives up to the third order I.e. the “outlier yank”. The empirically weighted drift crossing above and below zero with long and short actions, respectively is used as the strategy. With this strategy, current backtesting for the 15 minute BTCUSDT on the Binance market yields a Sharpe ratio of 1.47 and profit factor of 1.12. Publishing the strategy as well.
Tango Moving Average Leverage StrategyThis script should be used on a daily BTC chart.
This script uses a combination of 21 week moving average and BTC halving dates to determine the bull and bear markets which in tern changes the trading strategy.
The strategy uses the 21 week moving average.
The Green "Buy" symbol, signals when a dip in price has occurred and could possibly be a good location to buy but this signal has only been tested on a small historic data set so should be used with caution.
The red "Sell" symbol, signals a possible decline in price may occur, but again this script have only been tested on a small data set because BTC is relatively new so should be used with caution.
Bear in mind when using this signal: signals appear at the daily close

EMA BANDS//Trades have been checked periodically on daily charts with normal, basically, you'll set in trades for weeks, months, and years in some cases depending on the time frame and strategy you use, DO NOT TRADE ON MARGIN INTEREST WILL RUIN YOU.
//You can use the strategies on lower timeframes, however, you'll need to be able to execute trades during all market hours if you choose anything less than a daily.
//You MUST stay in your trade until the very end. that means even if you open the trade and you're super in red DON'T DUMP.
//Set stop losses to no more than 50% of your entry price. Less is better but understand that you may be stomped out of a trade that could reverse after a 40-49% pullback.
//I suggest you pull initial capital out after you 2x to lock in your profit.
//You must also have the ability to sell/buy after market hours, you'll make your trades generally one-two hours post-market in most cases.
//The green line gives a simple average of the last 1618 candles. The further price action is from the mean, the more the price will be pulled back. (Ideally)
//Strategy One (Safe/Slow)
//Buy when the closing price is less than the lower bounds of all bands. This does not include the green "Mean" line
//Sell when the closing price is greater than the upper bounds of all bands. Again, this does not include the green "Mean" line
//Strategy Two (Neutral)
//Buy when the closing price is less than the bounds of 3-4 out of the 4 bands.
//Sell when the closing price is greater than the bounds of 3-4 out of the 4 bands.
//This means that you execute trades even if the closing price is still within one band.
//You'll still execute orders even if the closing price is outside of all bands
//Strategy Three (Least Safe/Fast)
//Buy when the closing price is less than the bounds of 2-4 out of the 4 bands.
//Sell when the closing price is greater than the bounds of 2-4 out of the 4 bands.
//This means that you execute trades even if the closing price is still within two bands.
//You'll still execute orders even if the closing price is outside of all bands
//You'll still execute orders even if the closing price is outside of 3 of 4 bands

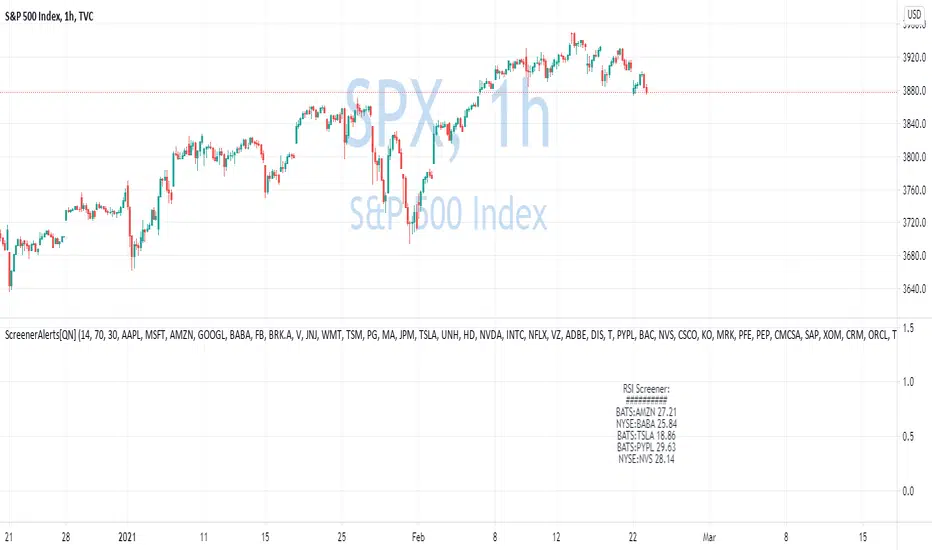
Custom Screener with Alerts V2 [QuantNomad]TradingView just recently announced the alert() function that allows you to create dynamic alerts from both strategies and studies.
So I decided to update custom screener I published before. It was based on alerts from orders in strategies, that was the only way to create dynamic alerts in PineScript at that point.
With the alert() function code become cleaner and more readable.
It works for up to 40 symbols at the same time.
You can create an alert from it easily by selecting screener name from the list and then selecting "Any alert() function call".
No additional configuration is required, message and alert on close I set up in the code.
I created as an example a screener that tracks both overbought (RSI > 70) and oversold stocks (RSI < 30).
To create your own screener you have to change only screenerFunc().
By design it should output 2 values:
cond - True/False Boolean variable. Should this instrument be displayed in the screener?
value - Additional numeric value you can display in your screener. I display RSI level for selected stocks for example.
Link to the old screener:
Disclaimer
Please remember that past performance may not be indicative of future results.
Due to various factors, including changing market conditions, the strategy may no longer perform as good as in historical backtesting.
This post and the script don’t provide any financial advice.
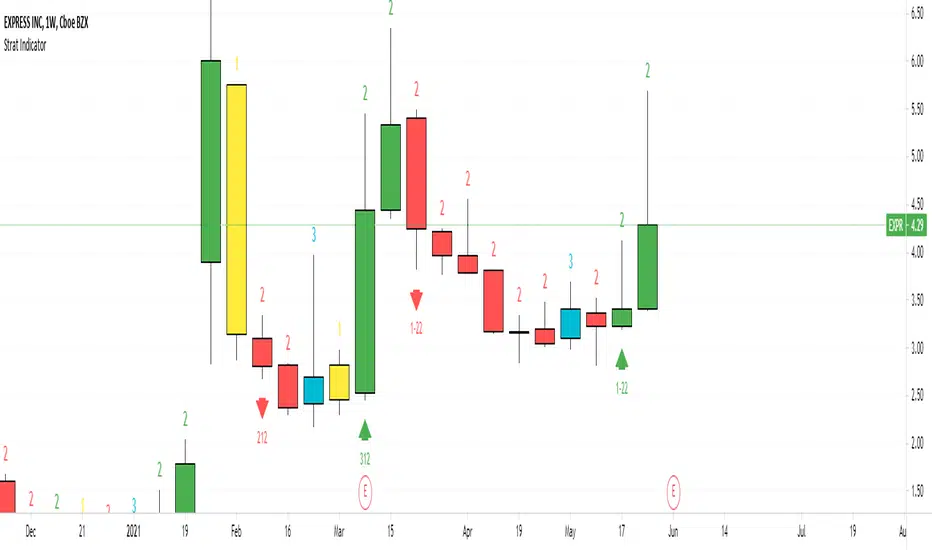
Strat IndicatorThe script implements the Strat method of trading.
Script will label the candles as 1,2,3 where 1 = inside candle. 2 = trend candle, 3 = outside candle.
The bullish , bearish and continuation patterns are labelled with the relevant strat combination
and up, down rrows.
Some setups are
2-1-2 Bearish Reversal = 2 green candle, 1 inside candle, 2 red candle
This indicator can be used in all timeframes.
It can be used on Split screen
for Intraday 1 hour & 15 min
For Swing 1 day & 1 hour
For Long term 1 week & 1 day
For 6 continuous 2 candles, the script will mark the candle as PMG "Pivot Machine Gun" this a big reversal.
Ravih Pro Trend BreakoutThis is a Trend Breakout Strategy on “DAILY Time-frame”
This Strategy is designed keeping in mind with Medium to Long Term traders. The strategy works only on Daily Time-frame and on Closing Price.
The concept here is to identify assets with potential change in trend. Primary focus is to position for the big move. There are times... trying to catch every trend, many of which can be unprofitable especially in side-way market. However, the primary purpose of this strategy is to catch all the major trend movements, which are much more profitable than minor market losses in all the side-way market.
I’ve simplified it to make it user-friendly.
How to use?
Set it to Daily Time-frame.
Buy, Take Profit 1,2,3 and Exit signals are included on chart based on the current Trend direction. The system shows an Exit signal if the system’s exit conditions are met. It works only on Daily Time-frame and on Closing Price.
Dark Blue Up Triangle denotes Buy at the Closing Price. Entry Price is Closing Price or with + or – 2% tolerance of the Closing Price for the following market day.
Purple Down Triangle denotes Exit to close any remaining position to free up capital.
Little Green Up Triangles denote the Bulls are in Control and Overpowering the Bears and represents minor Buying opportunities with strong probability of continuing up-moves.
Setting Up Alerts
The user has the option to Setup Alerts for all chart signals that is…
For Buy, for Exit, for Take Profit 1 set at 24%, for Take Profit 2 set at 48% and for Take Profit 3 set at 72%
The user also has the option to adjust the Take Profit as per their desire. However, the predetermined Take Profit set for this strategy does work reasonably well.
Remember...
This strategy is only built for stocks. It is Not for Indices neither for any other financial instruments.
No SHORT signals in this strategy.

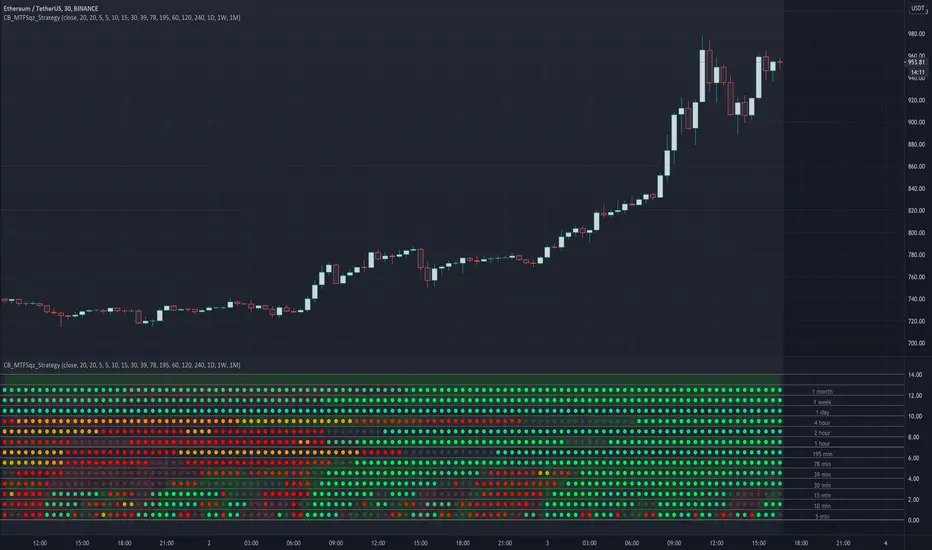
CryptoBreakers MTF Sqz StrategyThis is a Multi Time Frame squeeze strategy that has been consistently catching large BTC and ETH moves.
It's building up on the basic squeeze play of both the upper and lower Bollinger Bands going inside the Keltner Channel
and in one indicator quickly seeing when both Bollinger Bands start to come out of the Keltner channel and positioning us
for the large move that is about to take place.
Before I explain the rules for the winning strategy, let's cover the basics on the indicator.
1. When both the upper and lower Bollinger Bands go inside the Keltner Channel, a compression is in place, and the squeeze is on. This is reflected on the indicator as colored dots.
2. The indicator covers 5min, 10min, 15min, 30min, 39min, 78min, 195min, 1hr, 2hr, 4hr, 1 day, 1 week, and 1 month timeframes for squeezes.
Your chart needs to be set to the lowest time frame resolution of 5min in order for the indicator to show squeezes in all higher timeframe resolutions.
So whatever your chart resolution is, the indicator will show the squeezes in that timeframe and above correctly.
3. ORANGE dots indicate high level of compression. RED dots indicate medium level of compression. BLACK dots indicate low level of compression and the GREEN dots indicate no compression.
4. Generally, higher the level of compression and the longer duration of the squeeze, the more explosive the move expected. With this one indicator I was able to consistently catch 500 plus
point moves in BTC and 30-50 point moves in ETH.
Let's review the rules of the strategy:
1. For the ideal set up, we look for two lower timeframe resolutions (preferably 30 and 39 minutes OR 39 minutes and 78 minutes) to be in squeeze for at least 6 dots and at the sametime we
need to see one or two higher timeframe resolutions in squeeze (195 minutes and 1 day OR 1 day and 1 week resolutions)
2. Determine the direction of the trend in the higher time frames (bullish and bearish). We look for stacked up or down EMAs of 8, 21, 34, 55 and 84 on a daily and/or weekly chart.
3. For entry, wait for the lower timeframe squeeze to fire meaning look for the first green dot after the black, red, or orange dots (minimum six in total).
For example the 30 min row shows the first green dot after the sequence of squeeze dots and the direction of the price movement (up or down) at that green dot bar aligns with the direction of the price movement in the higher timeframe chart.
4. Once the lower timeframe squeezes fire, we follow the move to continuation of the firing of the higher timeframe squeezes.
5. Our exit will be at the price point of 6-9 green dots after the higher timeframe squeeze fired in the same direction as the lower timeframe.
I created this to make it easier to see the set up on any stock and crypto chart. It has been working consistently on BTC and ETH price action. I have not seen anything on TV that cover multi time frame squeeze play in a very simple and clean way.
This makes it very easy to see the set up with one indicator. I'm using this with my trading group.
If you would like to get access, please feel free to DM me at @CryptoBreakers
Jackrabbit.SR-ATR-DCAThis is a standalone version of the Support and Resistance/Average True Range paradigm for the Jackrabbit suite and modulus framework. This module does not have a signal line and does not support integration with other modules.
Support and Resistance and ATR are preset and tuned to very specific settings for maximum profitability.
The blue line is the current average price of the asset.
The red line is the deviation boundary. Price action must be below this line for buys to be signaled.
The green line is the take profit. Price action must be above this line for a sell signal to be generated.
Here is a list of the settings:
Buy method: DCA or Strategy. DCA allows the module to decide buys based upon the methodology (step, price). Strategy added to the average on the basis of a buy signal from the strategy, but only when it is below the deviation and is the most organic of dollar cost averaging.
Sell Method. Take profit or Steategy. Take Profit sells the asset as soon as the price action crosses above the take profit line. Strategy sells on the basis of a sell signal, but only if it is above the take profit. Selling never occurs at a loss, with the only exception being the exit point.
Methodolgy: Step or Price. Stepping allows a fixed and uniform averaging ant percise intervals of deviation. Price is a very aggressive approach that will drive the average down on the basis of the difference between the average and the current price action. The price methodology is VERY high risk.
Take Profit, which describes the average profit percent of the combined positions.
Deviation, which describes the percent boundary for which price action must drop before additional assets are purchased.
Sideways Breaker: This algorithm breaks the sideways rut by forcing a purchase after X days, minimum 1 day.
Exit Position: Internal stop loss expressed in the number of buys.
It is important that when you establish your sell signal, ALL positions must be sold to ensure the average profit. If required, use a CLOSE ALL message provided by your platform. Also, any platform specific DCA or Safety Orders will cause losses as this script can not track their value. It is recommended that these features not be used.
This script is by invitation only. To learn more about accessing this script, please see my signature or send me a PM. Thank you.

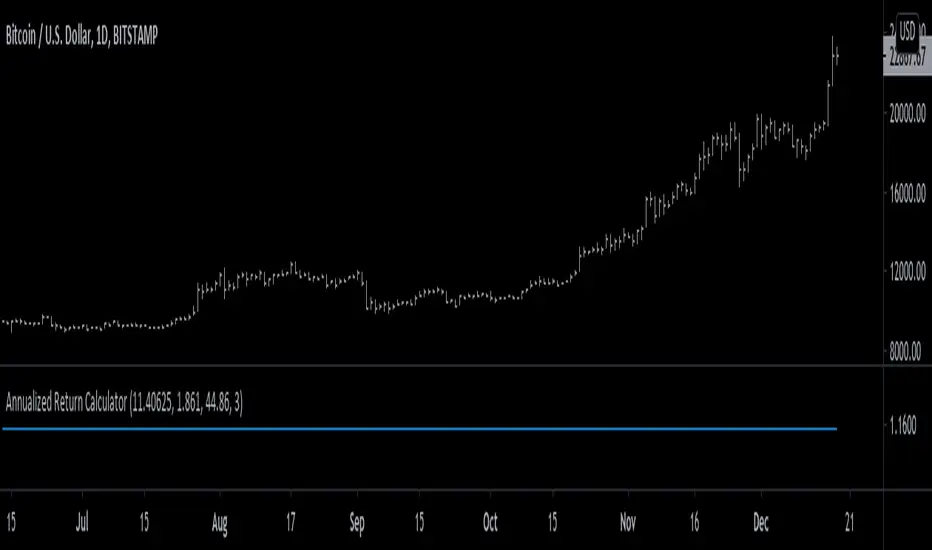
Strategy's Annual Return [racer8]I was trying to find the annual return for a particular strategy script based on profit factor, annual trade frequency, and win rate.
So on paper, I created some equations to help me solve this...and eventually, I created this indicator!
This indicator will help you find the annual return for any strategy. All you need to input is profit factor, number of trades per year, and win rate...oh and percentage of equity to risk in the trades.
By the way, if the output is 1.15, that means 15% annual return.
Keep in mind that this is a mere approximation...and the actual return is likely lower than this value.
Also if your margin trading, set order size to 100% of equity in the strategy's parameters.
Hopes this helps. Good luck and enjoy ;)
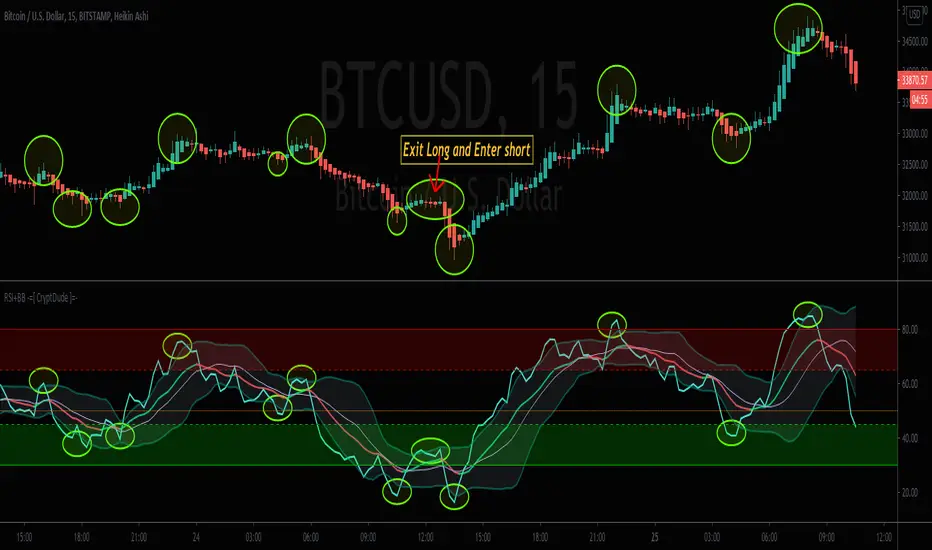
RSI+BB -=[ CryptDude ]=-RSI+BB
RSI + Bollingerbands
Credits
First of all I'd like to credit my trading pal, Vitaly905 who is a fellow Whale Crew associate for discovering this approach via another FOREX YouTuber, and turned me onto the general strategy. I created my own style template of the combo with the transitional trend color changes. My scripting skill were a little rusty at the time, so spoke with another trading friend in Whale Crew, MartyMcFly, and he put the script together for it and I generally went through, changed some nomenclature and touched some of the code as well. My other Whale Crew partner, Sydnet helped configure the alerts.
We're proud of it and hope you enjoy it. Just wanted to give credit to the collaborative effort.
The Strategy
The key to this strategy is to look for when the RSI gets very close or crosses above or below the Bollinger bands as indications of potential pivot ranges. You can also set Alerts for when the Bollinger Bands are crossed
Things to be aware of
(1) During the RSI peaks, be aware that most of them have a double hump or double tops on the RSI when they are close to or have breached the BB. Sot that means there's likely going to be an interval of time after the firs peak or dip before it finally pivots. This takes a little adjustment, but after a while you start to recognize the pattern. They almost look like an "M" on the tops and a "W" shape on the bottom; tilted in one direction or the other.
(2) Also during those peaks or dips, the RSI may move some, but price can move quite a bit more. So it's up to you, the trader, to trust your own analysis, by checking other known confluent momentum indications as to WHEN you should execute your entry, accordingly.
(3) There is a lot of consistency in this strategy after you spend more time getting intimate with it.
(4) I may ad convergence indication to it later, but It may pollute the chart more than being useful, as I don't have issue finding convergence.
(5) Set your own rules as to what constitutes an entry confirmation, which can be a confluence of other momentum indicators along with the RSI+BB.
Below is an example of the strategy with the price action
Happy trading!!
Your trading pal,
~ CryptDude
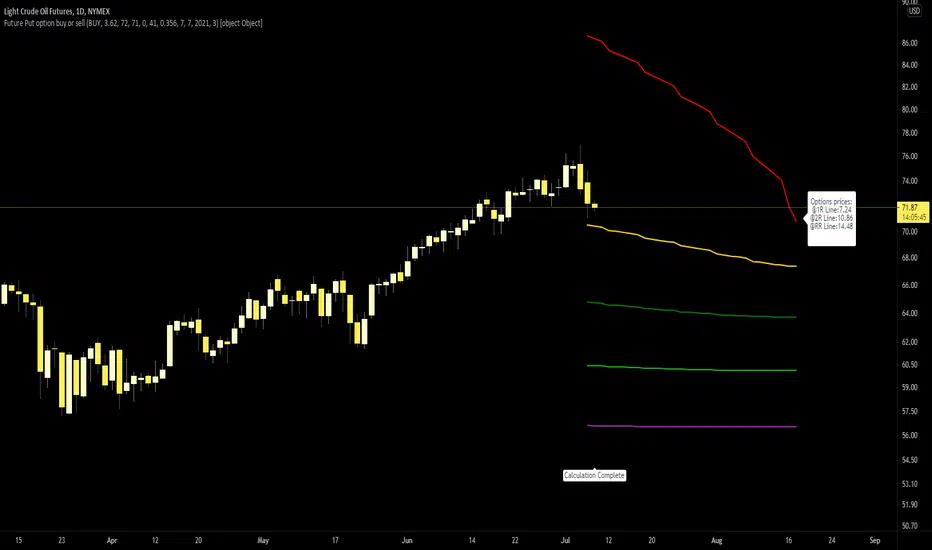
Future Put option buy or sell indicatorFuture Put option indicator developed by Chobotaru Brothers.
You need to have basic knowledge in option trading to use this indicator!
The indicator shows P&L lines of the options strategy. Use only for futures since the mathematical model of options for Future instruments is different from stocks. Plus, the days' representation in futures is also different from stocks (stocks have fewer days than futures ).
***Each strategy in options is based on different mathematical equations, use this indicator only for the strategy in the headline.***
What does the indicator do?
The indicator is based on the Black-Scholes model, which uses partial differential equations to determine the option pricing. Due to options non-linear behavior, it is hard to visualize the option price. The indicator calculates the solutions of the Black-Scholes equation and plots them on the chart so traders can view how the option pricing will behave.
How the indicator does it?
The indicator uses five values (four dominants and one less dominant) to solve the Black-Scholes equation. The values are stock price, the strike price of the option, time to expiration, risk-free interest rate, and implied volatility .
How the indicator help the users?
-View the risks and rewards so you can know the profit targets in advance which means you can compare different options in different strikes.
-View the volatility change impact so you can know the risk and the P&L changes in case of a change in the volatility over the life of the option before you enter the trade.
-View the passage of time impact so you can know where and when you could realize a profit.
-Multi-timeframes so you can stay on the same chart (Daily and below).
All these features are to help the user improve his analysis while trading options.
How to use it?
The user needs to obtain from the “option chain” the following inputs:
-Buy or sell (the strategy)
-The option price bought: at what price did you bought/sold one option.
-Instrument price when bought: the stock price when you bought/sold the option.
-Strike price: the strike price of the option.
-Interest rate: find the risk-free interest rate from the U.S. DEPARTMENT OF THE TREASURY. Example: for 2% interest rate, input: 0.02.
-Days to expire: how many days until the option expires.
-Volatility: the implied volatility of the option bought/sold. Example: for 45% implied volatility , input: 0.45.
-Day of entry: A calendar day of the month that the option bought/sold.
-Month of entry: Calendar month the option bought/sold.
-Year of entry: Calendar year the option bought/sold.
-Risk to reward: Profit/loss line defined by the user. Minimum input (-0.95) ; maximum input (3).
Example: If an option was bought, -0.95 means, 95% of the option value is lost (unrealized). If an option was bought, 3 means, the risk to reward is 3.
After entering all the inputs, press Ok and you should see “Calculation Complete” on the chart.
The user should not change the entry date and days to expire inputs as time passes after he entered the trade.
How to access the indicator?
Use the link below to obtain access to the indicator
Future Call option buy or sell indicatorFuture Call option indicator developed by Chobotaru Brothers.
You need to have basic knowledge in option trading to use this indicator!
The indicator shows P&L lines of the options strategy. Use only for futures since the mathematical model of options for Future instruments is different from stocks. Plus, the days' representation in futures is also different from stocks (stocks have fewer days than futures ).
***Each strategy in options is based on different mathematical equations, use this indicator only for the strategy in the headline.***
What does the indicator do?
The indicator is based on the Black-Scholes model, which uses partial differential equations to determine the option pricing. Due to options non-linear behavior, it is hard to visualize the option price. The indicator calculates the solutions of the Black-Scholes equation and plots them on the chart so traders can view how the option pricing will behave.
How the indicator does it?
The indicator uses five values (four dominants and one less dominant) to solve the Black-Scholes equation. The values are stock price, the strike price of the option, time to expiration, risk-free interest rate, and implied volatility .
How the indicator help the users?
-View the risks and rewards so you can know the profit targets in advance which means you can compare different options in different strikes.
-View the volatility change impact so you can know the risk and the P&L changes in case of a change in the volatility over the life of the option before you enter the trade.
-View the passage of time impact so you can know where and when you could realize a profit.
-Multi-timeframes so you can stay on the same chart (Daily and below).
All these features are to help the user improve his analysis while trading options.
How to use it?
The user needs to obtain from the “option chain” the following inputs:
-Buy or sell (the strategy)
-The option price bought: at what price did you bought/sold one option.
-Instrument price when bought: the stock price when you bought/sold the option.
-Strike price: the strike price of the option.
-Interest rate: find the risk-free interest rate from the U.S. DEPARTMENT OF THE TREASURY. Example: for 2% interest rate, input: 0.02.
-Days to expire: how many days until the option expires.
-Volatility: the implied volatility of the option bought/sold. Example: for 45% implied volatility , input: 0.45.
-Day of entry: A calendar day of the month that the option bought/sold.
-Month of entry: Calendar month the option bought/sold.
-Year of entry: Calendar year the option bought/sold.
-Risk to reward: Profit/loss line defined by the user. Minimum input (-0.95) ; maximum input (3).
Example: If an option was bought, -0.95 means, 95% of the option value is lost (unrealized). If an option was bought, 3 means, the risk to reward is 3.
After entering all the inputs, press Ok and you should see “Calculation Complete” on the chart.
The user should not change the entry date and days to expire inputs as time passes after he entered the trade.
How to access the indicator?
Use the link below to obtain access to the indicator

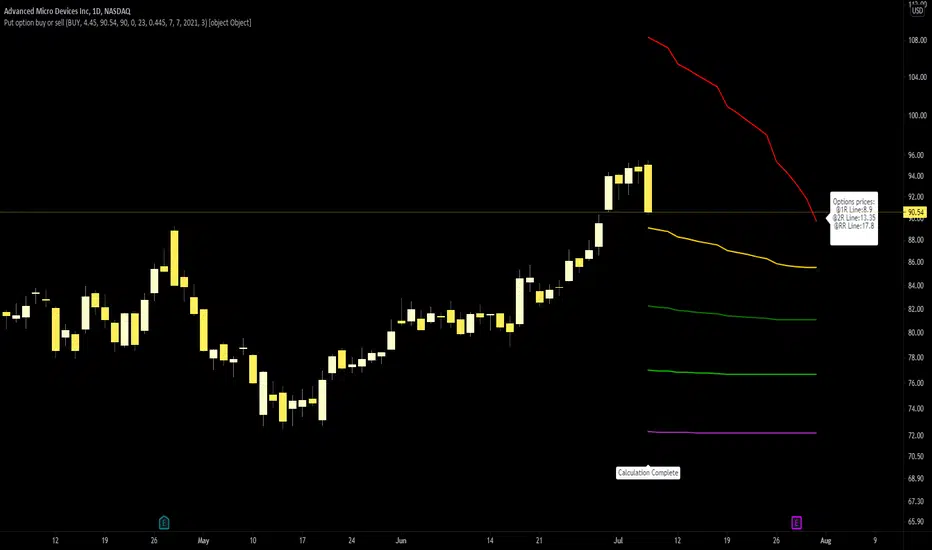
Put option buy or sell indicatorPut option indicator developed by Chobotaru Brothers.
You need to have basic knowledge in option trading to use this indicator!
The indicator shows P&L lines of the options strategy. Use only for stocks since the mathematical model of options for Future instruments is different from stocks. Plus, the days' representation in futures is also different from stocks (stocks have fewer days than futures ).
***Each strategy in options is based on different mathematical equations, use this indicator only for the strategy in the headline.***
What does the indicator do?
The indicator is based on the Black-Scholes model, which uses partial differential equations to determine the option pricing. Due to options non-linear behavior, it is hard to visualize the option price. The indicator calculates the solutions of the Black-Scholes equation and plots them on the chart so traders can view how the option pricing will behave.
How the indicator does it?
The indicator uses five values (four dominants and one less dominant) to solve the Black-Scholes equation. The values are stock price, the strike price of the option, time to expiration, risk-free interest rate, and implied volatility .
How the indicator help the users?
-View the risks and rewards so you can know the profit targets in advance which means you can compare different options in different strikes.
-View the volatility change impact so you can know the risk and the P&L changes in case of a change in the volatility over the life of the option before you enter the trade.
-View the passage of time impact so you can know where and when you could realize a profit.
-Multi-timeframes so you can stay on the same chart (Daily and below).
All these features are to help the user improve his analysis while trading options.
How to use it?
The user needs to obtain from the “option chain” the following inputs:
-Buy or sell (the strategy)
-The option price bought: at what price did you bought/sold one option.
-Instrument price when bought: the stock price when you bought/sold the option.
-Strike price: the strike price of the option.
-Interest rate: find the risk-free interest rate from the U.S. DEPARTMENT OF THE TREASURY. Example: for 2% interest rate, input: 0.02.
-Days to expire: how many days until the option expires.
-Volatility: the implied volatility of the option bought/sold. Example: for 45% implied volatility , input: 0.45.
-Day of entry: A calendar day of the month that the option bought/sold.
-Month of entry: Calendar month the option bought/sold.
-Year of entry: Calendar year the option bought/sold.
-Risk to reward: Profit/loss line defined by the user. Minimum input (-0.95) ; maximum input (3).
Example: If an option was bought, -0.95 means, 95% of the option value is lost (unrealized). If an option was bought, 3 means, the risk to reward is 3.
After entering all the inputs, press Ok and you should see “Calculation Complete” on the chart.
The user should not change the entry date and days to expire inputs as time passes after he entered the trade.
How to access the indicator?
Use the link below to obtain access to the indicator
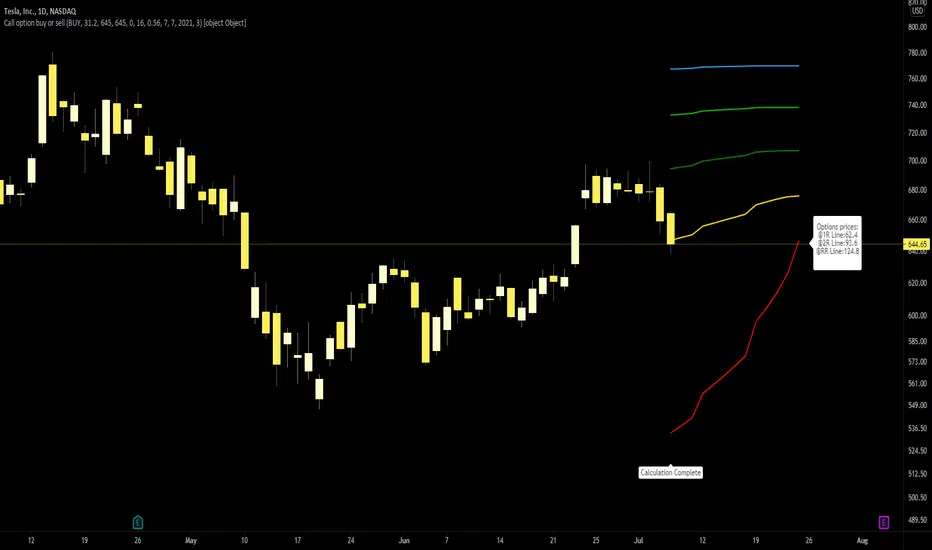
Call option buy or sell indicatorCall option indicator developed by Chobotaru Brothers.
You need to have basic knowledge in option trading to use this indicator!
The indicator shows P&L lines of the options strategy. Use only for stocks since the mathematical model of options for Future instruments is different from stocks. Plus, the days' representation in futures is also different from stocks (stocks have fewer days than futures ).
***Each strategy in options is based on different mathematical equations, use this indicator only for the strategy in the headline.***
What does the indicator do?
The indicator is based on the Black-Scholes model, which uses partial differential equations to determine the option pricing. Due to options non-linear behavior, it is hard to visualize the option price. The indicator calculates the solutions of the Black-Scholes equation and plots them on the chart so traders can view how the option pricing will behave.
How the indicator does it?
The indicator uses five values (four dominants and one less dominant) to solve the Black-Scholes equation. The values are stock price, the strike price of the option, time to expiration, risk-free interest rate, and implied volatility .
How the indicator help the users?
-View the risks and rewards so you can know the profit targets in advance which means you can compare different options in different strikes.
-View the volatility change impact so you can know the risk and the P&L changes in case of a change in the volatility over the life of the option before you enter the trade.
-View the passage of time impact so you can know where and when you could realize a profit.
-Multi-timeframes so you can stay on the same chart (Daily and below).
All these features are to help the user improve his analysis while trading options.
How to use it?
The user needs to obtain from the “option chain” the following inputs:
-Buy or sell (the strategy)
-The option price bought: at what price did you bought/sold one option.
-Instrument price when bought: the stock price when you bought/sold the option.
-Strike price: the strike price of the option.
-Interest rate: find the risk-free interest rate from the U.S. DEPARTMENT OF THE TREASURY. Example: for 2% interest rate, input: 0.02.
-Days to expire: how many days until the option expires.
-Volatility: the implied volatility of the option bought/sold. Example: for 45% implied volatility , input: 0.45.
-Day of entry: A calendar day of the month that the option bought/sold.
-Month of entry: Calendar month the option bought/sold.
-Year of entry: Calendar year the option bought/sold.
-Risk to reward: Profit/loss line defined by the user. Minimum input (-0.95) ; maximum input (3).
Example: If an option was bought, -0.95 means, 95% of the option value is lost (unrealized). If an option was bought, 3 means, the risk to reward is 3.
After entering all the inputs, press Ok and you should see “Calculation Complete” on the chart.
The user should not change the entry date and days to expire inputs as time passes after he entered the trade.
How to access the indicator?
Use the link below to obtain access to the indicator
Moving Average Ribbon Master StrategyThe following features available in this strategy are listed below. To access, please visit the website in the signature area of this posting.
INTRODUCTION
Robust, fast, trading system
Multiple time frame (MTF) aspects built in everywhere into the strategy
Combines swing, scalp, greedy, volatile trading mechanisms
Works on intraday day time frames as well as Daily and Weekly
Trade sizing, targets, and stops are shown as new trades form and existing trades develop
Alerts warn the trader on all aspects of the trade evolution
Alerts are ready to be used for complete lifecycle automated trading
EMA TRADING
Combining EMAs on a higher time frame than the chart time frame is key
Trade conditions are met on a lower time frame that agree with the EMA ribbon direction
WHY DOES IT WORK?
With the right EMA settings, it is "hard" to generate trades.
The trade direction can easily shift
Successful trade entry triggers require a strong trend
While the EMA trend is positive, longs are taken on pullbacks, opposite for shorts
A basic learning algorithm is used to create a stop behind the trades
Learns over time the best stop offset from the price based on volatility
SWINGS AND SCALPS
Swings and scalps are treated differently.
Swings are the very first trade taken upon a directional shift. This is similar to the DIVINE series trading strategies
Swings are held until stopped out, Scalps always have a target based on the current volatility of the ticker and multiplier
Both swings and scalps start out in the "building" or "forming" phase.
A building phase is triggered when all criteria are met to form a long or short
Both trade types are executed as a market long or short when the ATR execution sensitivity reverses
The current ATR direction can be seen by the colored bars.
TRADING STYLES
Conservative
Aggressive
Greedy
Volatile
TRADE SIZING
Contract/Unit
VIX Multiplier
Percent of Equity
Percent Risk
TRADE INFORMATION
Historical trades show the price target of a scalp and the number of ticks of profit in parenthesis
New trades show all of the extra information surrounding the trade. This can be turned on to show the same information for past trades, but is left off to reduce clutter
Go over trade information categories one-by-one
Recent historical trades have a tooltip loaded to hover over and see the hidden information
Scalp trade is filled the numbered scalp icon shows as a (N)
SESSION WINDOW
Longs and shorts can only receive an execution signal when the ticker is within one of three session options provided
ADJUSTMENT
Last 3 sizing types show the quantity required to enter the trade to meet the parameters
Percent risk automatically adjusts the quantity to meet the risk criteria given the account equity, per trade
The account currency can be changed with will update the quantities automatically
Tick Unit and Value can also be changed if they are not accurate
ALERTS
Alerts for entire trade lifecycle
Full automated trading ready

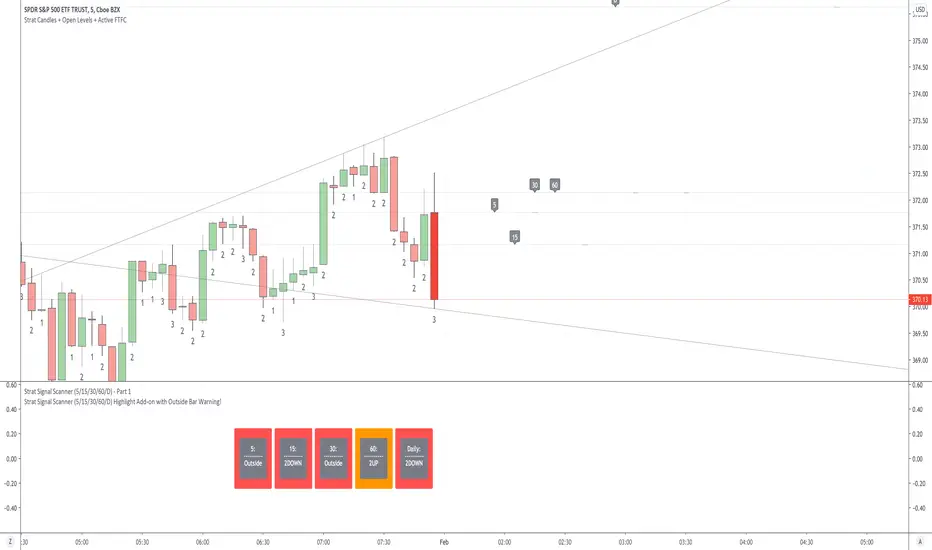
Strat Signal Scanner (5/15/30/60/D) Highlight Add-onStrat Signal Scanner (5/15/30/60/D) - Part 1 Highlight Add-on with Outside Bar Warning Indicator Info
Must be used with the “Strat Signal Scanner (5/15/30/60/D) - Part 1” Indicator only.
Two functions:
1. Add’s the current Candle color to each Timeframe box (Green or Red).
2. Possible Outside Bar Warning when a 2 Bar appears to be failing (Amber Box).
Amber Box - Outside Bar Warning Trigger Conditions:
- a 2UP Red Bar falls >60%* of previous candles range (High to Low).
- a 2DOWN Green Bar rises >60%* of previous candles range (Low to High).
*Customise previous candles range % within Indicator settings.
How to use:
- Add Indicator to chart
- click More (3 dots next to indicator settings)
- click Move - Exisiting pane above.
- Move the Highlight Indicator to line up with the Part 1 Indicator and make sure its in the background to prevent blocking the Part 1 indicator boxes.
- Open Highlight Indicator settings to adjust % if required.
Strat Signal Scanner (60/D/W/M/Q) Highlight Add-onStrat Signal Scanner (60/D/W/M/Q) - Part 1 Highlight Add-on with Outside Bar Warning Indicator Info
Must be used with the “Strat Signal Scanner (60/D/W/M/Q) - Part 1” Indicator only.
Two functions:
1. Add’s the current Candle color to each Timeframe box (Green or Red).
2. Possible Outside Bar Warning when a 2 Bar appears to be failing (Amber Box).
Amber Box - Outside Bar Warning Trigger Conditions:
a 2UP Red Bar falls >60%* of previous candles range (High to Low).
a 2DOWN Green Bar rises >60%* of previous candles range (Low to High).
*Customise previous candles range % within Indicator settings.
How to use:
- Add Indicator to chart
- click More (3 dots next to indicator settings)
- click Move - Exisiting pane above.
- Move the Highlight Indicator to line up with the Part 1 Indicator and make sure its in the background to prevent blocking the Part 1 indicator boxes.
- Open Highlight Indicator settings to adjust % if required.
