COSTAR [SS]This idea came to me after I wrote the post about Co-Integration and pair trading. I wondered if you could use pair trading principles as a way to determine overbought and oversold conditions in a more neutral way than RSI or Stochastics.
The results were promising and this indicator resulted :-)!
About:
COSTAR provides another, more neutral way to determine whether an equity is overbought or oversold.
Instead of relying on the traditional oscillator based ways, such as using RSI, Stochastics and MFI, which can be somewhat biased and narrow sided, COSTAR attempts to take a neutral, unbiased approached to determine overbought and oversold conditions. It does this through using a co-integrated partner, or "pair" that is closely linked to the underlying equity and succeeds on both having a high correlation and a high t-statistic on the ADF test. It then references this underlying, co-integrated partner as the "benchmark" for the co-integration relationship.
How this succeeds as being "unbiased" and "neutral" is because it is responsive to underlying drivers. If there is a market catalyst or just general bullish or bearish momentum in the market, the indicator will be referencing the integrated relationship between the two pairs and referencing that as a baseline. If there is a sustained rally on the integrated partner of the underlying ticker that is holding, but the other ticker is lagging, it will indicate that the other ticker is likely to be under-valued and thus "oversold" because it is underperforming its benchmark partner.
This is in contrast to traditional approaches to determining overbought and oversold conditions, which rely completely on a single ticker, with no external reference to other tickers and no control over whether the move could potentially be a fundamental move based on an industry or sector, or whether it is a fluke or a squeeze.
The control for this giving "false" signals comes from its extent of modelling and assessment of the degree of integration of the relationship. The parameters are set by default to assess over a 1 year period, both the correlation and the integration. Anything that passes this degree of integration is likely to have a solid, co-integrated state and not likely to be a "fluke". Thus, the reliability of the assessment is augmented by the degree of statistical significance found within the relationship. The indicator is not going to prompt you to rely on a relationship that is statistically weak, and will warn you of such.
The indicator will show you all the information you require regarding the relationship and whether it is reliable or not, so you do not need to worry!
How to Use
The first step to use COSTAR is identifying which ticker has a strong relationship with the current ticker. In the main chart, you will see that SPY is overlaid with VIX. There is a strong, negative correlation between the VIX and SPY. When VIX is entered as the paired ticker, the indicator returns the data as stationary, indicating a compatible match.
Now you have 3 ways of viewing this relationship, 2 of which are going to be directly applicable to trading.
You can view them as
Price to Price Ratio (Not very useful for trading, but if you are curious)
Z-Score: Helpful for trading
Co-integration: Helpful for trading
Here is an example of all three:
Example of Z-Score Chart:
Example of Price Ratio:
Example of Co-Integration Pair:
Using for Trading
As stated above, the two best ways to use this for trading is to either use the Z-Score Chart or the Co-Integrated Pair chart.
The Z-Score chart is based off of the price ratio data and provides an assessment of both the independent and dependent data.
The co-integration shows the dependent (the ticker you are trading) in yellow and the independent (the ticker you are referencing) in teal. When teal is above yellow, you will see it is green. This means, based on your benchmark pair, there is still more up room and the ticker you are trading is actually lagging behind.
When the yellow crosses up, it will turn red. This means that your ticker is out-performing the benchmark pair and you likely will see pullback and a "regression to the mean" through re-integration.
The indicator is capable of plotting out entries and exits, which are guided by the z-score:
How Effective is it?
I created a basic strategy in Pinescript, and the back-test results vary. Trading ES1! using NQ1! as the co-integrated pair, results were around 78% effective.
With VIX, results were around 50% effective, but with a net profit.
Generally, the efficacy surpassed that of both stochastics and RSI.
I will be releasing the strategy version of this in the coming days, still just cleaning up that code and making it more "public use" friendly.
Other Applications
If you are a pair trader, you can technically use this for pair trading as well. That's essentially all this is doing :-).
Tips
If you are trading a ticker such as MSFT, AMD, KO etc., it's best to try to find an ETF or index that has that particular ticker as a large holding and use that as your benchmark. You will see on the indicator whether there is a high correlation and whether the data is indeed stationary.
If the indicator returns "Non-stationary", you can attempt to extend your regression range from 252 to 500. If this fixes the issue, ensure that the correlation is still >= 0.5 or <= -0.5. If this does not work still, you will need to find another pair, as its likely the result of incompatibility and an insignificant relationship.
To help you identify tickers with strong relationships, consider using a correlation heatmap indicator. I have one available and I think there are a couple of other similar ish ones out there. You want to make sure the relationship is stable over time (a correlation of >= 0.50 or <= -0.5 over the past 252 to 500 days).
IMPORTANT: The long and short exits delete the signal after one is signaled. Therefore, when you look back in the chart you will notice there are no signals to exit long or short. That is because they signal as they happen. This is to keep the chart clean.
'Tis all my friends!
Hope you enjoy and let me know your questions and suggestions below!
Side note:
COSTAR stands for Co-integration Statistical Analysis and Regression. ;)
在脚本中搜索"the strat"

MACD_RSI_trend_followingINFO:
This indicator can be used to build-up a strategy for trading of assets which are currently in trending phase.
My preference is to use it on slowly moving assets like GOLD and on higher timeframes, but practice may show that we find more usefull cases.
This script uses two indicators - MACD and RSI, as the timeframe that those are extracted for is configurable (defaults with the Chart TF, but can be any other selected by the user).
The strategy has the following simple idea - buy if any if the conditions below is true:
The selected TF MACD line crosses above the signal line and the TF RSI is above the user selected trigger value
The selected TF MACD line is above the signal line and the TF RSI crosses above the user selected trigger value
Once we're in position we wait for the selected TF MACD line to cross below the signal line, and then we set a SL at the low of that bar
DETAILS and USAGE:
In the current implementation I find two possible use cases for the indicator:
as a stand-alone indicator on the chart which can also fire alerts that can help to determine if we want to manually enter/exit trades based on them
can be used to connect to the Signal input of the TTS (TempalteTradingStrategy) by jason5480 in order to backtest it, thus effectively turning it into a strategy (instructions below in TTS CONNECTIVITY section)
In the example below we see a position opened at the bar after the buy indicator from the script has been triggered, and then later after the SL indicator from the script has been triggered a SL has been set on the lower wick of the closing candle, and the position eventually got closed once the price hit that level. Note that most of the drawing on the example snapshot below are from the TTS indicator following the buy/sell/SL conditions themseves:
Trading period can be selected from the indicator itself to limit to more interesting periods.
Arrow indications are drawn on the chart to indicate the trading conditions met in the script - green arrow for a buy signal indication and orange for LTF crossunder to indicate setting of SL.
SETTINGS:
Leaving all of the settings as in vanilla use case, as both the MACD and RSI indicator's settings follow the default ones for the stand-alone indicators themselves.
The start-end date is a time filter that can be extermely usefull when backtesting different time periods.
Pesonal preference is using the script on a D/W timeframe, while the indicator is configured to use Monthly chart.
The default value of the RSI filter is left to 50, which can be changed. I.e. if the RSI is above 50 we have a regime filter based on the MACD criteria.
EXTERNAL LIBRARIES:
The script uses a couple of external libraries:
HeWhoMustNotBeNamed/enhanced_ta/14 - collection of TA indicators
jason5480/tts_convention/3 - more details about the Template Trading Strategy below
I would like to highly appreciate and credit the work of both HeWhoMustNotBeNamed and jason5480 for providing them to the community.
TTS SETTINGS (NEEDED IF USED TO BACKTEST WITH TTS):
The TempalteTradingStrategy is a strategy script developed in Pine by jason5480, which I recommend for quick turn-around of testing different ideas on a proven and tested framework
I cannot give enough credit to the developer for the efforts put in building of the infrastructure, so I advice everyone that wants to use it first to get familiar with the concept and by checking
by checking jason5480's profile www.tradingview.com
The TTS itself is extremely functional and have a lot of properties, so its functionality is beyond the scope of the current script -
Again, I strongly recommend to be thoroughly epxlored by everyone that plans on using it.
In the nutshell it is a script that can be feed with buy/sell signals from an external indicator script and based on many configuration options it can determine how to execute the trades.
The TTS has many settings that can be applied, so below I will cover only the ones that differ from the default ones, at least according to my testing - do your own research, you may find something even better :)
The current/latest version that I've been using as of writing and testing this script is TTSv48
Settings which differ from the default ones:
from - False (time filter is from the indicator script itself)
Deal Conditions Mode - External (take enter/exit conditions from an external script)
🔌Signal 🛈➡ - MACD_RSI_trend_following: 🔌Signal to TTSv48 (this is the output from the indicator script, according to the TTS convention)
Sat/Sun - true (for crypto, in order to trade 24/7)
Order Type - STOP (perform stop order)
Distance Method - HHLL (HigherHighLowerLow - in order to set the SL according to the strategy definition from above)
The next are just personal preferenes, you can feel free to experiment according to your trading style
Take Profit Targets - 0 (either 100% in or out, no incremental stepping in or out of positions)
Dist Mul|Len Long/Short- 10 (make sure that we don't close on profitable trades by any reason)
Quantity Method - EQUITY (personal backtesting preference is to consider each backtest as a separate portfolio, so determine the position size by 100% of the allocated equity size)
Equity % - 100 (note above)

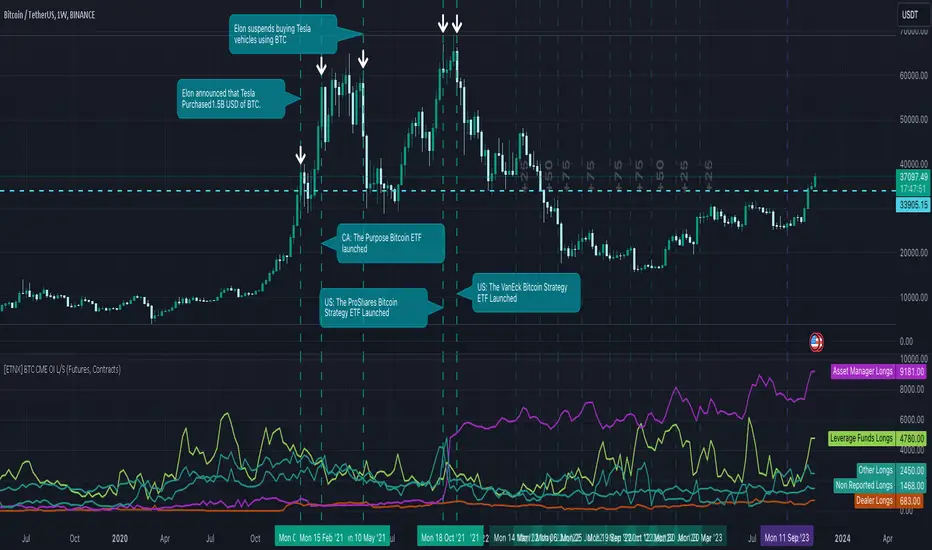
[ETNX] BTC CME OI L/SOVERVIEW
This indicator displays how many traders have Long and Short positions opened on CME Bitcoin Futures and Options. The data is provided from the CFTC Commitments of Traders Reports. These reports are given weekly. Therefore, this indicator works better on weekly timeframes.
The COT reports are separated into 5 categories:
Dealer/Intermediary - These participants are typically described as the “sell side” of the market. Though they may not predominately sell futures, they design and sell various financial assets to clients. They tend to have matched books or offset their risk across markets and clients. Futures contracts are part of the pricing and balancing of risk associated with the products they sell and their activities. These include large banks (U.S. and non-U.S.) and dealers in securities, swaps, and other derivatives.
Asset Manager/Institutional - These are institutional investors, including pension funds, endowments, insurance companies, mutual funds, and portfolio/investment managers whose clients are predominantly institutional.
Leveraged Funds - These are typically hedge funds and various types of money managers, including registered commodity trading advisors (CTAs); registered commodity pool operators (CPOs), or unregistered funds identified by CFTC. The strategies may involve taking outright positions or arbitrage within and across markets. The traders may be engaged in managing and conducting proprietary futures trading and trading on behalf of speculative clients.
Other Reportables - Reportable traders not placed into one of the first three categories are placed into the “other reportables” category. The traders in this category mostly use markets to hedge business risk, whether that risk is related to foreign exchange, equities, or interest rates. This category includes corporate treasuries, central banks, smaller banks, mortgage originators, credit unions and any other reportable traders not assigned to the other three categories.
Non Reportable
INPUT DISPLAY
The Open Interest can be displayed in three ways:
Contracts - How many contracts are opened on CME
BTC - How many BTC the contracts worth
Billions USD - How much is worth in USD based on the CME BTC Price
The Open Interest is calculated for:
Futures - The Futures Short and Long Positions Opened
Futures & Options - The Futures & Options Short and Long Positions Opened
Dual_MACD_trendingINFO:
This indicator is useful for trending assets, as my preference is for low-frequency trading, thus using BTCUSD on 1D/1W chart
In the current implementation I find two possible use cases for the indicator:
- as a stand-alone indicator on the chart which can also fire alerts that can help to determine if we want to manually enter/exit trades based on the signals from it (1D/1W is good for non-automated trading)
- can be used to connect to the Signal input of the TTS (TempalteTradingStrategy) by jason5480 in order to backtest it, thus effectively turning it into a strategy (instructions below in TTS CONNECTIVITY section)
Trading period can be selected from the indicator itself to limit to more interesting periods.
Arrow indications are drawn on the chart to indicate the trading conditions met in the script - light green for HTF crossover, dark green for LTF crossover and orange for LTF crossunder.
Note that the indicator performs best in trending assets and markets, and it is advisable to use additional indicators to filter the trading conditions when market/asset is expected to move sideways.
DETAILS:
It uses a couple of MACD indicators - one from the current timeframe and one from a higher timeframe, as the crossover/crossunder cases of the MACD line and the signal line indicate the potential entry/exit points.
The strategy has the following flow:
- If the weekly MACD is positive (MACD line is over the signal line) we have a trading window.
- If we have a trading window, we buy when the daily macd line crosses AND closes above the signal line.
- If we are in a position, we await the daily MACD to cross AND close under the signal line, and only then place a stop loss under the wick of that closing candle.
The user can select both the higher (HTF) and lower (LTF) timeframes. Preferably the lower timeframe should be the one that the Chart is on for better visualization.
If one to decide to use the indicator as a strategy, it implements the following buy and sell criterias, which are feed to the TTS, but can be also manually managed via adding alerts from this indicator.
Since usually the LTF is preceeding the crossover compared to the HTF, then my interpretation of the strategy and flow that it follows is allowing two different ways to enter a trade:
- crossover (and bar close) of the macd over the signal line in the HIGH TIMEFRAME (no need to look at the LOWER TIMEFRMAE)
- crossover (and bar close) of the macd over the signal line in the LOW TIMEFRAME, as in this case we need to check also that the macd line is over the signal line for the HIGH TIMEFRAME as well (like a regime filter)
The exit of the trade is based on the lower timeframe MACD only, as we create a stop loss equal to the lower wick of the bar, once the macd line crosses below the signal line on that timeframe
SETTINGS:
All of the indicator's settings are for the vanilla/general case.
User can set all of the MACD parameters for both the higher and lower (current) timeframes, currently left to default of the MACD stand-alone indicator itself.
The start-end date is a time filter that can be extermely usefull when backtesting different time periods.
TTS SETTINGS (NEEDED IF USED TO BACKTEST WITH TTS)
The TempalteTradingStrategy is a strategy script developed in Pine by jason5480, which I recommend for quick turn-around of testing different ideas on a proven and tested framework
I cannot give enough credit to the developer for the efforts put in building of the infrastructure, so I advice everyone that wants to use it first to get familiar with the concept and by checking
by checking jason5480's profile www.tradingview.com
The TTS itself is extremely functional and have a lot of properties, so its functionality is beyond the scope of the current script -
Again, I strongly recommend to be thoroughly epxlored by everyone that plans on using it.
In the nutshell it is a script that can be feed with buy/sell signals from an external indicator script and based on many configuration options it can determine how to execute the trades.
The TTS has many settings that can be applied, so below I will cover only the ones that differ from the default ones, at least according to my testing - do your own research, you may find something even better :)
The current/latest version that I've been using as of writing and testing this script is TTSv48
Settings which differ from the default ones:
- from - False (time filter is from the indicator script itself)
- Deal Conditions Mode - External (take enter/exit conditions from an external script)
- 🔌Signal 🛈➡ - Dual_MACD: 🔌Signal to TTSv48 (this is the output from the indicator script, according to the TTS convention)
- Sat/Sun - true (for crypto, in order to trade 24/7)
- Order Type - STOP (perform stop order)
- Distance Method - HHLL (HigherHighLowerLow - in order to set the SL according to the strategy definition from above)
The next are just personal preferenes, you can feel free to experiment according to your trading style
- Take Profit Targets - 0 (either 100% in or out, no incremental stepping in or out of positions)
- Dist Mul|Len Long/Short- 10 (make sure that we don't close on profitable trades by any reason)
- Quantity Method - EQUITY (personal backtesting preference is to consider each backtest as a separate portfolio, so determine the position size by 100% of the allocated equity size)
- Equity % - 100 (note above)
EXAMPLES:
If used as a stand-alone indicator, the green arrows on the bottom will represent:
- light green - MACD line crossover signal line in the HTF
- darker green - MACD line crossover signal line in the LTF
- orange - MACD line crossunder signal line in the LTF
I recommend enabling the alerts from the script to cover those cases.
If used as an input to the TTS, we'll get more decorations on the chart from the TTS itself.
In the example below we open a trade on the next day of LTF crossover, then a few days later a crossunder in the LTF occurs, so we set a SL at the low of the wick of this day. Few days later the price doesn't recover and hits that SL, so the position is closed.

[ETNX] BTC CME TradersOVERVIEW
This indicator displays how many traders have Long and Short positions opened on CME Bitcoin Futures and Options. The short traders have negative values only for display purposes. Therefore, if the short value is displayed as -56, that means that there are 56 traders that have short positions opened. The total of traders is the sum of short and long traders. The data is provided from the CFTC Commitments of Traders Reports. These reports are given weekly. Therefore, this indicator works better on weekly timeframes.
The COT reports are separated into 5 categories:
Dealer/Intermediary - These participants are typically described as the “sell side” of the market. Though they may not predominately sell futures, they design and sell various financial assets to clients. They tend to have matched books or offset their risk across markets and clients. Futures contracts are part of the pricing and balancing of risk associated with the products they sell and their activities. These include large banks (U.S. and non-U.S.) and dealers in securities, swaps, and other derivatives.
Asset Manager/Institutional - These are institutional investors, including pension funds, endowments, insurance companies, mutual funds, and portfolio/investment managers whose clients are predominantly institutional.
Leveraged Funds - These are typically hedge funds and various types of money managers, including registered commodity trading advisors (CTAs); registered commodity pool operators (CPOs), or unregistered funds identified by CFTC. The strategies may involve taking outright positions or arbitrage within and across markets. The traders may be engaged in managing and conducting proprietary futures trading and trading on behalf of speculative clients.
Other Reportables - Reportable traders not placed into one of the first three categories are placed into the “other reportables” category. The traders in this category mostly use markets to hedge business risk, whether that risk is related to foreign exchange, equities, or interest rates. This category includes corporate treasuries, central banks, smaller banks, mortgage originators, credit unions and any other reportable traders not assigned to the other three categories.
Non Reportable
INPUT DISPLAY
The Open Interest can be displayed in three ways:
Futures - The Futures Short and Long Positions Opened
Options - The Options Short and Long Positions Opened
Futures & Options - The Futures & Options Short and Long Positions Opened

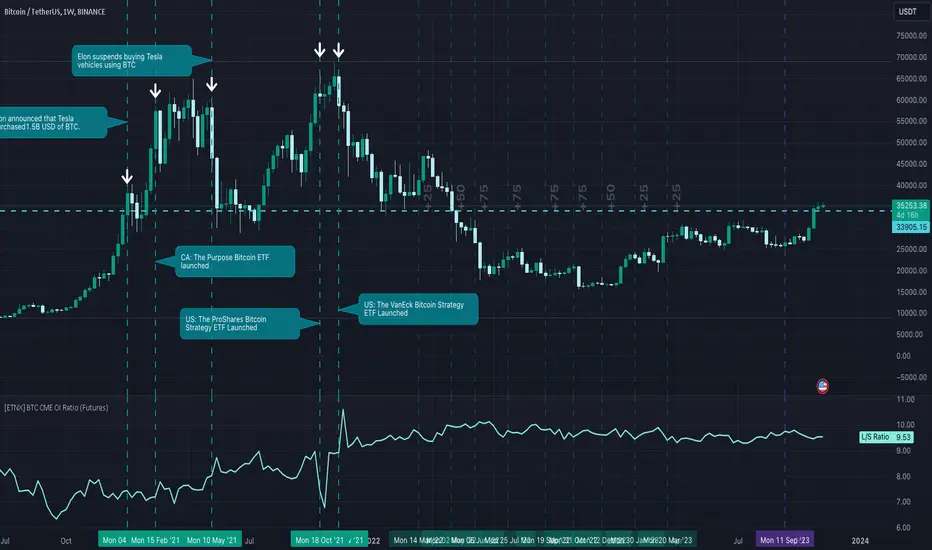
[ETNX] BTC CME OI RatioOVERVIEW
This indicator displays the Ratio between the Long and Short positions opened on CME Bitcoin Futures and Options. The data is provided from the CFTC Commitments of Traders Reports. These reports are given weekly. Therefore, this indicator works better on weekly timeframes.
The COT reports are separated into 5 categories:
Dealer/Intermediary - These participants are typically described as the “sell side” of the market. Though they may not predominately sell futures, they design and sell various financial assets to clients. They tend to have matched books or offset their risk across markets and clients. Futures contracts are part of the pricing and balancing of risk associated with the products they sell and their activities. These include large banks (U.S. and non-U.S.) and dealers in securities, swaps, and other derivatives.
Asset Manager/Institutional - These are institutional investors, including pension funds, endowments, insurance companies, mutual funds, and portfolio/investment managers whose clients are predominantly institutional.
Leveraged Funds - These are typically hedge funds and various types of money managers, including registered commodity trading advisors (CTAs); registered commodity pool operators (CPOs) or unregistered funds identified by CFTC. The strategies may involve taking outright positions or arbitrage within and across markets. The traders may be engaged in managing and conducting proprietary futures trading and trading on behalf of speculative clients.
Other Reportables - Reportable traders not placed into one of the first three categories are placed into the “other reportables” category. The traders in this category mostly use markets to hedge business risk, whether that risk is related to foreign exchange, equities, or interest rates. This category includes corporate treasuries, central banks, smaller banks, mortgage originators, credit unions and any other reportable traders not assigned to the other three categories.
Non Reportable
IMPORTANT
The SPREADS are excluded. “Spreading” is a computed amount equal to offsetting long and short positions held by a trader. The computed amount of spreading is calculated as the amount of offsetting futures in different calendar months or offsetting futures and options in the same or different calendar months. Any residual long or short position is reported in the long or short column. Inter-market spreads are not considered.
INPUT INCLUDE Non-Reportable
This ratio excludes by default the Non-Reportable category. If this input is enabled, the ratio between Longs and Shorts should flatten.
INPUT DISPLAY
The Open Interest can be displayed in three ways:
Futures - The Futures Short and Long Positions Opened
Options - The Options Short and Long Positions Opened
Futures & Options - The Futures & Options Short and Long Positions Opened
TrendX Earning-Approach Valuation (Stock)TrendX Earning-Approach Valuation (Stock) indicator is a Fundamental Analysis tool that only focus on the Earnings of the company.
USAGE
This Earning-Approach Valuation is easy to use and customize. TrendX valuates a company's Fair Value based on all the earnings multiples and its average with a little interference of users' risk capacity. Technical Analysis is also included as an additional basis for investment decisions.
Valuation tool
The strategy projects the future value of the company based on its Fiscal Quarter operating income, net income and diluted total shares outstanding. Operating income is the income from the core business operations, before interest and taxes. Net income is the income after interest, taxes and other expenses. The strategy assumes that the operating income and net income will grow at the same rate as their historical values.
The strategy also adjusts the diluted total shares outstanding, which may change due to dilutive securities, to calculate the projected EPS. It then uses the price-to-earnings (P/E) as a multiple in future valuation approach.
Value classification
TrendX classifies 2 phases between Under-value and Over-value, which are represented in green and red, respectively. This toolkit can work well with other indicators of technical analysis, but it can also stand on its own because of its built-in Technical Analysis plugins, which are explained below.
Display potential Support and Resistance levels
TrendX shows support and resistance levels based on the company's past and present Fair Values, which is colored in white. It also draws a current Fair Value line with green coloring.
Potential Entry and Exit zone
By combining the Breakout and retesting technique in both Lagging and Leading's perpective, with the Earning-based valuation, traders can optimize not only the entry-level at the Undervalued zone but also the exit-level at the potential “Bear” area.
Margin of Safety
TrendX also incorporates the margin of safety, which is shown in Risk Ability for customs.
CONCLUSION
The strategy is useful for valuing companies that have positive and stable earnings, and a predictable growth rate. Accordingly, it can also be helpful for traders to use alongside other forms of Technical Analysis.
Many traders fail to realize that indicators are not enough to achieve success, and they end up getting confused and frustrated by trying to find a perfect solution. TrendX aims to avoid this problem by providing clear and concise signals that can be easily followed
Disclaimer
The results achieved in the past are not all reliable sources of what will happen in the future. There are many factors and uncertainties that can affect the outcome of any endeavor, and no one can guarantee or predict with certainty what will occur.
The strategy also relies on assumptions that may not be accurate or realistic, which can vary depending on the market conditions and investor sentiment.
If you notice significant changes in the Valuation over time, it is due to revisions in the company’s reported financials, changes in accounting standards, or corrections of previous errors.
Therefore, you should always exercise caution and judgment when making decisions based on past performance.

MA + MACD alert TrendsThis is a strategy/combination of warning indicators using 6MA+MACD.
The strategy details are as follows: This is a simple warning strategy created so that we don't have to monitor the candlestick chart too often.
Note: This isn't an entry strategy; it's a signaling strategy for upcoming trends. For maximum efficiency, we should incorporate more formulas into the command. In the case below, I use Fibonacci to enter the command.
This strategy setting works for a 15-minute time frame, but it can still work for different time frames.
It has been working well with Gold and USOIL for the last two years, as well as with currency pairs like EURUSD and many others.
Components:
EMA100 + EMA200 + MA400 + MA800
MACD (timeframe greater than 1 timeframe)
Fibonacci retreat.
Uptrend alert:
Candles on both EMAs (100-200) + 2 SMAs (400-800)
In the previous 80 candles:
EMA100 cross up to EMA200
At the same time, the MACD cross up 0.
The uptrend warning will trigger when EMA6 cuts down to MA10. That's when the price creates the top and we'll wait for the market to go back to the Fibonacci threshold of 0.618 and start buying (or wait for markets to break up the trendline to buy).
Downtrend alert:
Candles are below both EMAs ( 100-200 ) + 2 SMAs ( 400-800 )
In the previous 80 candles:
EMA100 cross down to EMA200
At the same time, the MACD cross down zero.
The downtrend warning will trigger when EMA6 cuts to MA10. That's when the price creates a bottom and we'll wait for the market to go back to the Fibonacci threshold of 0.618 and start selling (or wait for the market to break down the trendline to sell).
Recommended RR: 1:1
If you have any questions please let me know!

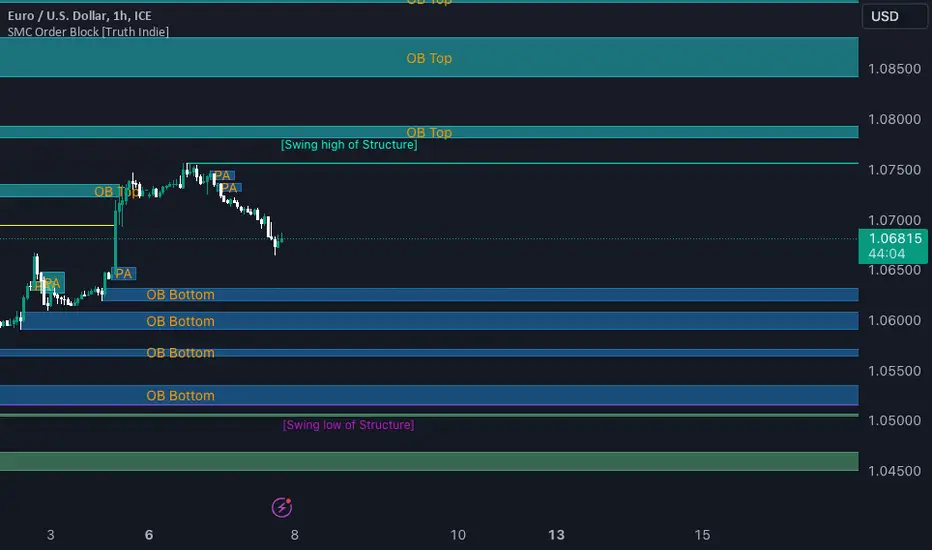
SMC Order Block [Truth Indie]Smart Money Concept (SMC)
For me, SMC is a trading philosophy that stems from those with knowledge and understanding of the structure of the Smart Money group's trading system. It is developed through the observation of price behavior.
SMC is related to the Smart Money group or those entities that can influence the market, such as financial institutions, banks, or funds. Market movements are often driven by market fundamentals or economics. The Smart Money group possesses extensive research data for analyzing the market's fundamentals and has the ability to steer the market in various directions based on market and economic fundamentals at a given time.
The SMC concept is adapted from the ICT concept, and it was developed and shared by The Inner Circle Trader.
I have been studying and trying to understand SMC for some time, and I have many questions I would like to explore. The challenge lies in the fact that different sources of knowledge on this topic often have varying teachings, and my proficiency in the English language is limited. As a result, I haven't had the opportunity to study from the primary source, The Inner Circle Trader.
This indicator was created for the purpose of researching Market Structure and Order Blocks, which are integral parts of the SMC Concept.
The fundamental principle for identifying Order Blocks is as follows:
1.Locate swings that create candlestick imbalances.
2.An imbalance refers to a candlestick that is larger than the preceding one and contains a Fair Value Gap (FVG).
This indicator categorizes Order Blocks into four types, and you are encouraged to customize them to suit your preferences.
OB Type1
1.The closing price of candle has an opposite direction to the candle .
2.Candle has a wick longer than its body, by at least 1 times or more (adjustable).
3.Candle has a wick longer than candle , by at least 2 times or more (adjustable).
4.There is a Fair Value Gap (FVG) between the wicks of candle and .
OB Type1_HTF
-This condition is the same as OB Type1, but it involves analyzing 6 candles instead. This means looking at a larger time frame, twice as big as the original one.
OB Type2
1.The closing price of candle has the opposite direction to candle .
2.Candle has a body larger than its wick by at least 1 times or more (adjustable).
3.Candle has a body larger than candle by at least 2 times or more (adjustable).
4.There is a Fair Value Gap (FVG) between the wicks of candle and .
OB Type2_HTF means observing a larger time frame, specifically twice as big as the previous one.
OB Type3
1.The closing price of candle has the same direction as candle .
2.Candle has a wick longer than its body, by at least 1 times or more (adjustable).
3.Candle has a wick longer than candle , by at least 2 times or more (adjustable).
4.There is a Fair Value Gap (FVG) between the wicks of candle and .
OB Type3_HTF means observing a larger time frame, specifically twice as big as the previous one.
OB Type4
1.The closing price of candle has the same direction as candle .
2.Candle has a body larger than its wick by at least 1 times or more (adjustable).
3.Candle has a body larger than candle by at least 2 times or more (adjustable).
4.There is a Fair Value Gap (FVG) between the wicks of candle and .
OB Type4_HTF is an indicator that involves looking at a larger time frame, specifically twice as big as the original one.
Order Block Setting
1.Click to activate the OB search in different Types.
2.Adjust the body of the candle .
3.Adjust the strength of the candle or the Imbalance candle.
4.You can change the name of OB.
5.Adjust the font size and color.
6.Adjust the color of the OB BOX and History BOX.
7.Adjust the font of OB HTF.
1.It refers to the value of W for a specific candle.
2.It refers to the value of Im for a specific candle.
3.It refers to the values of W and Im in the HTF.
4.For OB Type1 and Type3, a higher W value will search for candles with a larger wick and a smaller body. When the W value is lower, it will search for candles with a smaller wick and a larger body, moving from low to high.
5.For OB Type2 and Type4, a lower W value will search for candles with a smaller wick and a larger body. When the W value is higher, it will search for candles with a larger wick and a smaller body, moving from high to low.
Market Structure
Comprising the process of breaking the price structure, resulting in BOS (Breakout of Structure) or CHoCH (Change of Character High), and creating new High or Low based on the price structure.
1.When the market forms a price structure with High and Low, when the price moves to disrupt the structure in either direction, it will lead to BOS or CHoCH, resulting in a new High or Low. You can adjust the method of breaking the structure using the close, high, or low.
2.When you break the price structure, a High or Low will be formed on one side, and it will lead to an Inducement Swing. When the price moves and collides, it will create a price range of High and Low. You can adjust the method of breaking the structure using the close, high, or low.
3.There is an option for testing Fibonacci (Fibo). Its function is similar to the Inducement Swing. You can adjust the Fibonacci settings.
Premium & Discount Zone
1.The Premium & Discount Zone will appear based on the current price structure. It helps you see the price zones you are interested in.
2.You can adjust the %Premium & Discount as needed.
3.The OB (Order Block) will be displayed when a price structure of High and Low forms within the Premium & Discount Zone. The OB in this indicator is not a recommendation to buy or sell. You need to research and test various conditions before making trading decisions.
Everyone's trading strategies are different, and it comes down to backtesting and selecting the strategy that suits your individual needs. Hopefully, this indicator will assist the TradingView community of traders in their trading endeavors.
Directional Bollinger Bands PredictorThis strategy works on the principal that if Bollinger bands are closer to each other then the price is sideways and if it expands then the market is trending.
The strategy is built with a standard deviation of 2 from the EMA 20 and with a range of 0.25.
Explanation of Input Settings:
1. EMA Length: Set as a standard 20 EMA however the trader can make changes if required
2. Standard Deviation Multiplier: This depicts the value of the bands that are formed in association to the EMA value. The default is set to 2 however the same can be changed by the trader.
3. Threshold Value: The threshold Value is the percentage of squeeze within the bands that show if the market is sideways or not. The standard is set at 0.25 however it can be changed.
Unlike the standard Bollinger Bands this indicator will help the user differentiate between rangebound markets and trending markets as a result of which the user can deploy the following trading systems
A. Small reversal trades from the upper band to the lower band when the area is highlighted and the market is range bound and
B. Trend following trades when the bands start expanding and the highlight is omitted.

The Master Pattern Indicator***READ THIS FIRST****
THE MASTER PATTERN Indicator
USER AGREEMENT
*** The personal/private use of this indicator is allowed, commercial use is FORBIDDEN.
***Commercial use will be interpreted as taking advantage of the free indicator in order to profit from it, for example: as part of any courses or mentorships offering training of the indicator or the concept its based. You don't need to pay for any training for this, the strategy is a simple trend following approach, even a caveman would understand.
**********************************************************************************************************************
Now please enjoy the BEST Master Pattern indicator you will ever find for Tradingvew, and for the best price: FREE.
Please do not give money to people trying to charge you for any inferior version of this indicator.
DESCRIPTION
The Master Pattern indicator or The Forex Master Pattern is an alternative form of technical analysis that provides a framework which will help you to find and follow the hidden price pattern that reveals the true intentions of financial markets. This algorithm I came up with does a very good job detecting the Phase 1 of the Forex Master Pattern cycle, which is the contraction point (or Value), and then proceeds to differentiate between major or minor lines and prints the liquidity lines the correct manner in relation to the swings expanding from the contraction.
On Phase 2 we get higher timeframe activation (also called Expansion), which is where price oscillates above and below the average price defined on Phase 1.
On Phase 3 is where we get a sustained deviation from value (the Trend).
In a very short time you will start noticing this pattern, even on naked charts. It is all a matter of training your eyes - the more time you invest studying the charts with this indicator (both historically and replaying the market on strategy tester), the faster you will become familiar with this method.
This indicator DOES NOT REPAINT. You can safely study the chart historically because what is printed historically is what prints real time.
Why do traditional based indicator systems fail over time? Because the markets move in cycles that constantly change structure. Those traditional indicator systems must be constantly optimized and settings tinkered with because of the changing market environment. There are an infinite number of variables that affect price so no exact technical system can work the same forever, which is also the reason why most bots/EA fail.
If you learn to spot the Forex Master Pattern and understand the sequence of the real cycles that drive the markets, you can more accurately forecast market behavior. By using traditional indicators you end up masking this pattern.
Use the insights provided by the Forex Master Pattern indicator to elevate your trading to the next level.
This method of analysis works in any liquid market and timeframe.
VERY IMPORTANT:
The default setting of historical bars is set to 500. This is more than enough for day trading and ensures fast drawings loading time and stable performance. Bear in mind that, the more bars you choose to load historically, the longer it will take to draw everything. The max setting of this input for now is 800. If it is possible to increase it, I will update the code. So if you want to make historical analysis far in the past, just use the chart replay feature.
Indicator Parameters:
They are all self-explanatory, except Type. You can choose between 1 and 2.
1 is better suited for LTF (M1 to M30)
2 is better suited for HTF (H1 and upwards)
However, this is my personal preference. You can of course experiment and choose what looks best for you.
Instructions to use the alert function:
1st step - Choose symbol and timeframe for the alert
2nd step - Go to indicator settings and tick/untick the boxes for the alerts you want
3rd step - Click on the ... (three dots) next to the indicator name (chart upper left corner) and click to add indicator alert
Then it's gonna add the alert with the conditions that you've ticked/unticked inside indicator settings.
Then repeat the process for different symbols, timeframes and different alert conditions.

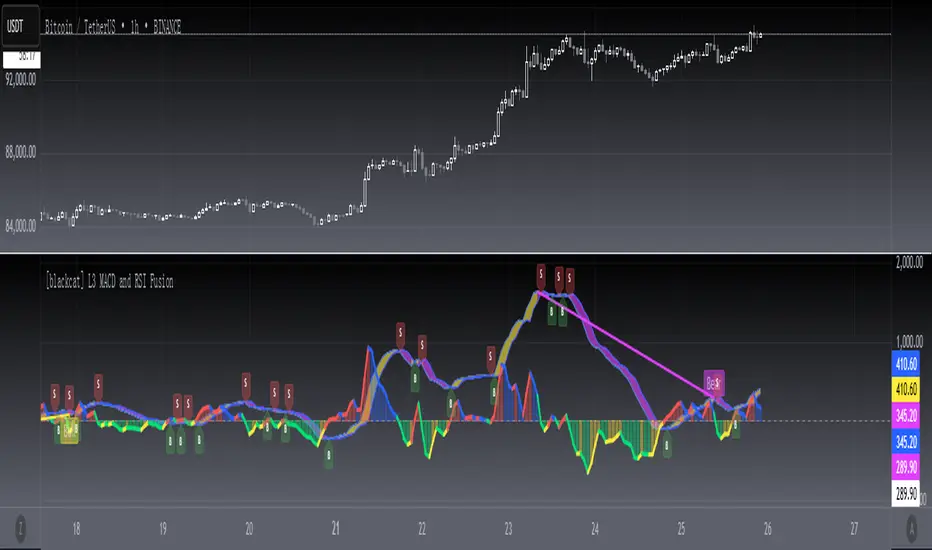
[blackcat] L3 MACD and RSI Fusion The MACD and RSI fusion is a popular technical analysis strategy used by traders to identify buy and sell signals in the market. The strategy makes use of two popular technical indicators, the Moving Average Convergence Divergence (MACD) and the Relative Strength Index (RSI), and combines them to create a powerful trading signal.
The MACD and RSI fusion was originally developed for the Chinese stock market and is commonly used by traders all over the world. The strategy is based on the idea that the MACD and RSI indicators can be used together to provide a more accurate and reliable signal.
To use the MACD and RSI fusion , traders need to follow a few simple steps. The following code is the TradingView Pine script v4 indicator equivalent of the original MACD and RSI fusion code:
```
//@version=4
study(" MACD and RSI fusion ", overlay=false)
// Define the simple fusion indicator
simple_fusion = (ema(close, 12) - ema(close, 26)) * 1.2 + rsi(close, 14) / 50
// Define the simple fusion lag indicator
simple_fusion_lag = nz(simple_fusion )
// Plot the simple fusion and simple fusion lag indicators
plot(simple_fusion, color=color.blue, title="simple fusion")
plot(simple_fusion_lag, color=color.red, title="simple fusion Lag")
```
This code defines the simple fusion and simple fusion Lag indicators and plots them on the chart. The simple fusion indicator is the sum of the 12- and 26-period exponential moving averages of the closing price, multiplied by 1.2, and added to the 14-period relative strength index of the closing price, divided by 50. The simple fusion Lag indicator is the value of the simple fusion indicator from the previous period.
Traders can use the simple fusion and simple fusion Lag indicators to identify buy and sell signals. When the simple fusion indicator crosses above the simple fusion Lag indicator, it is a buy signal, and when the simple fusion indicator crosses below the simple fusion Lag indicator, it is a sell signal.
In conclusion, the MACD and RSI fusion is a simple but powerful technical analysis strategy that combines two popular technical indicators to identify buy and sell signals in the market.
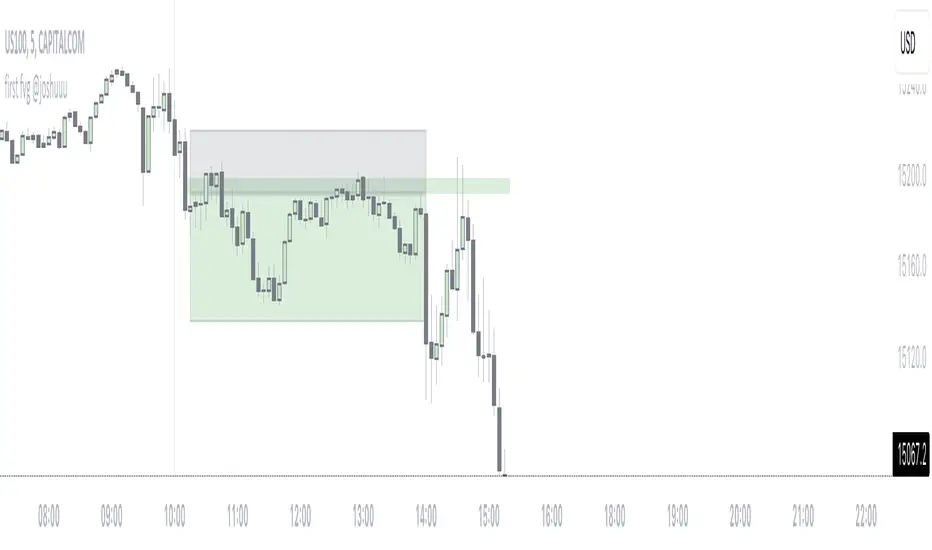
first fvg @joshuuuThis indicator was created to display and alert the user for the first Fair Value Gap (FVG) of up to three trading sessions.
Bullish FVG occurs when the high of the first candle is lower than the low of the third candle, resulting in a price gap between them.
Conversely, a Bearish FVG takes place when the low of the first candle is higher than the high of the third candle, leading to a gap between these prices.
ICT emphasizes on three crucial timeframes: 3-4 am NY, 10-11 am NY, and 2-3 pm NY, collectively referred to as the 'silver bullet' times. The very first FVG formed during these periods can significantly impact the remainder of that trading session.
Building upon these concepts, CasperSMC developed a strategy involving buying/selling the very first FVG and placing a stop order just above/below the candle responsible for creating the FVG.
The strategy aims for a consistent 2-to-1 Reward-to-Risk ratio (2RR).
This indicator serves to support the strategy by not only displaying those fvgs but also sending alerts, reducing the need for constant screen monitoring.
13E2113E21 is a strategy based on the concept of "Buy-on-Dip" and "Sell-on-Rise". The strategy is built around the concept that as the market starts trending in a particular direction it will give a retrace to it's 13 exponential moving average price and then continue in it's trend thus forming higher lows (or lower highs) in the process.
The indicator 13E21 helps determine the 2 EMAs (13 and 21) and also highlights the candle that touches either EMAs and closes accordingly.
The edge in the code is that it makes use of the difference between the two EMAs as a signal of the market trending. It will trigger an entry only when the difference between the two EMAs is greater than 0.02% thus implying that the market is actually trending and not consolidating.
The indicator will give bullish triggers only when the price touches 13EMA or 21EMA, the closing price is greater than 13EMA and the difference between 13EMA and 21EMA is greater than 0.02% or 10 points.
Similarly, the indicator will give bearish triggers only when the price touches 13EMA or 21EMA, the closing price is less than 13EMA and the difference between 13EMA and 21EMA is greater than 0.02% or 10 points.

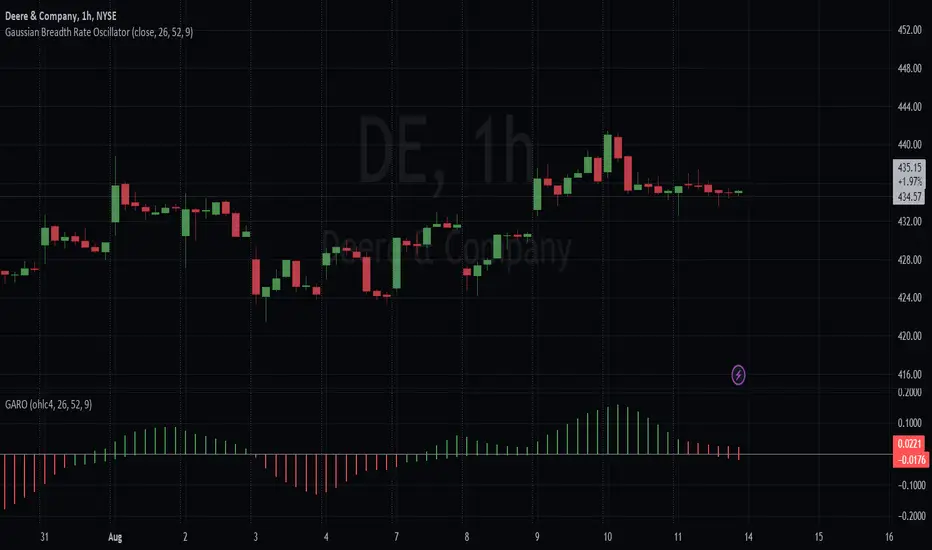
Gaussian Average Rate Oscillator
Within the ALMA calculation, the Gaussian function is applied to each price data point within the specified window. The idea is to give more weight to data points that are closer to the center and reduce the weight for points that are farther away.
The strategy calculates and compares two different Rate of Change (ROC) indicators: one based on the Arnaud Legoux Moving Average (ALMA) and the other based on a smoothed Exponential Moving Average (EMA). The primary goal of this strategy is to identify potential buy and sell signals based on the relationship between these ROC indicators.
Here's how the strategy logic works
Calculating the ROC Indicators:
The script first calculates the ROC (Rate of Change) of the smoothed ALMA and the smoothed EMA. The smoothed ALMA is calculated using a specified window size and is then smoothed further with a specified smoothing period. The smoothed EMA is calculated using a specified EMA length and is also smoothed with the same smoothing period.
Comparing ROCs:
The script compares the calculated ROC values of the smoothed ALMA and smoothed EMA.
The color of the histogram bars representing the ROC of the smoothed ALMA depends on its relationship with the ROC of the smoothed EMA. Green indicates that the ROC of ALMA is higher, red indicates that it's lower, and black indicates equality.
Similarly, the color of the histogram bars representing the ROC of the smoothed EMA is determined based on its relationship with the ROC of the smoothed ALMA, they are simply inversed so that they match.
With the default color scheme, green bars indicate the Gaussian average is outperforming the EMA within the breadth and red bars mean it's underperforming. This is regardless of the rate of average price changes.
Generating Trade Signals:
Based on the comparison of the ROC values, the strategy identifies potential crossover points and trends. Buy signals could occur when the ROC of the smoothed ALMA crosses above the ROC of the smoothed EMA. Sell signals could occur when the ROC of the smoothed ALMA crosses below the ROC of the smoothed EMA.
Additional Information:
The script also plots a zero rate line at the zero level to provide a reference point for interpreting the ROC values.
In summary, the strategy attempts to capture potential buy and sell signals by analyzing the relationships between the ROC values of the smoothed ALMA and the smoothed EMA. These signals can provide insights into potential trends and momentum shifts in the price data.
Greedy DCA█ OVERVIEW
Detect price crashes in volatile conditions. This is an indicator for a greedy dollar cost average (DCA) strategy. That is, for people who want to repeatedly buy an asset over time when its price is crashing.
█ CONCEPTS
Price crashes are indicated if the price falls below one or more of the 4 lower Bollinger Bands which are calculated with increasing multipliers for the standard deviation.
In these conditions, the price is far below the average. Therefore they are considered good buying opportunities.
No buy signals are emitted if the Bollinger Bands are tight, i.e. if the bandwidth (upper -lower band) is below the value of the moving average multiplied with a threshold factor. This ensures that signals are only emitted if the conditions are highly volatile.
The Bollinger Bands are calculated based on the daily candles, irrespective the chart time frame. This allows to check the strategy on lower time frames

Sublime Trading | Trend Strength FilterWhat kind of traders/investors are we?
We are trend followers. Our scripts are designed to be used on the higher timeframes (weekly/daily) to catch the large moves/trends in the market.
Most have heard of long-term trend following. Few know how to execute the strategy.
Our scripts are designed specifically to identify and invest in long-term market trends.
What does this script do?
Identifying trends is at the heart of sound investing.
This script is colour coded to help identify long-term trends and environments where you will want to consider taking positions.
It is also designed to identify sideways/consolidating markets, environments where you will want to consider standing aside.
How is the trailing stoploss produced?
The script uses two sets of Bollinger Bands, one with setting Standard Deviation 1 and the other with Standard Deviation 2.
These settings help to create 3 zones - Buy, Sell and Stand Aside.
The bars will change colour according to which zone they are in.
The Buy zone is colour-coded green, and when a bull market or the start of a bull trend is in play. The green switches from light green to dark green as the asset’s price moves above the Buy zone.
This switch in colour serves as a warning that a reversal/pullback may occur next from bullish to bearish.
The Sell zone is colour-coded red and when a bear market or the start of a bear trend is in play. The red switches from light red to dark red as the asset’s price moves below the Sell zone.
This switch in colour serves as a warning that a reversal/pullback may occur next from bearish to bullish.
The Stand Aside is confirmed when the colour-code changes to grey. This may not necessarily mean a trend reversal but simply a time to apply patience before a trend continuation.
A sustained mixture of red, green and grey bars confirms a consolidation or sideways market and when investors/traders will want to stand aside and consider another asset.
What is the best timeframe to use the script?
Long-term trends are identified on the daily and weekly timeframes where traders and investors take fewer positions but hold for longer time periods.
We recommend using the script in unison on the weekly and daily timeframes.
When both timeframes fall into the Buy zone and colour-coded green, it signifies a strong bull market.
When both timeframes fall into the Sell zone and colour-coded red, it signifies a strong bear market.
When there is a mixture of green, red and grey bars across the two timeframes, it signifies a sideways market and when investors stand aside and protect their capital.
The weekly timeframe will also help mask the noise on the daily timeframe, allowing you to hold positions longer.
The Trailing Strength Filter script is for investors who want to identify and invest in long-term trends whilst simultaneously eliminating intraday swings.
What makes this script unique?
Identifying the start of long-term trends and then riding out established trends are among the main struggles budding investors face. This script has been coded specifically for the daily and weekly timeframe to:
Seamlessly identify the start, middle and end of trends
Align with the market and remove social media noise calling market tops and bottoms
Allow for discretion when entering but particularly exiting of positions if a market trend has not ended
This trend filter script ensures alignment with long-term market trends.

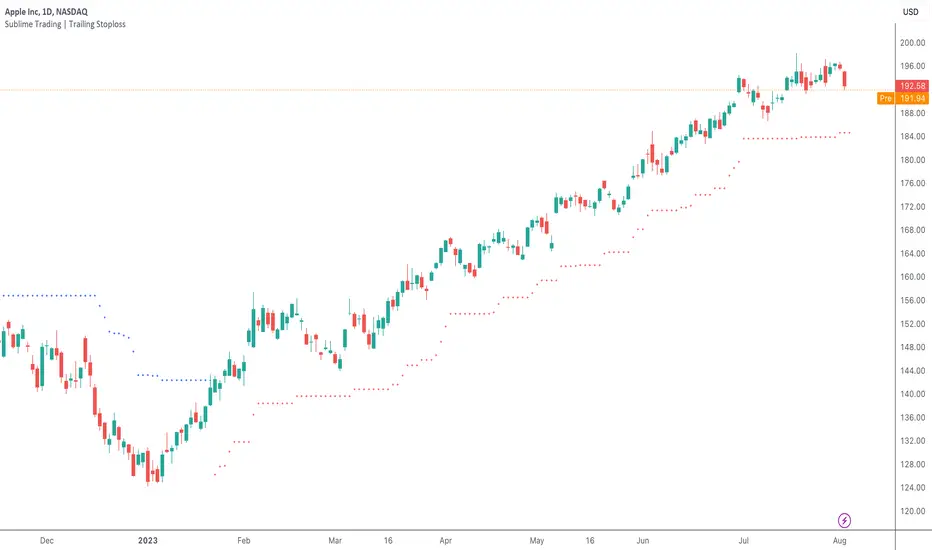
Sublime Trading | Trailing StoplossWhat kind of traders/investors are we?
We are trend followers. Our scripts are designed to be used on the higher timeframes (weekly/daily) to catch the large moves/trends in the market.
Most have heard of long-term trend following. Few know how to execute the strategy.
Our scripts are designed specifically to identify and invest in long-term market trends.
What does this script do?
The exit from a position is arguably more important than the entry.
Traders/Investors will regularly find themselves in an asset based on some logic, but the exit management is very much an afterthought.
Hence why traders often take profit too early and hold onto losing positions. It is emotionally driven.
The Trailing Stoploss script is designed to remove the guesswork and show you precise levels you will want to consider exiting a position when an asset reverses.
How is the trailing stoploss produced?
The script uses the formula ATR 15 x 4.
We use ATR as it produces a stoploss which is unique to the volatility of the asset. The more volatile the asset, the wider the stoploss.
We use ATR 15 as it brings an average reading across half a month, incorporating days of extreme volatility.
The multiplier 4 works well to avoid positions being stopped out prematurely on pullbacks.
When the trailing stoploss is hit, this is where you will want to consider taking profit.
What is the best timeframe to use the script?
We recommend the daily timeframe as this is where trend followers enter assets to maximise the potential of long-term trends.
The higher timeframes are where traders and investors take fewer positions and hold for longer time periods.
The trailing stoploss follows the price of the asset a distance away to give the trend structure enough space and time to develop.
A trend is ultimately a function of time. If you eliminate time, you eliminate the trend. If you eliminate the trend, you eliminate profit.
The Trailing Stoploss script is necessary for investors who appreciate that profit is accumulated by letting winning positions run and not taking profit too early.
What makes this script unique?
Exit management and knowing when to let go of an asset is one of the main struggles budding investors face. This script has been coded specifically for the daily timeframe to:
Create a trailing stoploss that is unique to the volatility of the asset.
Allow investors to stay in positions for the duration of the trend over many months.
To distinguish between a pullback and a market reversal, allowing for discretion.
This TSL script is designed to manage positions investors take in line with long-term market trends.
Sublime Trading | Donchian Breakout SignalsWhat kind of traders/investors are we?
We are trend followers. Our scripts are designed to be used on the higher timeframes (weekly/daily) to catch the large moves/trends in the market.
Most have heard of long-term trend following. Few know how to execute the strategy.
Our scripts are designed specifically to identify and invest in long-term market trends.
What does this script do?
It produces entry signals in a confirmed bull and bear trend.
The logic is based on Donchian 20, which serves the following two purposes:
1. Confirms end-of-day entry points in a long-term trend
2. Filters out entry points in a sideways market
The signal is produced on a break and close of the Donchian 20 high in a bull trend and a break and close of the Donchian 20 low in a bear trend.
How is the entry price produced?
The entry is based on a percentage value of the range of the breakout bar added to the high of the bar in a bull trend.
In a bear trend, the percentage is subtracted from the low of the bar.
This gives an objective entry when placing a position once the OHLC of a bar is confirmed at the end of the trading day.
How is the stoploss price produced?
The script uses the formula ATR 15 x 4.
We use ATR as it produces a stoploss which is unique to the volatility of the asset. The more volatile the asset, the wider the stoploss.
We use ATR 15 as it brings an average reading across half a month, incorporating days of extreme volatility.
The multiplier 4 works well to avoid positions being stopped out prematurely on pullbacks.
When the stoploss is hit, there is when traders and investors may consider exiting positions.
What is the best timeframe to use the script?
We recommend the daily timeframe as this is where trader and investors identify and enter long-term market trends.
The higher timeframes are where traders and investors take fewer positions but hold for longer time periods.
As a result, trend followers place priority on the quality of the entry rather than quantity.
What makes this script unique?
This script has been coded specifically for the daily timeframe to:
Highlight the start of a potential long-term trends.
Confirm entry points at the end of the trading day, absorbing intraday noise.
Reduce fake breakouts in a trend.
Continue to create entry points as the trend develops to allow for compounding.
Filter out breakouts in a sideways market.
This entry signal script helps traders and investors focus on the quality of a potential position when investing in long-term market trends.

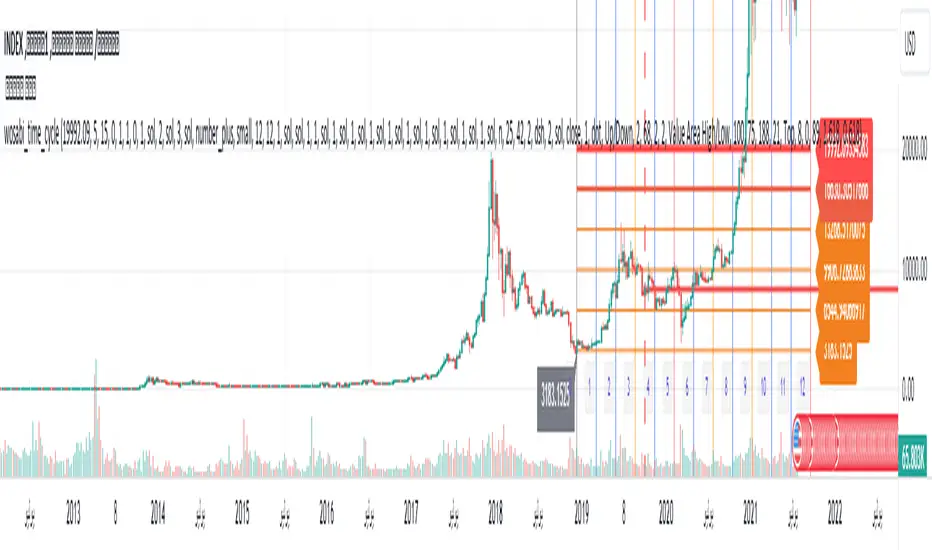
Wosabi Time Cycle Gann v1 This indicator is an auxiliary tool for drawing the five-year and ten-year cycle, as it draws vertical lines every 12 candles and for 12 minor cycles, so that a major cycle consists of 144 candles, which is the ten-year cycle. It helps to know whether the current trend will continue for the five-year cycle and whether it will complete the ten-year cycle or not The standard cycle assumes that the trend is from a bottom or a top, if it continues for more than 24 candles to 36 candles, then corrects and does not break the bottom or top, then the trend will continue at least to complete the five-year cycle, i.e. 72 candles, and if the trend continues and the seven-year cycle closes at the 82 candle above The price of the candle of the strategic line No. 42, there is a possibility to complete the ten-year cycle (you must have experience in the standard patterns of time cycles as explained by gan).
The indicator also draws the digital gates in horizontal lines, and you have to select them manually and adjust the price difference from one currency to another from the settings.
When adding the indicator for the first time, you must specify the candle of the beginning of the trend, whether at a bottom or a top, as well as specifying the highest or lowest price that is expected to reach five digital gates, and you can modify the gates later in the settings.
You can show a horizontal line at the close of each minor cycle of 24 candles, and you can adjust the line length from the settings.
You can also show lines on the vibration plugs.
When the trend is up, the end price must be higher than the starting price, in order to draw the direction for the gates correctly, and when the trend is down, the end price must be lower than the starting price.
Important note: This indicator depends on your experience in time cycles and will not give you any buy or sell signals. It is an indicator that saves you drawing for cycles and gates and depends on your personal experience in time cycles.
هذا المؤشر اداة مساعدة لرسم دورة الخمس سنوات والعشر سنوات، فهو يرسم خطوط اعمده راسية كل 12 شمعة ولعدد 12 دورة صغرى لتتكون دورة كبرى من 144 شمعة وهي دورة العشر سنوات وهي تساعد لمعرفة هل الاتجاه الحالي سيستمر لدورة الخمس سنوات وهل سيكمل دورة العشر سنوات ام لا ، فالدورة القياسية تفترض ان الاتجاه من قاع او قمة اذا استمر لاكثر من 24 شمعة الى 36 شمعة ثم صحح ولم يكسر القاع او القمة فإن الاتجاه سيستمر على الاقل لاكمال دورة الخمس سنوات اي 72 شمعة ، واذا استمر الاتجاه واغلق دورة السبع سنوات عند الشمعة 82 فوق سعر شمعة خط الاستراتيجي رقم 42 فهنالك احتمالية لاكمال دورة العشر سنوات (يجب ان يكون ليك خبرة في الانماط القياسية للدورات الزمنية كما شرحها gan).
كذلك يقوم المؤشر برسم البوابات الرقمية في خطوط افقية وعليك تحديدها بشكل يدوي وتعديل فارق السعر من عملة لاخرى من الاعدادات .
عند اضافة المؤشر لاول مرة يجب تحديد شمعة بداية الاتجاه سواء عند قاع او قمة وكذلك تحديد السعر الاعلى او الادنى المتوقع ان تصل له خمس بوابات رقمية ويمكنك تعديل البوابات لاحقا من الاعدادات .
يمكنك اظهار خط افقي عند اغلاق كل دورة صغرى لعدد 24 شمعة ويمكنك تعديل طول الخط من الاعدادات .
يمكنك كذلك اظهار خطوط على شمعات الاهتزاز .
عندما يكون الاتجاه صاعد يجب ان يكون سعر النهاية اعلى من سعر البداية ليتم رسم الاتتجاه للبوابات بشكل صحيح وعندما يكون الاتجاه هابط يجب ان يكون سعر النهاية ادنى من سعر البداية .
ملاحظة هامة : هذا المؤشر يعتمد على خبرتك في الدورات الزمنية ولن يعطيك اي اشارات شراء او بيع فهو مؤشر يوفر عليك الرسم للدورات والبوابات ويعتمد على خبرتك الشخصية في الدورات الزمنية .
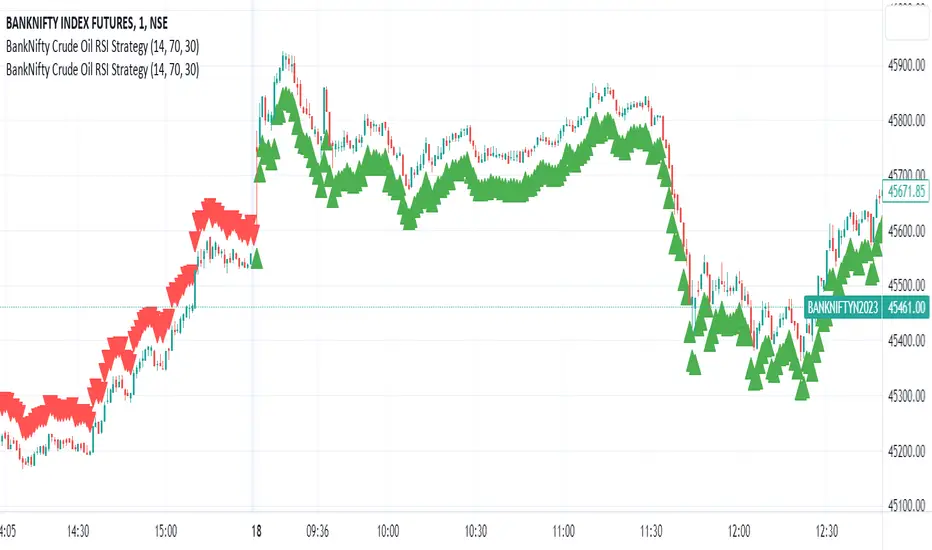
BankNifty Crude Oil RSI Strategy
The "BankNifty Crude Oil RSI Strategy" is a trading strategy that combines the BankNifty index with the WTI Crude Oil price index using the Relative Strength Index (RSI) as the primary indicator. The strategy aims to generate buy and sell signals based on the RSI of the Crude Oil price index, which might influence the BankNifty index.
Here's how the strategy works step by step:
Data Fetching:
The strategy fetches the daily closing prices of WTI Crude Oil from the provided TradingView link "TVC:USOIL" using the request.security function.
RSI Calculation:
The Relative Strength Index (RSI) is calculated using the closing prices of WTI Crude Oil. The RSI is a momentum oscillator that measures the speed and change of price movements. It oscillates between 0 and 100, indicating overbought conditions when above a specified threshold (overbought level) and oversold conditions when below a specified threshold (oversold level).
Buy and Sell Conditions:
The strategy defines two conditions based on the RSI values:
Buy Signal: When the Crude Oil RSI falls below a specified rsiOversold level (default is 30), the strategy generates a buy signal. This implies that the Crude Oil is in an oversold condition, and there might be a potential buying opportunity in the BankNifty index.
Sell Signal: When the Crude Oil RSI rises above a specified rsiOverbought level (default is 70), the strategy generates a sell signal. This implies that the Crude Oil is in an overbought condition, and there might be a potential selling opportunity in the BankNifty index.
Buy and Sell Signal Visualization:
The strategy uses the plotshape function to plot triangular shapes (upward for buy and downward for sell) below and above the price bars, respectively, to indicate the buy and sell signals on the chart visually.
EMA Envelope - Signal with Stoploss and Takeprofit LevelsDescription:
This Pine Script indicator implements the EMA Envelope strategy, which utilizes Exponential Moving Averages (EMA) to create an envelope around the price chart. The strategy generates buy and sell signals based on the crossing of the price above and below the upper and lower EMA envelopes, respectively. It also incorporates additional features such as stop-loss and take-profit levels for risk management.
Indicator Settings:
EMA Length: Specifies the period for the short-term Exponential Moving Average.
Long Term EMA Length: Defines the period for the long-term Exponential Moving Average used for signal filtering.
Take Profit Ratio: Determines the ratio for calculating the take-profit levels based on the stop-loss.
Filter Signal on Long Term EMA: Enables or disables the filtering of buy/sell signals using the long-term EMA.
Show only recent signal: When enabled, shows only the most recent buy/sell signals.
Buy and Sell Signals:
The indicator generates buy signals when the price crosses above the upper EMA envelope and the previous low was below the upper EMA envelope. Additionally, you can choose to filter buy signals based on whether the closing price is above the long-term EMA.
Conversely, sell signals are generated when the price crosses below the lower EMA envelope, and the previous high was above the lower EMA envelope. Similar to buy signals, sell signals can also be filtered using the long-term EMA.
Note: Signal works well on Higher Timeframes like Daily/8hrs/4hrs/1hr.
Stop-Loss and Take-Profit Levels:
For buy signals, the stop-loss is set at the lower EMA level, while the take-profit level is calculated by adding a specified ratio of the difference between the low and the stop-loss level to the low price.
For sell signals, the stop-loss is set at the upper EMA level, and the take-profit level is calculated by subtracting a specified ratio of the difference between the stop-loss level and the high price from the high price.
Disclaimer:
This indicator is provided for educational and informational purposes only. Trading involves significant risk, and past performance does not guarantee future results. Users are solely responsible for their trading decisions and should conduct their own research and risk management. The author shall not be held liable for any losses or damages arising from the use of this indicator.
Note: Always test the indicator thoroughly on historical data and consider paper trading before applying it to live trading environments.

kyle algo v1
Integration of multiple technical indicators: The strategy mainly combines two technical indicators - Keltner Channels and Supertrend, to generate trading signals. It also calculates fifteen exponential moving averages (EMAs) for the high price with different periods ranging from 9 to 51.
Unique combination of indicators: The traditional Supertrend typically uses Average True Range (ATR) to calculate its upper and lower bands. In contrast, this script modifies the approach to use Keltner Channels instead.
Flexible sensitivity adjustment: This strategy provides a "sensitivity" input parameter for users to adjust, which controls the multiplier for the range in the Supertrend calculation. This can make the signals more or less sensitive to price changes, allowing users to tailor the strategy to their own risk tolerance and trading style.
EMA Energy Representation: The code offers a visualization of "EMA Energy", which color-codes the EMA lines based on whether the closing price is above or below the EMA line. This can provide an intuitive understanding of market trends.
Clear visual signals: The strategy generates clear "BUY" and "SELL" signals, represented as labels on the chart. This makes it easy to identify potential entry and exit points in the market.
Customizable: The script provides several user inputs, making it possible to fine-tune the strategy according to different market conditions and individual trading preferences.
EMA (Exponential Moving Average) Principle:
The EMA is a type of moving average that assigns more weight to the most recent data.
It responds more quickly to recent price changes and is used to capture short-term price trends.
Principle of Color Change :
In this trading strategy, the color of the EMA line changes based on whether the closing price is above or below the EMA. If the closing price is above the EMA, the EMA line turns green,
indicating an upward price trend. Conversely, if the closing price is below the EMA, the EMA line turns red,
indicating a downward price trend. These color changes help traders to more intuitively identify price trends
In short, our team provides a lot of practical space
That is your development space
