Fair Value Gap Signals [Kodexius]Fair Value Gap Signals is an advanced market structure tool that automatically detects and tracks Fair Value Gaps (FVGs), evaluates the quality of each gap, and highlights high value reaction zones with visual metrics and signal markers.
The script is designed for traders who focus on liquidity concepts, order flow and mean reversion. It goes beyond basic FVG plotting by continuously monitoring how price interacts with each gap and by quantifying three key aspects of each zone:
-Entry velocity inside the gap
-Volume absorption during tests
-Structural integrity and depth of penetration
The result is a dynamic, information rich visualization of which gaps are being respected, which are being absorbed, and where potential reversals or continuations are most likely to occur.
All visual elements are configurable, including the maximum number of visible gaps per direction, mitigation method (close or wick) and an ATR based filter to ignore insignificant gaps in low volatility environments.
🔹 Features
🔸 Automated Fair Value Gap Detection
The script detects both bullish and bearish FVGs based on classic three candle logic:
Bullish FVG: current low is strictly above the high from two bars ago
Bearish FVG: current high is strictly below the low from two bars ago
🔸 ATR Based Gap Filter
To avoid clutter and low quality signals, the script can ignore very small gaps using an ATR based filter.
🔸Per Gap State Machine and Lifecycle
Each gap is tracked with an internal status:
Fresh: gap has just formed and has not been tested
Testing: price is currently trading inside the gap
Tested: gap was tested and left, waiting for a potential new test
Rejected: price entered the gap and then rejected away from it
Filled: gap is considered fully mitigated and no longer active
This state machine allows the script to distinguish between simple touches, multiple tests and meaningful reversals, and to trigger different alerts accordingly.
🔸 Visual Ranking of Gaps by Metrics
For each active gap, three additional horizontal rank bars are drawn on top of the gap area:
Rank 1 (Vel): maximum entry velocity inside the gap
Rank 2 (Vol): relative test volume compared to average volume
Rank 3 (Dpt): remaining safety of the gap based on maximum penetration depth
These rank bars extend horizontally from the creation bar, and their length is a visual score between 0 and 1, scaled to the age of the gap. Longer bars represent stronger or more favorable conditions.
🔸Signals and Rejection Markers
When a gap shows signs of rejection (price enters the gap and then closes away from it with sufficient activity), the script can print a signal label at the reaction point. These markers summarize the internal metrics of the gap using a tooltip:
-Velocity percentage
-Volume percentage
-Safety score
-Number of tests
🔸 Flexible Mitigation Logic (Close or Wick)
You can choose how mitigation is defined via the Mitigation Method input:
Close: the gap is considered filled only when the closing price crosses the gap boundary
Wick: a full fill is detected as soon as any wick crosses the gap boundary
🔸 Alert Conditions
-New FVG formed
-Price entering a gap (testing)
-Gap fully filled and invalidated
-Rejection signal generated
🔹Calculations
This section summarizes the main calculations used under the hood. Only the core logic is covered.
1. ATR Filter and Gap Size
The script uses a configurable ATR length to filter out small gaps. First the ATR is computed:
float atrVal = ta.atr(atrLength)
Gap size for both directions is then measured:
float gapSizeBull = low - high
float gapSizeBear = low - high
If useAtrFilter is enabled, gaps smaller than atrVal are ignored. This ties the minimum gap size to the current volatility regime.
2. Fair Value Gap Detection
The basic FVG conditions use a three bar structure:
bool fvgBull = low > high
bool fvgBear = high < low
For bullish gaps the script stores:
-top as low of the current bar
-bottom as high
For bearish gaps:
-top as high of the current bar
-bottom as low
This defines the price range that is considered the imbalance area.
3. Depth and Safety Score
Depth measures how far price has penetrated into the gap since its creation. For each bar, the script computes a currentDepth and updates the maximum depth:
float currentDepth = 0.0
if g.isBullish
if l < g.top
currentDepth := g.top - l
else
if h > g.bottom
currentDepth := h - g.bottom
if currentDepth > g.maxDepth
g.maxDepth := currentDepth
The safety score expresses how much of the gap remains intact:
float depthRatio = g.maxDepth / gapSize
float safetyScore = math.max(0.0, 1.0 - depthRatio)
safetyScore near 1: gap is mostly untouched
safetyScore near 0: gap is mostly or fully filled
4. Velocity Metric
Velocity captures how aggressively price moves inside the gap. It is based on the body to range ratio of each bar that trades within the gap and rewards bars that move in the same direction as the gap:
float barRange = h - l
float bodyRatio = math.abs(close - open) / barRange
float directionBonus = 0.0
if g.isBullish and close > open
directionBonus := 0.2
else if not g.isBullish and close < open
directionBonus := 0.2
float currentVelocity = math.min(bodyRatio + directionBonus, 1.0)
The gap keeps track of the strongest observed value:
if currentVelocity > g.maxVelocity
g.maxVelocity := currentVelocity
This maximum is later used as velScore when building the velocity rank bar.
5. Volume Accumulation and Volume Score
While price is trading inside a gap, the script accumulates the traded volume:
if isInside
g.testVolume += volume
It also keeps track of the number of tests and the volume at the start of the first test:
if g.status == "Fresh"
g.status := "Testing"
g.testCount := 1
g.testStartVolume := volume
An average volume is computed using a 20 period SMA:
float volAvg = ta.sma(volume, 20)
The expected volume is approximated as:
float expectedVol = volAvg * math.max(1, (bar_index - g.index) / 2)
The volume score is then:
float volScore = math.min(g.testVolume / expectedVol, 1.0)
This produces a normalized 0 to 1 metric that shows whether the gap has attracted more or less volume than expected over its lifetime.
6. Rank Bar Scaling
All three scores are projected visually along the time axis as horizontal bars. The script uses the age of the gap in bars as the maximum width:
float maxWidth = math.max(bar_index - g.index, 1)
Then each metric is mapped to a bar length:
int len1 = int(math.max(1, maxWidth * velScore))
g.rankBox1.set_right(g.index + len1)
int len2 = int(math.max(1, maxWidth * volScore))
g.rankBox2.set_right(g.index + len2)
int len3 = int(math.max(1, maxWidth * safetyScore))
g.rankBox3.set_right(g.index + len3)
This creates an intuitive visual representation where stronger metrics produce longer rank bars, making it easy to quickly compare the relative quality of multiple FVGs on the chart.
在脚本中搜索"track"

Session Open Range, Breakout & Trap Framework - TrendPredator OBSession Open Range, Breakout & Trap Framework — TrendPredator Open Box
Stacey Burke’s trading approach combines concepts from George Douglas Taylor, Tony Crabel, Steve Mauro, and Robert Schabacker. His framework focuses on reading price behaviour across daily templates and identifying how markets move through recurring cycles of expansion, contraction, and reversal. While effective, much of this analysis requires real-time interpretation of session-based behaviour, which can be demanding for traders working on lower intraday timeframes.
The TrendPredator indicators formalize parts of this methodology by introducing mechanical rules for multi-timeframe bias tracking and session structure analysis. They aim to present the key elements of the system—bias, breakouts, fakeouts, and range behaviour—in a consistent and objective way that reduces discretionary interpretation.
The Open Box indicator focuses specifically on the opening behaviour of major trading sessions. It builds on principles found in classical Open Range Breakout (ORB) techniques described by Tony Crabel, where a defined time window around the session open forms a structural reference range. Price behaviour relative to this range—breaking out, failing back inside, or expanding—can highlight developing session bias, potential trap formation, and directional conviction.
This indicator applies these concepts throughout the major equity sessions. It automatically maps the session’s initial range (“Open Box”) and tracks how price interacts with it as liquidity and volatility increase. It also incorporates related structural references such as:
* the first-hour high and low of the futures session
* the exact session open level
* an anchored VWAP starting at the session open
* automated expansion levels projected from the Open Box
In combination, these components provide a unified view of early session activity, including breakout attempts, fakeouts, VWAP reactions, and liquidity targeting. The Open Box offers a structured lens for observing how price transitions through the major sessions (Asia → London → New York) and how these behaviours relate to higher-timeframe bias defined in the broader TrendPredator framework.
Core Features
Open Box (Session Structure)
The indicator defines an initial session range beginning at the selected session open. This “Open Box” represents a fixed time window—commonly the first 30 minutes, or any user-defined duration—that serves as a structural reference for analysing early session behaviour.
The range highlights whether price remains inside the box, breaks out, or rejects the boundaries, providing a consistent foundation for interpreting early directional tendencies and recognising breakout, continuation, or fakeout characteristics.
How it works:
* At the session open, the indicator calculates the high and low over the specified time window.
* This range is plotted as the initial structure of the session.
* Price behaviour at the boundaries can illustrate emerging bias or potential trap formation.
* An optional secondary range (e.g., 15-minute high/low) can be enabled to capture early volatility with additional precision.
Inputs / Options:
* Session specifications (Tokyo, London, New York)
* Open Box start and end times (e.g., equity open + first 30 minutes, or any custom length)
* Open Box colour and label settings
* Formatting options for Open Box high and low lines
* Optional secondary range per session (e.g., 15-minute high/low)
* Forward extension of Open Box high/low lines
* Number of historic Open Boxes to display
Session VWAPs
The indicator plots VWAPs for each major trading session—Asia, London, and New York—anchored to their respective session opens. These session-specific VWAPs assist in tracking how value develops through the day and how price interacts with session-based volume distributions.
How it works:
* At each session open, a VWAP is anchored to the open price.
* The VWAP updates throughout the session as new volume and price data arrive.
* Deviations above or below the VWAP may indicate balance, imbalance, or directional control.
* Viewed together, session VWAPs help identify transitions in value across sessions.
Inputs / Options:
* Enable or disable VWAP per session
* Adjustable anchor and end times (optionally to end of day)
* Line styling and label settings
* Number of historic VWAPs to draw
First Hour High/Low Extensions
The indicator marks the high and low formed during the first hour of each session. These reference points often function as early control levels and provide context for assessing whether the session is establishing bias, consolidating, or exhibiting reversal behaviour.
How it works:
* After the session starts, the indicator records the highest and lowest prices during the first hour.
* These levels are plotted and extended across the session.
* They provide a visual reference for observing reactions, targets, or rejection zones.
Inputs / Options:
* Enable or disable for each session
* Line style, colour, and label visibility
* Number of historic sessions displayed
EQO Levels (Equity Open)
The indicator plots the opening price of each configured session. These “Equity Open” levels represent short-term reference points that can attract price early in the session.
Once the level is revisited after the Open Box has formed, it is automatically cut to avoid clutter. If not revisited, the line remains as an untested reference, similar to a naked point of control.
How it works:
* At session open, the open price is recorded.
* The level is plotted as a local reference.
* If price interacts with the level after the Open Box completes, the line is cut.
* Untested EQOs extend forward until interacted with.
Inputs / Options:
* Enable/disable per session
* Line style and label settings
* Optional extension into the next day
* Option for cutting vs. hiding on revisit
* Number of historic sessions displayed
OB Range Expansions (Automatic)
Range expansions are calculated from the height of the Open Box. These levels provide structured reference zones for identifying potential continuation or exhaustion areas within a session.
How it works:
* After the Open Box is formed, multiples of the range (e.g., 1×, 2×, 3×) are projected.
* These expansion levels are plotted above and below the range.
* Price reactions near these areas can illustrate continuation, hesitation, or potential reversal.
Inputs / Options:
* Enable or disable per session
* Select number of multiples
* Line style, colour, and label settings
* Extension length into the session
Stacey Burke 12-Candle Window Marker
The indicator can highlight the 12-candle window often referenced in Stacey Burke’s session methodology. This window represents the key active period of each session where breakout attempts, volatility shifts, and reversal signatures often occur.
How it works:
* A configurable window (default 12 candles) is highlighted from each session open.
* This window acts as a guide for observing active session behaviour.
* It remains visible throughout the session for structural context.
Inputs / Options:
* Enable/disable per session
* Configurable window duration (default: 3 hours)
* Colour and transparency controls
Concept and Integration
The Open Box is built around the same multi-timeframe logic that underpins the broader TrendPredator framework.
While higher-timeframe tools track bias and setups across the H8–D–W–M levels, the Open Box focuses on the H1–M30 domain to define session structure and observe how early intraday behaviour aligns with higher-timeframe conditions.
The indicator integrates with the TrendPredator FO (Breakout, Fakeout & Trend Switch Detector), which highlights microstructure signals on lower timeframes (M15/M5). Together they form a layered workflow:
* Higher timeframes: context, bias, and developing setups
* TrendPredator OB: intraday and intra-session structure
* TrendPredator FO: microstructure confirmation (e.g., FOL/FOH, switches)
This alignment provides a structured way to observe how daily directional context interacts with intraday behaviour.
See the public open source indicator TP FO here (click on it for access):
Practical Application
Before Session Open
* Review previous session Open Box, Open level, and VWAPs
* Assess how higher-timeframe bias aligns with potential intraday continuation or reversal
* Note untested EQO levels or VWAPs that may function as liquidity attractors
During Session Open
* Observe behaviour around the first-hour high/low and higher-timeframe reference levels
* Monitor how the M15 and 30-minute ranges close
* Track reactions relative to the session open level and the session VWAP
After the Open Box completes
* Assess price interaction with Open Box boundaries and first-hour levels
* Use microstructure signals (e.g., FOH/FOL, switches) for potential confirmation
* Refer to expansion levels as reference zones for management or target setting
After Session
* Review how price behaved relative to the Open Box, EQO levels, VWAPs, and expansion zones
* Analyse breakout attempts, fakeouts, and whether intraday structure aligned with the broader daily move
Example Workflow and Trade
1. Higher-timeframe analysis signals a Daily Fakeout Low Continuation (bullish context).
2. The New York session forms an Open Box; price breaks above and holds above the first-hour high.
3. A Fakeout Low + Switch Bar appears on M5 (via FO), after retesting the session VWAP triggering the entry.
4. 1x expansion level serves as reference targets for take profit.
Relation to the TrendPredator Ecosystem
The Open Box is part of the TrendPredator Indicator Family, designed to apply multi-timeframe logic consistently across:
* higher-timeframe context and setups
* intraday and session structure (OB)
* microstructure confirmation (FO)
Together, these modules offer a unified structure for analysing how daily and intraday cycles interact.
Disclaimer
This indicator is for educational purposes only and does not guarantee profits.
It does not provide buy or sell signals but highlights structural and behavioural areas for analysis.
Users are solely responsible for their trading decisions and outcomes.

BTC CME Gaps Detector [SwissAlgo]BTC CME Gaps Detector
Track Unfilled Gaps & Identify Price Magnets
------------------------------------------------------
Overview
The BTC CME Gap Detector identifies and tracks unfilled price gaps on any timeframe (1-minute recommended for scalping) to gauge potential trading bias.
Verify Gap Behavior Yourself : Use TradingView's Replay Mode on the 1-Minute chart to observe how the price interacts with gaps. Load the BTC1! ticker (Bitcoin CME Futures), enable Replay Mode, and play forward through time (for example: go back 15 days). You may observe patterns such as price frequently returning to fill gaps, nearest gaps acting as near-term targets, and gaps serving as potential support/resistance zones. Some gaps may fill quickly, while others may remain open for longer periods. This hands-on analysis lets you independently assess how gaps may influence price movement in real market conditions and whether you may use this indicator as a complement to your trading analysis.
------------------------------------------------------
Purpose
Price gaps occur when there is a discontinuity between consecutive candles - when the current candle's low is above the previous candle's high (gap up), or when the current candle's high is below the previous candle's low (gap down).
This indicator identifies and tracks these gaps on any timeframe to help traders:
Identify gap zones that may attract price (potential "price magnets")
Monitor gap fill progression
Assess potential directional bias based on nearest unfilled gaps (long, short)
Analyze market structure and liquidity imbalances
------------------------------------------------------
Why Use This Indicator?
Universal Gap Detection : Identifies all gaps on any timeframe (1-minute, hourly, daily, etc.)
Multi-Candle Mitigation Tracking : Detects gap fills that occur across multiple candles
Distance Analysis : Shows percentage distance to nearest bullish and bearish gaps
Visual Representation : Color-coded boxes indicate gap status (active vs. mitigated)
Age Filtering : Option to display only gaps within specified time periods (3/6/12/24 months), as older gaps may lose relevance
ATR-Based Sizing : Minimum gap size adjusts to instrument volatility to filter noise (i.e. small gaps)
------------------------------------------------------
Trading Concept
Gaps represent price zones where no trading occurred. Historical market behavior suggests that unfilled gaps may attract price action as markets tend to revisit areas of incomplete price discovery. This phenomenon creates potential trading opportunities:
Bullish gaps (above current price) may act as upside targets where the price could move to fill the gap
Bearish gaps (below current price) may act as downside targets where price could move to fill the gap
The nearest gap often provides directional bias, as closer gaps may have a higher probability of being filled in the near term
This indicator helps quantify gap proximity and provides a visual reference for these potential target zones.
EXAMPLE
Step 1: Bearish Gaps Appear Below Price
Step 2: Price Getting Close to Fill Gap
Step 3: Gap Mitigated Gap
------------------------------------------------------
Recommended Setup
Timeframe: 1-minute chart recommended for maximum gap detection frequency. Works on all timeframes (higher timeframes will show fewer, larger gaps).
Symbol: Any tradable instrument. Originally designed for BTC1! (CME Bitcoin Futures) but compatible with all symbols.
Settings:
ATR Length: 14 (default)
Min Gap Size: 0.5x ATR (adjust based on timeframe and noise level)
Gap Age Limit: 3 months (configurable)
Max Historical Gaps: 300 (adjustable 1-500)
------------------------------------------------------
How It Works
Gap Detection : Identifies price discontinuities on every candle where:
Gap up: current candle low > previous candle high
Gap down: current candle high < previous candle low
Minimum gap size filter (ATR-based) eliminates insignificant gaps
Mitigation Tracking : Monitors when price touches both gap boundaries. A gap is marked as filled when the price has touched both the top and bottom of the gap zone, even if this occurs across multiple candles.
Visual Elements :
Green boxes: Unfilled gaps above current price (potential bullish targets)
Red boxes: Unfilled gaps below current price (potential bearish targets)
Gray boxes: Filled gaps (historical reference)
Labels: Display gap type, price level, and distance percentage
Analysis Table: Shows :
Distance % to nearest bullish gap (above price)
Distance % to nearest bearish gap (below price)
Trade bias (LONG if nearest gap is above, SHORT if nearest gap is below)
------------------------------------------------------
Key Features
Detects gaps on any timeframe (1m, 5m, 1h, 1D, etc.)
Boxes extend 500 bars forward for active gaps, stop at the fill bar for mitigated gaps
Real-time distance calculations update on every candle
Configurable age filter removes outdated gaps
ATR multiplier ensures gap detection adapts to market volatility and timeframe
------------------------------------------------------
Disclaimer
This indicator is provided for informational and educational purposes only.
It does not constitute financial advice, investment recommendations, or trading signals. The concept that gaps attract price is based on historical observation and does not guarantee future results.
Gap fills are not certain - gaps may remain unfilled indefinitely, or the price may reverse before reaching a gap. This indicator should not be used as the sole basis for trading decisions.
All trading involves substantial risk, including the potential loss of principal. Users should conduct their own research, apply proper risk management, test strategies thoroughly, and consult with qualified financial professionals before making trading decisions.
The authors and publishers are not responsible for any losses incurred through the use of this indicator.

Adaptive Trend Breaks Adaptive Trend Breaks
## WHAT IT DOES
This script is a modified and enhanced version of "Trendline Breakouts With Targets" concept by ChartPrime.
Adaptive Trend Breaks (ATB) is a trendline breakout system optimized for scalping liquid futures contracts. The indicator automatically draws dynamic support and resistance trendlines based on pivot points, then generates trade signals when price breaks through these levels with confirmation filters. It includes automated target and stop-loss placement with real-time P&L tracking in dollars.
## HOW IT WORKS
**Trendline Detection Method:**
The indicator uses pivot high/low detection to identify significant price turning points. When a new pivot forms, it calculates the slope between consecutive pivots to draw dynamic trendlines. These lines extend forward based on the established trend angle, creating actionable support and resistance zones.
**Band System:**
Around each trendline, the script creates a "band" using a volatility-adjusted calculation: `ATR(14) * 0.2 * bandwidth multiplier / 2`. This adaptive band accounts for current market conditions - wider during volatile periods, tighter during quiet markets.
**Breakout Logic:**
A breakout signal triggers when:
1. Price closes beyond the trendline + band zone
2. Volume exceeds the 20-period moving average by your set multiplier (default 1.2x)
3. Price is within Regular Trading Hours (9:30-16:00 EST) if session filter enabled
4. Current ATR meets minimum volatility threshold (prevents trading dead markets)
**Target & Stop Calculation:**
Upon breakout confirmation:
- **Entry**: Trendline breach point
- **Target**: Entry ± (bandwidth × target multiplier) - default 8x for quick scalps
- **Stop**: Entry ± (bandwidth × stop multiplier) - default 8x for 1:1 risk/reward
- Multipliers adjust automatically to market volatility through the ATR-based band
**P&L Conversion:**
The script converts point movements to dollars using:
```
Dollar P&L = (Price Points × Contract Point Value × Quantity)
```
For example, a 10-point NQ move with 2 contracts = 10 × $20 × 2 = $400
## HOW TO USE IT
**Setup:**
1. Select your instrument (NQ/ES/YM/RTY) - point values auto-configure
2. Set contract quantity for accurate dollar P&L
3. Choose pivot period (lower = more signals but more noise, default 5 for scalping)
4. Adjust bandwidth multiplier if trendlines are too tight/loose (1-5 range)
**Filters Configuration:**
- **Volume Filter**: Requires breakout volume > moving average × multiplier. Increase multiplier (1.5-2.0) for higher conviction trades
- **Session Filter**: Enable to trade only RTH. Disable for 24-hour trading
- **ATR Filter**: Prevents signals during low volatility. Increase minimum % for more active markets only
**Risk Management:**
- Set target/stop multipliers based on your risk tolerance
- 8x bandwidth = approximately 1:1 risk/reward for most liquid futures
- Enable trailing stops for trend-following approach (moves stop to protect profits)
- Adjust line length to see targets further into the future
**Statistics Table:**
- Choose timeframe to analyze: all-time, today, this week, custom days
- Monitor win rate, profit factor, and net P&L in dollars
- Track long vs short performance separately
- See real-time unrealized P&L on active trades
**Reading Signals:**
- **Green triangle below bar** = Long breakout (resistance broken)
- **Red triangle above bar** = Short breakout (support broken)
- **White dashed line** = Entry price
- **Orange line** = Take profit target with dollar value
- **Red line** = Stop loss with dollar value
- **Green checkmark (✓)** = Target hit, winning trade
- **Red X (✗)** = Stop hit, losing trade
## WHAT IT DOES NOT DO
**Limitations to Understand:**
- Does not predict future trendline formations - it reacts to breakouts after they occur
- Historical trendlines disappear after breakout (not kept on chart for clarity)
- Requires sufficient volatility - may not signal in extremely quiet markets
- Volume filter requires exchange volume data (not available on all symbols)
- Statistics are indicator-based simulations, not actual trading results
- Does not account for slippage, commissions, or order fills
## BEST PRACTICES
**Recommended Settings by Market:**
- **NQ (Nasdaq)**: Default settings work well, consider volume multiplier 1.3-1.5
- **ES (S&P 500)**: Slightly slower, try period 7-8, volume 1.2
- **YM (Dow)**: Lower volatility, reduce bandwidth to 1.5-2
- **RTY (Russell)**: Higher volatility, increase bandwidth to 3-4
**Risk Management:**
- Never risk more than 2-3% of account per trade
- Use contract quantity calculator: Max Risk $ ÷ (Stop Distance × Point Value)
- Start with 1 contract while learning the system
- Backtest your specific timeframe and instrument before live trading
**Optimization Tips:**
- Increase pivot period (7-10) for fewer but higher-quality signals
- Raise volume multiplier (1.5-2.0) in choppy markets
- Lower target/stop multipliers (5-6x) for tighter profit taking
- Use trailing stops in strong trending conditions
- Disable session filter for overnight gaps and Asia session moves
## TECHNICAL DETAILS
**Key Calculations:**
- Pivot Detection: `ta.pivothigh(high, period, period/2)` and `ta.pivotlow(low, period, period/2)`
- Slope Calculation: `(newPivot - oldPivot) / (newTime - oldTime)`
- Adaptive Band: `min(ATR(14) * 0.2, close * 0.002) * multiplier / 2`
- Breakout Confirmation: Price crosses trendline + 10% of band threshold
**Data Requirements:**
- Minimum bars in view: 500 for proper pivot calculation
- Volume data required for volume filter accuracy
- Intraday timeframes recommended (1min - 15min) for scalping
- Works on any timeframe but optimized for fast execution
**Performance Metrics:**
All statistics calculate based on indicator signals:
- Tracks every signal as a trade from entry to TP/SL
- P&L in actual contract dollar values
- Win rate = (Winning trades / Total trades) × 100
- Profit factor = Gross profit / Gross loss
- Separates long/short performance for bias analysis
## IDEAL FOR
- Futures scalpers and day traders
- Traders who prefer visual trendline breakouts
- Those wanting automated TP/SL placement
- Traders tracking performance in dollar terms
- Multiple timeframe analysis (compare 1min vs 5min signals)
## NOT SUITABLE FOR
- Swing trading (targets too close)
- Stocks/forex without modifying point values
- Extremely low timeframes (<30 seconds) - too much noise
- Markets without volume data if using volume filter
- Illiquid contracts (signals may not execute at shown prices)
---
**Settings Summary:**
- Core: Period, bandwidth, extension, trendline style
- Filters: Volume, RTH session, ATR volatility
- Risk: R:R ratio, target/stop multipliers, trailing stop
- Display: Stats table position, size, colors
- Stats: Timeframe selection (all-time to custom days)
**License:** This indicator is published open-source under Mozilla Public License 2.0. You may use and modify the code with proper attribution.
**Disclaimer:** This indicator is for educational purposes. Past performance does not guarantee future results. Always practice proper risk management and test thoroughly before live trading.
---
## CREDITS & ATTRIBUTION
This script builds upon the "Trendline Breakouts With Targets" concept by ChartPrime with significant enhancements:
**Major Improvements Added:**
- **Futures-Specific Calculations**: Automated dollar P&L conversion using actual contract point values (NQ=$20, ES=$50, YM=$5, RTY=$50)
- **Advanced Statistics Engine**: Comprehensive performance tracking with customizable timeframe analysis (today, week, month, custom ranges)
- **Multi-Layer Filtering System**: Volume confirmation, RTH session filter, and ATR volatility filter to reduce false signals
- **Professional Trade Management**: Enhanced visual trade tracking with separate TP/SL lines, dollar value labels, and optional trailing stops
- **Optimized for Scalping**: Faster pivot periods (5 vs 10), tighter bands, and reduced extension bars for quick entries
Original trendline detection methodology by ChartPrime - used with modification under Mozilla Public License 2.0.

Macro & Earnings Dashboard — NY Fed CalendarMacro & Earnings Dashboard — NY Fed Calendar
This is an overlay indicator designed to provide a quick, real-time overview of the most critical upcoming US economic data releases and corporate earnings reports directly on your TradingView chart. It functions as a dynamic dashboard, removing the need to constantly check external calendars.
Key Features
1. Real-Time Economic Calendar (Bottom-Right Table)
The dashboard tracks the time remaining until the next release of five major, high-impact economic indicators. The data for these dates is pre-loaded directly from the New York Fed Economic Indicators Calendar (currently loaded for October through December 2025).
The tracked events include:
CPI (Consumer Price Index)
PPI (Producer Price Index)
Employment Situation (Non-Farm Payrolls / Unemployment Rate)
Interest Rate Decision (FOMC Meetings)
Consumer Sentiment (University of Michigan Survey)
2. Corporate Earnings Tracker (Top-Right Table)
This table uses TradingView's built-in data to calculate the estimated days remaining until the next Earnings Per Share (EPS) report for a curated list of high-profile NASDAQ tickers:
AAPL, NVDA, GOOG, TSLA, MSFT, AMZN, META
3. Color-Coded Urgency
The "Days" column for both macro and earnings tables uses a traffic light system to instantly communicate how soon the event is:
Red: The event is scheduled for Today or Tomorrow (0–1 day away).
Orange: The event is scheduled for the current week (within 6 days).
Teal: The event is more than a week away.
Gray: The date is currently unavailable or outside the loaded calendar range.

Auto FaustAuto Faust – Intraday Market Context & Structure
Auto Faust is a visual market overlay designed for intraday traders who want fast context without relying on signals or automation. It combines classic price tools — VWAP, EMAs, RSI, Chop Score, and market structure trendlines — into a single glanceable dashboard.
🔍 What It Does:
VWAP (Volume Weighted Average Price): Shows the day's fair value price anchor.
EMAs (3, 21, 113, 200): Map short-term to long-term trend alignment. Crossovers can be used for confluence or caution.
RSI (10): Monitors local momentum. Displayed in a compact table.
Chop Score: Measures how directional price action is. High chop = ranging conditions; low = trending.
Session High/Low Tracker: Tracks the daily extremes in real-time.
Volume Monitor: Shows current candle volume, color-coded vs previous bar (green = higher, red = lower).
Dynamic Support & Resistance Lines: Plotted from pivot highs/lows (not static levels).
Automatic Trendlines: Drawn from swing structure, updating live.
📊 How to Use:
Use EMAs + VWAP alignment to assess directional bias.
Confirm clean trends with low Chop Score and RSI support.
Watch for price interaction around dynamic S/R lines and trendline breaks.
Use volume coloring to assess if momentum is increasing or fading.
No buy/sell signals are generated — this is a trader-facing tool to guide discretionary decision-making.

Seasonality DOW CombinedOverall Purpose
This script analyzes historical daily returns based on two specific criteria:
Month of the year (January through December)
Day of the week (Sunday through Saturday)
It summarizes and visually displays the average historical performance of the selected asset by these criteria over multiple years.
Step-by-Step Breakdown
1. Initial Settings:
Defines minimum year (i_year_start) from which data analysis will start.
Ensures the user is using a daily timeframe, otherwise prompts an error.
Sets basic display preferences like text size and color schemes.
2. Data Collection and Variables:
Initializes matrices to store and aggregate returns data:
month_data_ and month_agg_: store monthly performance.
dow_data_ and dow_agg_: store day-of-week performance.
COUNT tracks total number of occurrences, and COUNT_POSITIVE tracks positive-return occurrences.
3. Return Calculation:
Calculates daily percentage change (chg_pct_) in price:
chg_pct_ = close / close - 1
Ensures it captures this data only for the specified years (year >= i_year_start).
4. Monthly Performance Calculation:
Each daily return is grouped by month:
matrix.set updates total returns per month.
The script tracks:
Monthly cumulative returns
Number of occurrences (how many days recorded per month)
Positive occurrences (days with positive returns)
5. Day-of-Week Performance Calculation:
Similarly, daily returns are also grouped by day-of-the-week (Sunday to Saturday):
Daily return values are summed per weekday.
The script tracks:
Cumulative returns per weekday
Number of occurrences per weekday
Positive occurrences per weekday
6. Visual Display (Tables):
The script creates two visual tables:
Left Table: Monthly Performance.
Right Table: Day-of-the-Week Performance.
For each table, it shows:
Yearly data for each month/day.
Summaries at the bottom:
SUM row: Shows total accumulated returns over all selected years for each month/day.
+ive row: Shows percentage (%) of times the month/day had positive returns, along with a tooltip displaying positive occurrences vs total occurrences.
Cells are color-coded:
Green for positive returns.
Red for negative returns.
Gray for neutral/no change.
7. Interpreting the Tables:
Monthly Table (left side):
Helps identify seasonal patterns (e.g., historically bullish/bearish months).
Day-of-Week Table (right side):
Helps detect recurring weekday patterns (e.g., historically bullish Mondays or bearish Fridays).
Practical Use:
Traders use this to:
Identify patterns based on historical data.
Inform trading strategies, e.g., avoiding historically bearish days/months or leveraging historically bullish periods.
Example Interpretation:
If the table shows consistently green (positive) for March and April, historically the asset tends to perform well during spring. Similarly, if the "Friday" column is often red, historically Fridays are bearish for this asset.

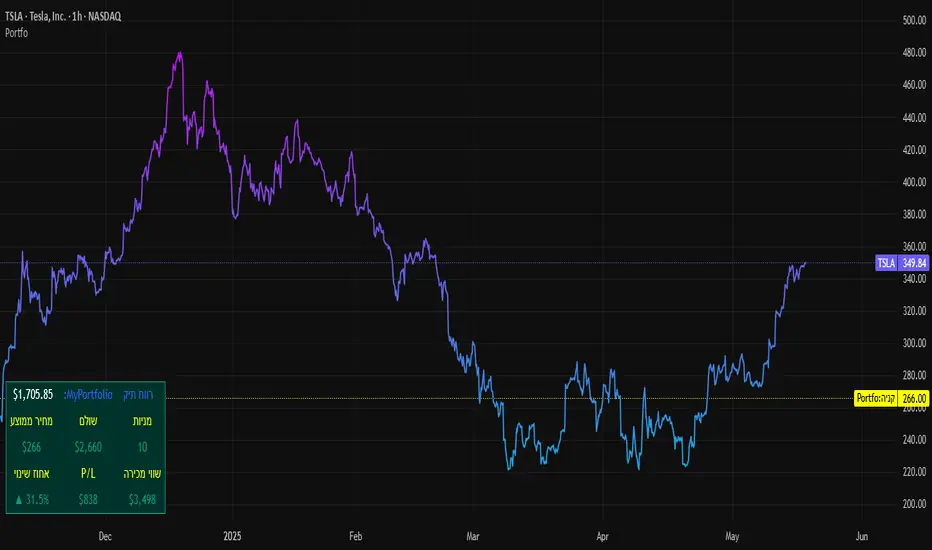
SBC ProtfoSBC Portfo PNL Indicator
Description
The SBC Portfo PNL Indicator is a user-friendly tool designed for Hebrew-speaking traders to track the Profit and Loss (PNL) of their stock portfolios on TradingView charts. It supports up to 5 distinct portfolios, each capable of holding an unlimited number of stocks with unlimited buy commands, allowing real-time monitoring of portfolio performance.
Key Features
- Multi-Portfolio Support: Track up to 5 separate portfolios for different trading strategies or accounts.
- Unlimited Stock Entries: Add unlimited stocks and buy commands per portfolio.
- Detailed Buy Commands: Input for each stock:
- Stock Ticker (e.g., AAPL, TSLA).
- Buy Price (e.g., 150.25).
- Buy Amount (e.g., 10).
- Hebrew-Friendly Interface: Intuitive settings dialog with clear instructions in Hebrew.
- Customizable PNL Tracking: Visualize PNL on charts with real-time updates based on market data.
How to Use
1. Add the Indicator:
- Go to the Indicators menu in TradingView and add the "SBC Portfo" PNL Indicator.
2. Configure Portfolios:
- Open the indicator’s settings dialog.
- For each portfolio (up to 5), enter data in the provided input fields using this format:
PortfolioName:StockTicker:BuyPricexBuyAmount;StockTicker:BuyPricexBuyAmount
Example:
Portfolio1:AAPL:150.25x10;TSLA:266.72x5
- This represents a portfolio named "Portfolio1" with:
- 10 shares of AAPL bought at $150.25.
- 5 shares of TSLA bought at $266.72.
- Repeat for additional portfolios (e.g., Portfolio2, Portfolio3).
- Add multiple buy commands for the same stock if needed (e.g., AAPL:160.50x20).
3. Apply Settings:
- Save settings to display PNL based on current market prices.
4. Monitor PNL:
- View PNL for each portfolio on the chart via tables, labels, or graphical overlays (based on settings).
Input Format
Enter portfolio data manually in the settings dialog, one input field per portfolio:
PortfolioName:StockTicker:BuyPricexBuyAmount;StockTicker:BuyPricexBuyAmount
- PortfolioName: Unique name (e.g., Portfolio1, Growth).
- StockTicker: Stock symbol (e.g., AAPL).
- BuyPrice: Purchase price per share (e.g., 150.25).
- BuyAmount: Number of shares (e.g., 10).
- Use
: to separate portfolio name, ticker, and buy data
x to separate price and amount
; for multiple stocks in the portfolio
Example:
- Portfolio 1: GrowthPortfolio:AAPL:150.25x10;TSLA:266.72x5
- Portfolio 2: DividendPortfolio:KO:55.20x50;PG:145.30x30
Notes
- Hebrew Support: Settings and labels are optimized for Hebrew users.
- Manual Input: Enter portfolio data manually in the settings dialog using the correct format.
- Compatibility: Works with any stock ticker supported by TradingView.
תיאור אינדיקטור SBC Portfo PNL הוא כלי ידידותי למשתמש שתוכנן במיוחד עבור סוחרים דוברי עברית למעקב אחר רווח והפסד (PNL) של תיקי המניות שלהם ישירות בגרפים של TradingView. הוא תומך בעד 5 תיקים נפרדים, כאשר כל תיק יכול להכיל מספר בלתי מוגבל של מניות עם פקודות קנייה בלתי מוגבלות, ומאפשר מעקב בזמן אמת אחר ביצועי התיק.
תכונות עיקריות
- תמיכה בריבוי תיקים: מעקב אחר עד 5 תיקים נפרדים עבור אסטרטגיות מסחר או חשבונות שונים.
- רישום מניות ללא הגבלה: הוספת מספר בלתי מוגבל של מניות ופקודות קנייה לכל תיק.
- פקודות קנייה מפורטות: הזנת נתונים עבור כל מניה:
- סימול המניה (למשל, AAPL, TSLA).
- מחיר קנייה (למשל, 150.25).
- כמות קנייה (למשל, 10).
- ממשק ידידותי לעברית: חלונית הגדרות אינטואיטיבית עם הוראות ברורות בעברית.
- מעקב PNL הניתן להתאמה: הצגת רווח והפסד בגרפים עם עדכונים בזמן אמת בהתבסס על נתוני השוק.
כיצד להשתמש
1. הוספת האינדיקטור:
- נווט לתפריט האינדיקטורים ב-TradingView והוסף את "SBC Portfo PNL Indicator".
2. הגדרת תיקים:
- פתח את חלונית ההגדרות של האינדיקטור.
- עבור כל תיק (עד 5), הזן נתונים בשדות המסופקים בפורמט הבא:
PortfolioName:StockTicker:BuyPricexBuyAmount;StockTicker:BuyPricexBuyAmount
לדוגמה:
Portfolio1:AAPL:150.25x10;TSLA:266.72x5
שורה זו מייצגת תיק בשם "Portfolio1" עם:
- 10 מניות של AAPL שנקנו ב-$150.25.
- 5 מניות של TSLA שנקנו ב-$266.72.
- חזור על התהליך עבור תיקים נוספים (למשל, Portfolio2, Portfolio3).
- ניתן להוסיף פקודות קנייה מרובות לאותה מניה לפי הצורך (למשל, AAPL:160.50x20).
3. החלת ההגדרות:
- שמור את ההגדרות להצגת ה-PNL בהתבסס על מחירי השוק הנוכחיים.
4. מעקב אחר PNL:
- צפה ב-PNL עבור כל תיק בגרף באמצעות טבלאות, תוויות או שכבות גרפיות (בהתאם להגדרות).
פורמט קלט הזן נתוני תיק ידנית בחלונית ההגדרות, שדה קלט אחד לכל תיק: PortfolioName:StockTicker:BuyPricexBuyAmount;StockTicker:BuyPricexBuyAmount
PortfolioName: שם ייחודי (למשל, Portfolio1, Growth).
StockTicker: סימול המניה (למשל, AAPL).
BuyPrice: מחיר רכישה למניה (למשל, 150.25).
BuyAmount: מספר המניות (למשל, 10).
השתמש ב-
: להפרדה בין שם התיק, סימול ונתוני קנייה
x להפרדה בין מחיר וכמות
; להפרדה בין מניות מרובות
דוגמה:
- תיק 1: GrowthPortfolio:AAPL:150.25x10;TSLA:266.72x5
- תיק 2: DividendPortfolio:KO:55.20x50;PG:145.30x30
Release Notes
Version 1.1 includes:
- Calculations for extended hours (Pre-Market & After-Hours).
- Option to display portfolio summary data for stocks not in the portfolio (enable via settings checkbox).
- Table background for better visibility; click to bring table to the front.
- Updated text strings (names, titles, tooltips).
הערות
תמיכה בעברית: ההגדרות והתוויות מותאמות למשתמשים דוברי עברית.
הזנה ידנית: הזן נתוני תיק ידנית בחלונית ההגדרות תוך שימוש בפורמט הנכון.
תאימות: עובד עם כל סימול מניה הנתמך על ידי TradingView.
גרסה 1.1 מכילה:
1. חישובים כוללים שעות מסחר מורחבות (Pre-Market ו-After-Hours).
2. אפשרות להציג נתוני תיק כוללים עבור מניות שאינן בתיק (הפעל באמצעות תיבת סימון בהגדרות).
3. צבע רקע לטבלה לשיפור הנראות; לחיצה על הטבלה מביאה אותה לחזית.
4. תיקון נוסחים (שמות, כותרות, וטולטיפים).
[blackcat] L3 Hull SeekerOVERVIEW
The L3 Hull Seeker is a comprehensive trading indicator that combines Hull Moving Average (HMA) analysis with robust position management and risk control features. This script is designed to help traders identify potential entry and exit points while maintaining strict risk management protocols.
KEY FEATURES
• Hull MA Analysis:
Advanced Hull Moving Average calculations
Separate Hull MA lines for Close and Open prices
Visual color coding for trend direction
Customizable length parameter for flexibility
• Position Tracking:
Real-time monitoring of long and short positions
Maximum position limit control
Clear position status indicators on chart
• Risk Management System:
User-defined Take Profit percentage
User-defined Stop Loss percentage
Optional activation of TP/SL features
Dynamic label markers for important levels
• Alert System:
Buy/Sell entry alerts
Take Profit/Stop Loss exit alerts
Position status changes
HOW TO USE
Setup Initial Parameters:
Hull MA Length: Adjust based on your trading timeframe
Take Profit Percentage: Set according to your risk tolerance
Stop Loss Percentage: Define your maximum acceptable loss
Enable/Disable Features:
Toggle Take Profit/Stop Loss options as needed
Adjust alert conditions for your trading style
Monitor Trading Signals:
Watch for crossover/crossunder signals
Track position status through labels
Monitor entry and exit alerts
Manage Risk:
Use TP/SL features to control position size
Monitor pyramiding limits
Review position status regularly
TRADE MANAGEMENT
• Entry Conditions:
Long Entry: HullMA_close crosses above HullMA_open
Short Entry: HullMA_close crosses below HullMA_open
• Exit Conditions:
Take Profit: Price reaches defined percentage above/below entry
Stop Loss: Price reaches defined percentage below/above entry
• Position Control:
Limited to one position at a time
Automatic position tracking
Clear visual indication of current trades
TECHNICAL DETAILS
• Hull MA Calculation:
Uses WMA (Weighted Moving Average) for precise calculations
Optimized for trend-following strategies
Smoothed Hull MA lines for better readability
• Label System:
Clear buy/sell markers
Take Profit and Stop Loss indicators
Real-time position status updates
• Alert Configuration:
Customizable alert messages
Multiple alert conditions
Option to enable/disable specific alerts
LIMITATIONS
⚠️ Important Considerations:
Results may vary across different market conditions
Historical performance does not guarantee future results
Always backtest strategy before live trading
Consider complementing with additional analysis tools
BEST PRACTICES
• Recommended Timeframes:
Daily charts for long-term strategies
4-hour charts for swing trading
1-hour charts for short-term trading
• Risk Management Tips:
Start with small position sizes
Always use TP/SL in live trading
Monitor market volatility before entering trades
TROUBLESHOOTING
• Common Issues:
Ensure proper chart resolution
Verify alert conditions are enabled
Check for conflicting indicators
• Performance Optimization:
Use appropriate timeframe for your strategy
Adjust indicator parameters based on market conditions
Monitor for potential overfitting

Time of Day Background with Bar Count & TableDescription:
This indicator provides a comprehensive overview of market activity by dynamically displaying the time-of-day background and tracking bullish and bearish bar counts across different sessions. It also features a table summarizing the market performance for the last 7 days, segmented into four time-based sessions: Morning, Afternoon, Evening, and Night.
Key Features:
Time of Day Background:
The chart's background color changes based on the time of day:
Evening (12 AM - 6 AM) is shaded blue.
Morning (6 AM - 12 PM) is shaded aqua.
Afternoon (12 PM - 6 PM) is shaded yellow.
Night (6 PM - 12 AM) is shaded silver.
Bullish and Bearish Bar Counting:
It tracks the number of bullish (closing higher than opening) and bearish (closing lower than opening) candles.
The sum of the price differences (bullish minus bearish) for each session is displayed as a dynamic label, indicating overall market direction for each session.
Session Breakdown:
The chart is divided into four sessions, each lasting 6 hours (Morning, Afternoon, Evening, Night).
A new label is generated at the start of each session, indicating the bullish/bearish performance and the net difference in price movements for that session.
Historical Session Performance:
The indicator tracks and stores the performance for each session over the past 7 days.
A table is generated in the top-right corner of the chart, summarizing the performance for each session (Morning, Afternoon, Evening, Night) and the price changes for each of the past 7 days.
The values are color-coded to indicate positive (green) or negative (red) results.
Dynamic Table:
The table presents performance data for each time session over the past week with color-coded cells:
Green cells indicate positive performance.
Red cells indicate negative performance.
Empty cells represent no data for that session.
Use Case:
This indicator is useful for traders who want to track market activity and performance across different times of day and monitor how each session contributes to the overall market trend. It provides both visual insights (through background color) and numerical data (via the table) for better decision-making.
Settings:
The background color and session labels update automatically based on the time of day.
The table updates every day, tracking the performance of each session over the past week.

Hourly Market Movement Pattern Indicator# Hourly Market Movement Pattern Indicator
This versatile technical analysis tool identifies the most active hours for trading by analyzing historical price movements. While it can be viewed on any timeframe chart, the indicator specifically tracks and displays which hours of the day historically show the strongest upward or downward price movements, helping traders optimize their trading schedule around these recurring hourly patterns.
## Core Features
- Tracks the best performing hours for both upward and downward movements
- Viewable on any timeframe chart while maintaining hourly analysis
- Clear visual display through a color-coded table overlay
- Real-time updates with new market data
- Works with all trading instruments (stocks, crypto, forex, futures, etc.)
## Timeframe Applications
### Chart Viewing Options
- Can be viewed on any timeframe chart (1min to Monthly)
- Maintains hourly pattern analysis regardless of chart timeframe
- Helps correlate hourly patterns with your preferred trading timeframe
- Allows detailed visualization of hourly patterns within your analysis period
### Intraday Trading
- Identify the most profitable hours for trading
- Plan trading sessions around historically strong hours
- Optimize entry and exit timing based on hourly patterns
- Structure day trading schedules around peak movement hours
### Swing Trading
- Use hourly statistics to optimize entry/exit timing
- Plan trade executions during historically strong hours
- Time position entries based on hourly success rates
- Enhance swing trading decisions with hourly pattern data
## Practical Applications
### Pattern Recognition
- Track recurring hourly market movements
- Identify institutional trading hour patterns
- Detect regular market cycle hours
- Recognize changes in hourly market behavior
### Risk Management
- Adjust position sizing based on historical hourly patterns
- Plan entries during statistically favorable hours
- Time stop loss adjustments around known volatile hours
- Scale positions according to hourly success rates
### Trade Planning
- Schedule trading sessions during optimal hours
- Plan trade executions around strong movement periods
- Structure trading day around peak hours
- Time position adjustments to favorable hours
## Setup Options
- Timeframe: View on any chart timeframe while tracking hourly patterns
- Visual Display: Non-intrusive table overlay
- Color Coding: Green for upward movements, Red for downward movements
- Hour Display: 24-hour format for global market compatibility
## Trading Strategy Integration
The indicator enhances trading approaches through:
- Optimal hour identification for trade execution
- Historical hourly pattern analysis
- Day trading session optimization
- Position timing based on hourly statistics
## Notes
This indicator proves particularly valuable for:
- Traders seeking to optimize their daily trading schedule
- Day traders focusing on peak market hours
- Swing traders optimizing entry/exit timing
- Traders adapting strategies to specific market hours
- International traders tracking hour-specific patterns across sessions
The tool's hourly pattern analysis provides crucial timing information regardless of your preferred chart timeframe or trading style, helping optimize trade execution around the most statistically favorable hours of the day.

Custom 4-Hour Candle Colors with Opening Price LinesDescription:
This indicator enhances the visual clarity of 4-hour candles by allowing users to assign custom colors to each 4-hour time block on their chart. It also provides the option to plot horizontal lines at the opening price of each 4-hour candle, with the lines extending for a customizable duration (up to 36 hours), making it easy to track the opening price levels over time.
Features:
Custom 4-Hour Candle Colors: Define unique colors for each 4-hour candle block on the chart. You can configure the colors for six different 4-hour periods, making it easier to visually differentiate between different parts of the trading day.
Opening Price Lines: The indicator plots horizontal lines at the opening price of each 4-hour candle, with the option to extend the lines for up to 36 hours into the future. The lines can also have different colors, which you can configure separately for each time block.
Flexible Time Configuration: Set custom open times for each 4-hour candle block, allowing you to adjust the indicator to match specific market sessions or time zones.
Fully Customizable: Choose both the candle colors and the opening price line colors independently for each 4-hour period. This allows for a highly personalized chart setup.
Use Cases:
Session Tracking: Easily track different trading sessions by assigning specific colors to different time periods.
Key Price Levels: Keep an eye on important opening price levels throughout the day by extending opening price lines into the future.
Visual Organization: For traders who prefer color-coded charts for improved readability, this indicator helps to organize trading days visually by color-blocking each time segment.
Important Notes:
Due to TradingView’s limitations, the opening price lines can only extend up to 500 bars into the future. The indicator automatically limits the duration of the lines to this maximum.
The script is designed to be flexible and user-friendly, allowing for easy adjustments to suit different trading styles and market conditions.

Points of InterestIndicator for displaying a timed, intraday Range of Price as a Point of Interest (POI) that you may want to track when trading as a potential magnet for price. Quite often you will see Price return to prior days price range before continuing to move. This enables you to track specific portions of a Days Trading session to see what has been revisited and what has not yet been re traded to.
The range is tracked for each trading day between the times that you specify in the Inputs ‘POI Time’ parameter You can also set the Time zone of the Range.
It will mark the Range High and Low for the timed range with lines that can be optionally extended and can be customised in terms of colour, style and width.
It will also Plot a line showing the Equilibrium of the range which is 50% from the High to the Low point of price during the time window that you specified in the ‘POI Time’ Parameter. This can also be customised in terms of visibility, colour, style and width.
You can control an optional Label for the POI Equilibrium Line to include a combination of a user defined prefix, the Date that the POI Equilibrium Line’s range is from and the Price Level of the Equilibrium Line. The colour and size of the label is also configurable
This indicator will also track when a POI Equilibrium Line has been traded to or ‘Tapped’. The tracking can be started after a configurable number of minutes have elapsed from the end of the POI Time window. This can also be customised in terms of visibility, colour, style, extended toggle and width.
Optionally Taps of the POI Equilibrium Level can be counted as valid during specific time windows or session of the day - for example only count taps during New York Morning Trading session.
The indicator uses Lower Time Frame data to compute the Range and 50% / Equilibrium Level so will work accurately on Chart Timeframes up to and including Daily with The POI Time specified down to a Minute resolution.

ICT Market Structure Screener (Zeiierman)█ Overview
The ICT Market Structure Screener (Zeiierman) is designed to identify and display key market structure levels and patterns based on Smart Money Concepts. It highlights bullish and bearish structures, premium and discount levels, and generates alerts for significant market structure changes, making it a valuable tool for traders looking to understand institutional trading behaviors and market trends. A key feature of this indicator is its screener function, which allows traders to monitor multiple symbols simultaneously. This feature provides a consolidated view of the market structure for various assets, making it easier to identify trading opportunities across a diverse portfolio.
█ How It Works
The ICT Market Structure Screener operates by identifying high and low pivot points within a specified period, then analyzing these pivots to determine changes in market structure. The indicator tracks price movements and categorizes them into bullish or bearish structures, indicating potential trend reversals or continuations. By plotting premium and discount levels, it helps traders identify overbought and oversold conditions. The indicator also provides real-time updates and alerts for significant changes in the market structure.
█ Terminology
ChoCH (Change of Character): Indicates a potential reversal in market direction. It is identified when the price breaks a significant high or low, suggesting a shift from a bullish to bearish trend or vice versa.
SMS (Smart Money Shift): Represents the transition phase in market structure where smart money begins accumulating or distributing assets. It typically follows a BMS and indicates the start of a new trend.
BMS (Bullish/Bearish Market Structure): Confirms the trend direction. Bullish Market Structure (BMS) confirms an uptrend, while Bearish Market Structure (BMS) confirms a downtrend. It is characterized by a series of higher highs and higher lows (bullish) or lower highs and lower lows (bearish).
Premium: A zone where the price is considered overbought. It is calculated as the upper range of the current market structure and indicates a potential area for selling or shorting.
Mid Range: The midpoint between the high and low of the market structure. It often acts as a support or resistance level, helping traders identify potential reversal or continuation points.
Discount: A zone where the price is considered oversold. It is calculated as the lower range of the current market structure and indicates a potential area for buying or going long.
█ How to Use
The ICT Market Structure Screener allows traders to follow smart money moves in the market more effectively. By identifying key market levels and monitoring bullish and bearish structures, traders can easily spot trend changes and strong trends. The indicator's premium and discount levels help identify overbought and oversold conditions, providing valuable entry and exit points. Alerts for ChoCH, SMS, and BMS keep traders informed about significant market changes, enabling real-time adjustments to trading strategies.
The screener functionality is particularly valuable for monitoring multiple markets simultaneously. The screener table displays critical information such as current price, trend direction, signal type, and premium/discount levels for each symbol. This makes it easier to track the market structure of various assets at a glance and quickly identify trading opportunities across different markets.
Example Strategies:
⚪ Trend Following: Use the indicator to identify the current market trend (bullish or bearish) and trade in the direction of the trend. Enter trades on pullbacks to premium (for shorts) or discount (for longs) levels.
⚪ Reversal Trading: Look for ChoCH signals to identify potential trend reversals. Enter trades when the price breaks a significant high or low and confirms a change in market structure, or wait for a retest of the nearest Orderblock that was formed.
⚪ Support and Resistance: Utilize the mid-range, premium, and discount levels as support and resistance zones. Enter trades when the price approaches these levels and shows signs of reversal or continuation.
⚪ Multi-Symbol Analysis: Use the screener table to monitor multiple symbols and quickly assess their market structure. This helps in diversifying trading opportunities and managing a portfolio of assets efficiently.
█ Settings
Period: The pivot period for calculating the structure. Increasing the period captures broader trends, making the structure more representative of long-term movements. Decreasing the period focuses on shorter-term trends, increasing sensitivity.
Response: Enabling this option uses the response period instead of the pivot period, providing more flexibility in capturing short-term or long-term structures. The period for the response, which determines the structure's sensitivity. Increasing the response period smoothens the structure, making it less reactive to short-term fluctuations. Decreasing the response period makes the structure more responsive to short-term changes.
Structure Display: Choose between displaying the active range or the previous range. 'Active Range' shows real-time premium, discount, and mid-range levels based on the current structure. 'Previous Range' displays past ranges, useful for analyzing historical support/resistance levels.
Ticker Symbols: List of symbols to include in the screener. Enabling the option includes the symbol in the screener, allowing the user to track its structure. Disabling it excludes the symbol from the screener, reducing the number of tracked symbols.
-----------------
Disclaimer
The information contained in my Scripts/Indicators/Ideas/Algos/Systems does not constitute financial advice or a solicitation to buy or sell any securities of any type. I will not accept liability for any loss or damage, including without limitation any loss of profit, which may arise directly or indirectly from the use of or reliance on such information.
All investments involve risk, and the past performance of a security, industry, sector, market, financial product, trading strategy, backtest, or individual's trading does not guarantee future results or returns. Investors are fully responsible for any investment decisions they make. Such decisions should be based solely on an evaluation of their financial circumstances, investment objectives, risk tolerance, and liquidity needs.
My Scripts/Indicators/Ideas/Algos/Systems are only for educational purposes!

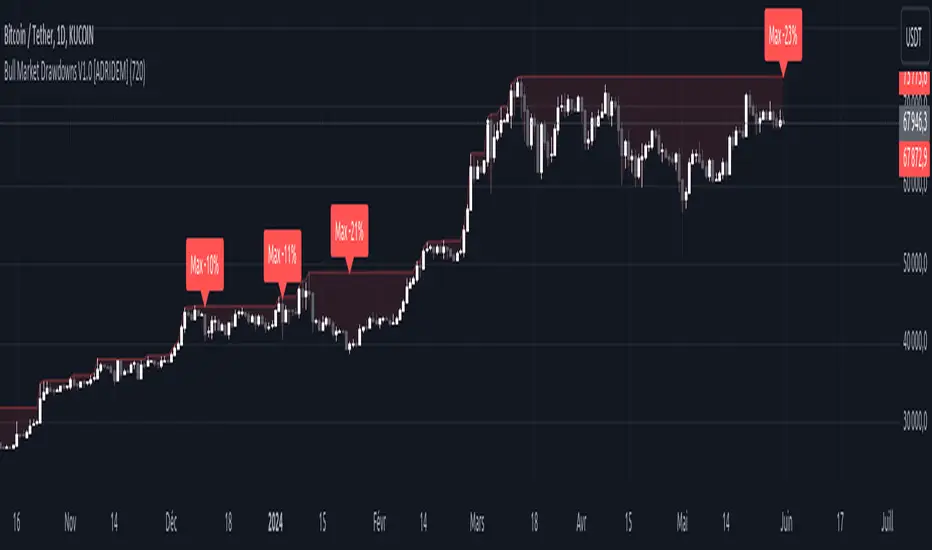
Bull Market Drawdowns V1.0 [ADRIDEM]Bull Market Drawdowns V1.0
Overview
The Bull Market Drawdowns V1.0 script is designed to help visualize and analyze drawdowns during a bull market. This script calculates the highest high price from a specified start date, identifies drawdown periods, and plots the drawdown areas on the chart. It also highlights the maximum drawdowns and marks the start of the bull market, providing a clear visual representation of market performance and potential risk periods.
Unique Features of the New Script
Default Timeframe Configuration: Allows users to set a default timeframe for analysis, providing flexibility in adapting the script to different trading strategies and market conditions.
Customizable Bull Market Start Date: Users can define the start date of the bull market, ensuring the script calculates drawdowns from a specific point in time that aligns with their analysis.
Drawdown Calculation and Visualization: Calculates drawdowns from the highest high since the bull market start date and plots the drawdown areas on the chart with distinct color fills for easy identification.
Maximum Drawdown Tracking and Labeling: Tracks the maximum drawdown for each period and places labels on the chart to indicate significant drawdowns, helping traders identify and assess periods of higher risk.
Bull Market Start Marker: Marks the start of the bull market on the chart with a label, providing a clear reference point for the beginning of the analysis period.
Originality and Usefulness
This script provides a unique and valuable tool by combining drawdown analysis with visual markers and customizable settings. By calculating and plotting drawdowns from a user-defined start date, traders can better understand the performance and risks associated with a bull market. The script’s ability to track and label maximum drawdowns adds further depth to the analysis, making it easier to identify critical periods of market retracement.
Signal Description
The script includes several key visual elements that enhance its usefulness for traders:
Drawdown Area : Plots the upper and lower boundaries of the drawdown area, filling the space between with a semi-transparent color. This helps traders easily identify periods of market retracement.
Maximum Drawdown Labels : Labels are placed on the chart to indicate the maximum drawdown for each period, providing clear markers for significant drawdowns.
Bull Market Start Marker : A label is placed at the start of the bull market, marking the beginning of the analysis period and helping traders contextualize the drawdown data.
These visual elements help quickly assess the extent and impact of drawdowns within a bull market, aiding in risk management and decision-making.
Detailed Description
Input Variables
Default Timeframe (`default_timeframe`) : Defines the timeframe for the analysis. Default is 720 minutes
Bull Market Start Date (`start_date_input`) : The starting date for the bull market analysis. Default is January 1, 2023
Functionality
Highest High Calculation : The script calculates the highest high price on the specified timeframe from the user-defined start date.
```pine
var float highest_high = na
if (time >= start_date)
highest_high := na(highest_high ) ? high : math.max(highest_high , high)
```
Drawdown Calculation : Determines the drawdown starting point and calculates the drawdown percentage from the highest high.
```pine
var float drawdown_start = na
if (time >= start_date)
drawdown_start := na(drawdown_start ) or high >= highest_high ? high : drawdown_start
drawdown = (drawdown_start - low) / drawdown_start * 100
```
Maximum Drawdown Tracking : Tracks the maximum drawdown for each period and places labels above the highest high when a new high is reached.
```pine
var float max_drawdown = na
var int max_drawdown_bar_index = na
if (time >= start_date)
if na(max_drawdown ) or high >= highest_high
if not na(max_drawdown ) and not na(max_drawdown_bar_index) and max_drawdown > 10
label.new(x=max_drawdown_bar_index, y=drawdown_start , text="Max -" + str.tostring(max_drawdown , "#") + "%",
color=color.red, style=label.style_label_down, textcolor=color.white, size=size.normal)
max_drawdown := 0
max_drawdown_bar_index := na
else
if na(max_drawdown ) or drawdown > max_drawdown
max_drawdown := drawdown
max_drawdown_bar_index := bar_index
```
Drawdown Area Plotting : Plots the drawdown area with upper and lower boundaries and fills the area with a semi-transparent color.
```pine
drawdown_area_upper = time >= start_date ? drawdown_start : na
drawdown_area_lower = time >= start_date ? low : na
p1 = plot(drawdown_area_upper, title="Drawdown Area Upper", color=color.rgb(255, 82, 82, 60), linewidth=1)
p2 = plot(drawdown_area_lower, title="Drawdown Area Lower", color=color.rgb(255, 82, 82, 100), linewidth=1)
fill(p1, p2, color=color.new(color.red, 90), title="Drawdown Fill")
```
Current Maximum Drawdown Label : Places a label on the chart to indicate the current maximum drawdown if it exceeds 10%.
```pine
var label current_max_drawdown_label = na
if (not na(max_drawdown) and max_drawdown > 10)
current_max_drawdown_label := label.new(x=bar_index, y=drawdown_start, text="Max -" + str.tostring(max_drawdown, "#") + "%",
color=color.red, style=label.style_label_down, textcolor=color.white, size=size.normal)
if (not na(current_max_drawdown_label))
label.delete(current_max_drawdown_label )
```
Bull Market Start Marker : Places a label at the start of the bull market to mark the beginning of the analysis period.
```pine
var label bull_market_start_label = na
if (time >= start_date and na(bull_market_start_label))
bull_market_start_label := label.new(x=bar_index, y=high, text="Bull Market Start", color=color.blue, style=label.style_label_up, textcolor=color.white, size=size.normal)
```
How to Use
Configuring Inputs : Adjust the default timeframe and start date for the bull market as needed. This allows the script to be tailored to different market conditions and trading strategies.
Interpreting the Indicator : Use the drawdown areas and labels to identify periods of significant market retracement. Pay attention to the maximum drawdown labels to assess the risk during these periods.
Signal Confirmation : Use the bull market start marker to contextualize drawdown data within the overall market trend. The combination of drawdown visualization and maximum drawdown labels helps in making informed trading decisions.
This script provides a detailed view of drawdowns during a bull market, helping traders make more informed decisions by understanding the extent and impact of market retracements. By combining customizable settings with visual markers and drawdown analysis, traders can better align their strategies with the underlying market conditions, thus improving their risk management and decision-making processes.
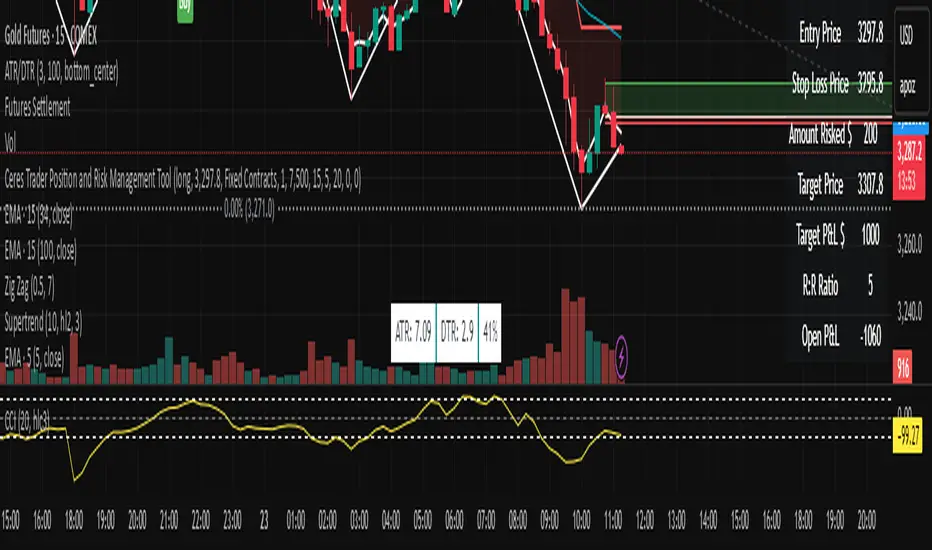
Ceres Trader Position and Risk Management ToolNOTE: It won't properly scale until you enter an entry point that is located on the chart. It's a feature not a bug. After that, you will see the entry, s/l, and target price lines properly displayed on the chart.
The "Ceres Trader Position and Risk Management Tool" is a comprehensive indicator designed for TradingView, meticulously crafted for traders who prioritize effective risk management and clear position visualization. This tool seamlessly integrates with your trading strategy, providing crucial information about your trades directly on your chart.
Key Features:
Position Type Visualization: Displays long or short positions with distinct color-coded lines and boxes for easy recognition.
Entry, Stop Loss, and Target Levels: Visual markers for entry price, stop loss, and target price, enabling you to track your trade setup at a glance.
Risk Assessment: Calculates and displays the amount at risk based on the stop loss distance and the percentage of risk capital.
Profit Potential: Shows the potential profit in dollar terms if the target is reached, helping you understand the reward prospects of your trade.
Reward to Risk Ratio: Indicates the ratio of potential reward to risk, an essential metric for evaluating the efficiency of your trade setup.
Current P&L Tracking: Continuously updates the open profit and loss based on the current market price, giving you real-time insight into your trade's performance.
Customizable Risk and Reward Boxes: Allows personalization of the risk and reward zones with color options, enhancing chart clarity and visual appeal.
How to Use:
Setting Up Your Trade:
Input your trade details including position type (long or short), entry price, risk capital, risk percentage, reward-risk ratio, and stop loss distance.
Visualize Your Trade:
The tool will automatically plot the entry, stop loss, and target prices on the chart.
Risk and reward areas will be highlighted with customizable color boxes.
Monitor Your Risk and Reward:
View the amount risked and potential profit in dollar terms directly on the chart.
Keep track of the reward to risk ratio to assess trade efficiency.
Stay Informed of Real-time Performance:
The current P&L of your open position will be updated in real-time, helping you make informed decisions.
This tool is ideal for traders who follow disciplined risk management practices and want to keep essential trade information easily accessible. With the "Ceres Trader Position and Risk Management Tool," you are equipped to make strategic trading decisions backed by clear visual cues and critical data.
Technical Analysis Consulting Table (TACT)Inspired by Tradingview's own "Technical Analysis Summary", I present to you a table with analogous logic.
You can track any ticker you want, no matter your chart. You can even have multiple tables to track multiple tickers. By default it tracks the Total Crypto Cap.
You can change the resolution you want to track. By default it is the same as the chart.
You can position the table to whichever corner of the chart you want. By default it draws in the bottom right corner.
Background colors and text size can be adjusted.
Indicators Used:
Oscillators
RSI(14)
STOCH(14, 3, 3)
CCI(20)
ADX(14)
AO
Momentum(10)
MACD(12, 26)
STOCH RSI(3, 3, 14, 14)
%R(14)
Bull Bear Power
UO(7,14,28)
Moving Averages
EMA(5)
SMA(5)
EMA(10)
SMA(10)
EMA(20)
SMA(20)
EMA(30)
SMA(30)
EMA(50)
SMA(50)
EMA(100)
SMA(100)
EMA(200)
SMA(200)
Ichimoku Cloud(9, 26, 52, 26)
VMWA(20)
HMA(9)
Pivots
Traditional
Fibonacci
Camarilla
Woodie
WARNING: I have observed up to a couple of seconds of signal jitter/delay, so use it with caution in very small resolutions (1s to 1m).
I hope you enjoy this and good luck with your trading. Suggestions and feedback are most welcome.

Daily Floor PivotsDaily Floor Pivots with Comprehensive Statistical Analysis
Overview
This indicator combines traditional floor pivot levels with golden zone analysis and comprehensive statistical insights derived from 15 years of historical NQ futures data. While the pivot levels and golden zones can be applied to any instrument, the statistical tables are specifically calibrated for NQ/MNQ futures based on analysis of 2,482 NY Regular Trading Hours (RTH) sessions from 2010-2025.
What Makes This Indicator Original
Unlike standard pivot indicators that merely plot levels, this tool provides:
Enhanced Golden Zone Analysis: Calculates not only the main golden zone (0.5-0.618 retracement of previous day's range) but also golden zones between each pivot pair (PP-R1, R1-R2, R2-R3, PP-S1, S1-S2, S2-S3)
Data-Driven Statistical Tables: Two comprehensive tables displaying real statistics from 2,482 trading days of NQ analysis, including:
Probability-based touch rates and continuation patterns
Context-aware statistics based on opening position
Gap analysis and behavioral patterns
First touch dynamics and time-to-reach averages
Granular Customization: Every visual element and statistical section can be independently toggled, allowing traders to focus on what matters most to their strategy
How It Works
Pivot Calculation Methodology
The indicator uses the standard floor pivot formula based on the previous day's price action:
Pivot Point (PP) = (Previous High + Previous Low + Previous Close) / 3
Resistance Levels: R1, R2, R3 calculated from PP and previous range
Support Levels: S1, S2, S3 calculated from PP and previous range
Golden Zone Calculations
Main Golden Zone: The 0.5 to 0.618 Fibonacci retracement of the previous day's range, representing a key reversal and continuation area.
Inter-Pivot Golden Zones: For each adjacent pivot pair, golden zones are calculated as:
Resistance pairs (PP→R1, R1→R2, R2→R3): 0.5-0.618 range from the lower pivot
Support pairs (PP→S1, S1→S2, S2→S3): 0.382-0.5 range from the upper pivot
These zones represent high-probability areas where price tends to react when moving between pivot levels.
Statistical Analysis Source
All statistics displayed in the tables are derived from external Python analysis of 15 years of 1-minute NQ futures data (2010-2025), specifically analyzing NY RTH sessions (9:30 AM - 4:00 PM EST). The analysis tracked:
2,482 complete trading days
Intraday pivot touches and closes
Opening position context
Gap behavior relative to previous day
Time-of-day patterns
Sequential pivot interactions
IMPORTANT: While the pivot levels and golden zones are universally applicable mathematical calculations that work on any instrument, the statistical percentages shown in the tables are specific to NQ/MNQ behavior only. Do not assume these statistics transfer to other instruments.
Configuration Guide
Basic Settings
Number of Periods Back (1-20, default: 3)
Controls how many historical pivot periods are displayed on the chart
Setting to 1 shows only current day's pivots
Higher values show more historical context
Labels Position (Left/Right)
Choose whether pivot labels appear on the left or right side of each level line
Line Width (1-5, default: 2)
Adjust the thickness of all pivot and golden zone lines
Golden Zone Customization
Show Daily Golden Zone (0.5-0.618)
Toggle the main golden zone on/off
When enabled, displays a shaded box between the 0.5 and 0.618 retracement levels
Line Color / Fill Color
Customize the appearance of the main golden zone
Fill color determines the shaded box transparency
Show Labels / Show Prices
Control whether "0.5" and "0.618" labels appear
Control whether price values are displayed on labels
Inter-Pivot Golden Zones
Six toggle options allow you to show/hide individual golden zones:
PP to R1 / PP to S1: Most frequently touched (60.8% / 50.9%)
R1 to R2 / S1 to S2: Moderately touched (25.2% / 24.0%)
R2 to R3 / S2 to S3: Rarely touched (9.4% / 10.5%)
Line Color / Fill Color: Customize appearance of all inter-pivot zones
Show Labels / Show Prices: Control labeling for inter-pivot zones
Usage Tip: Disable outer zones (R2-R3, S2-S3) on lower volatility days to reduce chart clutter.
Pivot Display
Show Support/Resistance Levels: Master toggle for all pivot lines
Show SR Labels / Show SR Prices: Control labeling on pivot levels
Individual level toggles and colors:
PP (Pivot Point): The central reference point
R1/S1: Primary resistance/support (38.9% / 35.4% touch rate)
R2/S2: Secondary levels (15.6% / 16.1% touch rate)
R3/S3: Extended levels (5.1% / 7.3% touch rate)
Color Customization: Each level's color can be independently set
Overall Statistics Table
Show Overall Statistics Table: Master toggle
Table Size: tiny/small/normal/large/huge/auto
Table Position: Top Left/Top Right/Bottom Left/Bottom Right
Section Toggles (enable/disable individual sections):
Current Session Info
Touch & Close Rates
Continue & Reject Rates
First Touch Statistics
Golden Zone Statistics
Daily Close Distribution
Highest/Lowest Levels Reached
Context Statistics Table
Show Context Statistics Table: Master toggle
Table Size: tiny/small/normal/large/huge/auto
Table Position: Top Left/Top Right/Bottom Left/Bottom Right
Section Toggles:
Current Opening Zone
Opening Zone Statistics
Previous Day Gap Context
Understanding the Statistical Tables
TABLE 1: OVERALL STATISTICS
This table presents universal statistics from 2,482 days of NQ analysis.
Current Session Info
Displays real-time context for the active session:
Open: Where the current RTH session opened relative to pivots (e.g., "GZ_TO_R1" means opened between the PP-R1 golden zone and R1)
Now: Current price position relative to pivots
Direction: Bull (close > open), Bear (close < open), or Flat
How to use: This section helps you quickly understand where price opened and where it currently is, providing immediate context for the day's action.
Touch & Close Rates
Shows probability that each pivot level will be reached during RTH:
Touch %: Percentage of days where price touched this level at any point
Example: R1 touched 38.9% of days, PP touched 57.5% of days
Close %: Percentage of days where price closed beyond this level
Example: R1 close beyond happened 39.8% of days
How to interpret:
Higher touch rates indicate more reliable levels for intraday targeting
The difference between touch and close rates shows rejection frequency
PP has the highest touch rate (57.5%), making it the most magnetic level
Outer levels (R3/S3) have low touch rates (5.1%/7.3%), indicating rare extension days
Continue & Reject Rates
When a level is touched, these statistics show what happens next:
Continue %: Probability price continues through the level
Example: When PP is touched, price continues 88.1% of the time
Reject %: Probability price rejects from the level and reverses
Example: When R1 is touched, price rejects 50.9% of the time
How to interpret:
PP shows highest continuation (88.1%), confirming it's a poor reversal level
Support levels (S1/S2/S3) show strong rejection rates (62.5%/60.7%/56.1%), making them better reversal candidates
Continuation rates above 80% suggest the level is better as a target than an entry
First Touch Statistics
Analyzes which pivot is typically touched first during RTH:
1st Touch %: Probability this level is the first pivot encountered
PP is first touched 37.1% of days (most common)
R1 is first touched 26.0% of days
S1 is first touched 10.9% of days
1st→Continue: If this level is touched first, probability of continuation
S1-S3 show 95.6%-100% continuation when touched first
This means when price reaches support first, it usually continues lower
Avg Time: Minutes after 9:30 AM EST before first touch
PP: 1h 6m average
S3: 19m average (when bearish)
R3: 3h 19m average (when bullish)
How to interpret:
Opening away from PP means higher probability of reaching extremes (R2/R3 or S2/S3)
When support is touched first (within first 2 hours), expect continuation lower
Late-day first touches (after 2 PM) often indicate strong trending days
Multi-Touch: Shows how often levels are tested multiple times (92.8%-95.0% across all levels)
Golden Zone Statistics
Main GZ: 58.5% touch rate for the 0.5-0.618 zone
Inter-Pivot zones:
PP-R1: 60.8% (highest probability)
PP-S1: 50.9%
R1-R2: 25.2%
S1-S2: 24.0%
R2-R3: 9.4%
S2-S3: 10.5%
How to interpret:
Main GZ is touched more often than any individual resistance level
PP-R1 and PP-S1 golden zones are high-probability mean reversion areas
Outer golden zones (R2-R3, S2-S3) are only relevant on high volatility days
Daily Close Distribution
Shows where RTH sessions typically close:
Above/Below PP: 58.5% close above, 41.5% below (slight bullish bias)
Above R1: 24.5% of days
Below S1: 18.7% of days
In GZ: Only 6.3% close in the golden zone (typically transits through it)
How to interpret:
Most days (58.5%) have bullish bias (close above PP)
Less than 25% of days are strong trending days (beyond R1/S1)
Golden zone is an action area, not a resting area
Highest/Lowest Levels Reached
Distribution of the most extreme level reached:
High Resist: R1 (26.0%), R2 (10.8%), R3 (5.1%)
Low Support: S1 (35.4%), S2 (1.9%), S3 (0.6%)
How to interpret:
Most days don't reach beyond R1 or S1
R3/S3 are rare events (5.1%/0.6%), indicating major trending days
S1 is reached as lowest level more often than R1 as highest, suggesting downside is more frequently tested
TABLE 2: CONTEXT STATISTICS
This table provides conditional statistics based on how the session opened.
Current Opening Zone
Displays which of 13 possible zones the RTH session opened in:
ABOVE_R3, R2_TO_R3, R1_TO_R2, GZ_TO_R1, IN_GZ, PP_TO_GZ, AT_PP, GZ_TO_PP, S1_TO_GZ, S2_TO_S1, S3_TO_S2, BELOW_S3
How to use: This immediately tells you the market structure and what type of day to expect.
Opening Zone Statistics
Detailed statistics for the current opening zone (only shows for 6 major zones):
For each zone, you see:
Occurs: How often this opening scenario happens
GZ_TO_R1: 38.4% (most common)
AT_PP: 12.8%
S1_TO_GZ: 24.2%
R1_TO_R2: 9.4%
S2_TO_S1: 6.3%
IN_GZ: 3.8%
Bull/Bear %: Close direction probability
Example: GZ_TO_R1 is perfectly balanced (50.0% bull / 49.6% bear)
R1_TO_R2 is bullish (58.1% bull / 41.0% bear)
Levels Hit: Probability of reaching each pivot level from this opening
Helps identify high-probability targets
Example: From GZ_TO_R1, PP is hit 52.9%, R1 is hit 49.0%, S1 is hit 21.6%
How to interpret:
GZ_TO_R1 (most common): Balanced day, watch PP and GZ for direction clues
AT_PP: Slight bullish bias (56.9%), high chance of touching both PP (92.8%) and GZ (90.3%)
R1_TO_R2: Bullish bias (58.1%), expect continuation to R2 (58.1% chance)
S2_TO_S1: Bullish reversal setup (59.9%), very high chance of S1 touch (82.8%)
IN_GZ: Rare opening (3.8%), bullish bias, virtually guaranteed GZ touch (100%)
Previous Day Gap Context
Shows current gap scenario and typical behavior:
Three scenarios:
GAP UP: Opened Above Yesterday's High (20.5% of days)
R1 Touch: 65.9% (high probability)
R2 Touch: 42.1%
S1 Touch: 15.0% (low probability)
Bias: Bullish continuation
GAP DOWN: Opened Below Yesterday's Low (11.3% of days)
S1 Touch: 71.5% (high probability)
S2 Touch: 55.2%
R1 Touch: 12.1% (low probability)
Bias: Bearish continuation
NO GAP: Opened Within Yesterday's Range (68.2% of days)
PP Touch: 69.5%
GZ Touch: 71.7%
R1 Touch: 35.2%
Bias: Balanced (watch for direction at PP/GZ)
How to interpret:
Gap days (up or down) tend to continue in the gap direction
When gapping, fade trades are low probability (15.0% and 12.1%)
Most days (68.2%) open within previous range, making PP and GZ critical decision zones
The "bias" line provides clear directional guidance for trade selection
Practical Application Examples
Example 1: Standard Day Setup
Scenario: RTH opens at 20,450
PP: 20,400
GZ: 20,390-20,395
R1: 20,425
Previous day high: 20,460
What the tables tell you:
Opening Zone: "GZ_TO_R1" (38.4% occurrence)
Gap Context: "NO GAP" (68.2% occurrence)
Expected behavior: Balanced (50/50 bull/bear)
High probability: PP touch (52.9%), GZ touch (56.8%)
Moderate probability: R1 touch (49.0%), S1 touch (21.6%)
Trade plan:
Wait for price to reach PP (52.9% chance) or GZ (56.8% chance)
Look for directional confirmation at these levels
First target R1 if bullish, S1 if bearish
Avoid assuming direction without confirmation (perfectly balanced opening)
Example 2: Gap Up Day
Scenario: RTH opens at 20,510
Previous day high: 20,460
R1: 20,425
R2: 20,475
What the tables tell you:
Gap Context: "GAP UP" (20.5% occurrence)
R1 touch: 65.9% probability
R2 touch: 42.1% probability
S1 touch: Only 15.0% probability
Bias: Bullish continuation
Trade plan:
Favor long setups
Target R1 first (65.9% chance), then R2 (42.1%)
If R1 breaks, R2 becomes likely target
Shorting is low probability (only 15.0% reach S1)
Example 3: Opening in Golden Zone
Scenario: RTH opens at 20,393
PP: 20,400
GZ: 20,390-20,395
What the tables tell you:
Opening Zone: "IN_GZ" (rare, only 3.8% occurrence)
Bullish bias: 58.1%
GZ touch: 100% (guaranteed - already there)
PP touch: 75.3%
R1 touch: 41.9%
Trade plan:
Expect price to test PP (75.3% chance)
Slight bullish bias suggests long setups better than shorts
Watch how price reacts at PP - likely to continue to R1 (41.9%)
This is an uncommon opening, suggesting potential for larger moves
Best Practices
Match Your Instrument: Remember, statistics are NQ-specific. If trading other instruments, use the levels but disregard the statistical percentages.
Combine with Price Action: Use the statistics for probability context, not as standalone signals. Always confirm with price action, volume, and your trading methodology.
Adapt Table Display: Don't display all sections all the time. Toggle based on your trading phase:
Pre-market: Focus on "Gap Context" to understand the setup
Market open: Watch "Opening Zone Statistics" for directional bias
Intraday: Monitor "Current Session Info" for position tracking
Understand Context: A 60% touch rate doesn't mean guaranteed—it means 40% of days don't touch. Use these probabilities to size positions and manage expectations.
Inter-Pivot Golden Zones: These are most useful when price is already in motion toward a level. For example, if price breaks above PP heading to R1, the PP-R1 golden zone (60.8% touch rate) becomes a high-probability pullback area.
Time Awareness: The "Avg Time" statistics help you understand urgency. If it's 10:30 AM and S1 hasn't been touched (average is 55 minutes), the window for bearish moves is closing.
Technical Notes
Time Zone: All times referenced are NY/EST
Session Definition: RTH is 9:30 AM - 4:00 PM EST
Calculation Period: Pivots update daily based on previous 24-hour period (18:00 previous day to 17:00 current day)
Data Source: Statistics derived from 12 years of NQ 1-minute futures data (2013-2025)
Sample Size: 2,482 complete RTH trading sessions
Disclaimer
This indicator provides statistical probabilities based on historical NQ futures data. Past performance does not guarantee future results. The statistical tables are educational tools and should not be the sole basis for trading decisions. Always:
Use proper risk management
Combine with your own analysis
Understand that probabilities are not certainties
Remember that statistics are instrument-specific (NQ/MNQ only)
Credits
Statistical analysis performed using Python analysis of 12 years of historical NQ futures data. All pivot and golden zone calculations use standard mathematical formulas applicable to any instrument.

Malama's Pre-Market BoxThis script is a comprehensive Pre-Market range visualizer designed to replace older, single-candle analysis tools. It automatically highlights the full pre-market session (04:00–09:30 EST) and extends key support/resistance levels into the regular trading day.
Why this script was created (Evolution from previous versions): This is a complete architectural rewrite of the older "Malama's KAYCAP Pre-Market Box."
Old Logic: The previous version focused on isolating a single, specific 1-minute candle (e.g., exactly 4:00 AM) to determine levels.
New Logic: This version tracks the entire pre-market session range. It dynamically updates the True High and True Low as the pre-market develops, providing a much more accurate support/resistance zone for the open.
Visual Overhaul: Instead of static plots, this version uses Pine Script v6 box and line objects to draw a clean, shading-customizable range that automatically extends rightward until the trading session ends.
How it works:
Session Tracking: The script monitors the user-defined session (default 04:00-09:30).
Dynamic Box: As price moves during pre-market, a box is drawn covering the highest high and lowest low of that period.
Level Extension: At 09:30 (Market Open), the script locks the High and Low values. It then projects two horizontal lines (Resistance and Support) across the chart for the rest of the day.
Breakout Detection: If the price closes outside these levels during regular hours, the script can optionally trigger Alerts and plot "BREAK" labels on the chart.
Settings:
Time Settings: Customizable session string (default captures standard US Pre-Market).
Visuals: Fully adjustable box colors, border transparency, and line width.
Signals: Toggle breakout labels on/off.
Alerts Included:
Bullish Breakout: Triggers when price crosses and closes above the Pre-Market High.
Bearish Breakdown: Triggers when price crosses and closes below the Pre-Market Low.

Unmitigated Cave Diving MTF High Low - BookMap Style Chart
Unmitigated Cave Diving MTF High Low - BookMap Style Chart
Introduction
This Pine Script indicator tracks unmitigated higher timeframe highs and lows with a session-aware approach, inspired by KinetiCapital's X D HL Targets.
Built for precision trading on instruments like NQ during extended trading hours (ETH), it visualizes support and resistance levels that have not yet been breached, helping traders identify key price zones for potential reversals or breakouts.
Core Features
The indicator monitors multi-timeframe levels (default 15-minute) and applies intelligent styling based on recency and survival duration:
Most Recent Levels: The 1st and 2nd most recent unmitigated highs and lows are highlighted with distinct colors and widths for quick visual identification
Session Age Tracking: Levels are categorized by how many full trading sessions (1800-1700 NQ ETH) they've survived unmitigated, with "old" levels receiving special highlighting once they exceed your defined threshold
BookMap-Style Visualization: Clean horizontal lines with optional price labels positioned above highs and below lows for minimal chart clutter
Real-Time Summary Table: Displays the four most recent levels with their prices, distance in points from current price, and session age
Mitigation Logic
Levels automatically update when price touches them - high levels are mitigated when price reaches or exceeds them, while low levels are mitigated when price touches or breaks below. Mitigated levels change to a neutral gray color and can optionally be deleted at session end to preserve chart memory.
This tool is particularly valuable for intraday traders who trade around key structural levels and need to understand which unmitigated zones represent the freshest or most significant price memory in the market.

AMT Structure: 80% Traverse, PD Levels & nPOCsHere is a clean, professional description formatted for the TradingView description box. It highlights the methodology (AMT/80% Rule), the specific features, and the credits.
Title: AMT Structure: 80% Traverse, PD Levels & nPOCs
Description:
This indicator is a comprehensive toolkit designed for futures traders utilizing Auction Market Theory (AMT) and Volume Profile strategies. It consolidates multiple scripts into a single, unified overlay to declutter your chart while providing essential structural references for the 80% Traverse setup, intraday context, and longer-term auction targets.
Key Features:
1. 80% Rule / Traverse Setup (Chart Champions Logic)
Automated RTH Open Detection: Hardcoded to the 08:30 AM CT Open to ensure accuracy for US Futures (ES/NQ) regardless of your chart's timezone settings.
Value Area Logic: Automatically calculates the Previous Day's Value Area High (VAH), Value Area Low (VAL), and Point of Control (POC).
Setup Detection: If the market opens outside of the previous day's value, the script highlights the Value Area in color (default: Purple), signaling that an 80% traverse (filling the value area) is structurally possible if price re-enters value.
Background Fill: Optional shading between VAH and VAL to clearly visualize the "playing field" for the traverse.
2. Auction Market Theory (AMT) Premarket Levels
Overnight High/Low: Automatically captures the highest and lowest prices traded during the overnight session (17:00 - 08:30 CT).
Breakout Alerts: Includes logic to detect and alert when these overnight levels are broken during the RTH session.
Auto-Cleanup: Lines can be set to auto-delete after a specified time (default: 60 mins into the session) to keep the chart clean after the Initial Balance (IB) period.
3. Structural Reference Levels
Previous Day Levels: Plots Previous Day High, Low, and Equilibrium (Midpoint) as standard reference lines.
Initial Balance (IB): Option to display the First Hour High and Low (08:30 - 09:30 CT) to assess day type (Neutral, Trend, Normal Variation, etc.).
RTH VWAP: An anchored VWAP that resets specifically at the RTH Open (08:30 CT), distinct from the standard 24-hour VWAP.
4. Naked Points of Control (nPOCs)
Multi-Timeframe Tracking: Tracks and plots Naked POCs for Daily, Weekly, and Monthly profiles.
Auto-Cleanup: Lines automatically delete themselves the moment price touches them, ensuring you only see untested levels.
Customization: Toggle each timeframe on/off individually.
Settings & Customization:
Global Offset: Move all text labels to the right with a single setting to prevent price action from obscuring text.
8:30 Open Offset: Independent offset for the Open label to distinguish it from other opening references.
Smart Coloring: Text labels automatically match their corresponding line colors for easy identification.
Modular Toggles: Every section (AMT, VWAP, PD Levels, CCV, nPOCs) can be turned on or off individually to suit your specific trading plan.
Usage: This tool is specifically tuned for ES and NQ futures trading but can be adapted for other instruments. It replaces the need for separate indicators for Overnight Highs/Lows, Previous Day Levels, and Volume Profile targeting.

Advanced ICC Multi-Timeframe 1.0Advanced ICC Multi-Timeframe Trading System
A comprehensive implementation and interpretation of the Indication, Correction, Continuation (ICC) trading methodology made popular by Trades by Sci, enhanced with advanced multi-timeframe analysis and automation features.
⚠️ CRITICAL TRADING WARNINGS:
DO NOT blindly follow BUY/SELL signals from this indicator
This indicator shows potential entry points but YOU must validate each trade
PAPER TRADE EXTENSIVELY before risking real capital
BACKTEST THOROUGHLY on your chosen instruments and timeframes
The ICC methodology requires understanding and discretion - automated signals are guidance only
This tool aids analysis but does not replace proper trade planning, risk management, or trader judgment
⚠️ Important Disclaimers:
This indicator is not endorsed by or affiliated with Trades by Sci
This is an early implementation and interpretation of the ICC methodology
May not work exactly as Trades by Sci executes his trades and entries
Requires further debugging, backtesting, and real-world validation
Completely free to use - no purchase required
I'm just one person obsessed with this method and wanted some better visualization of the chart/entries
About ICC:
The ICC method identifies complete market cycles through three phases: Indication (breakout), Correction (pullback), and Continuation (entry). This indicator automates the identification of these phases and adds powerful features for modern traders.
Key Features:
Multi-Timeframe Capabilities:
Automatic timeframe detection with optimized settings for 5m, 15m, 30m, 1H, 4H, and Daily charts
Higher timeframe overlay to view HTF ICC levels on lower timeframe charts for precise entry timing
Smart defaults that adjust swing length and consolidation detection based on your timeframe
Advanced Phase Tracking:
Complete ICC cycle tracking: Indication, Correction, Consolidation, Continuation, and No Setup phases
Live structure detection shows potential peaks/troughs before full confirmation
Intelligent invalidation logic detects failed setups when market structure reverses
Dynamic phase backgrounds for instant visual confirmation
Three Types of Entry Signals:
Traditional Entries - Price crosses back through the original indication level (strongest signals)
"BUY" (green) / "SELL" (red)
Breakout Entries - Price breaks out of consolidation range in the same direction
"BUY" (green) / "SELL" (red)
Reversal Entries (Optional, can be toggled off) - Price breaks consolidation in opposite direction, indicating failed setup
"⚠ BUY" (yellow) / "⚠ SELL" (orange)
More aggressive, counter-trend signals
Can be disabled for more conservative trading
Professional Features:
Volatility-based support/resistance zones (ATR-adjusted) that adapt to market conditions
Historical zone tracking (0-3 configurable) with visual hierarchy
Comprehensive real-time info table displaying all key metrics
Full alert system for entries, indications, and consolidation detection
Visual distinction between high-confidence trend entries and cautionary reversal entries
📖 USAGE GUIDE
Entry Signal Types:
The indicator provides three types of entry signals with visual distinction:
Strong Entries (High Confidence):
"BUY" (bright green) / "SELL" (bright red)
Includes traditional entries (crossing back through indication level) and breakout entries (breaking consolidation in trend direction)
These are trend continuation or breakout signals with higher probability
Recommended for all traders
Reversal Entries (Caution - Counter-Trend):
"⚠ BUY" (yellow) / "⚠ SELL" (orange)
Triggered when price breaks out of correction/consolidation in the OPPOSITE direction
Indicates a failed setup and potential trend reversal
More aggressive, counter-trend plays
Can be toggled off in settings for more conservative trading
Recommended only for experienced traders or after thorough backtesting
Swing Length Settings:
The swing length determines how many bars on each side are needed to confirm a swing high/low. This is the most important setting for tuning the indicator to your style.
Auto Mode (Recommended for beginners): Toggle "Use Auto Timeframe Settings" ON
5-minute: 30 bars
15-minute: 20 bars
30-minute: 12 bars
1-hour: 7 bars
4-hour: 5 bars
Daily: 3 bars
Manual Mode: Toggle "Use Auto Timeframe Settings" OFF
Lower values (3-7): More aggressive, detects smaller swings
Pros: More signals, faster entries, catches smaller moves
Cons: More noise, more false signals, requires tighter stops
Best for: Scalping, active day trading, volatile markets
Higher values (12-20): More conservative, only major swings
Pros: More reliable signals, fewer false breakouts, clearer structure
Cons: Fewer signals, delayed entries, might miss smaller opportunities
Best for: Swing trading, position trading, trending markets
Default Manual Setting: 7 bars (balanced for 1H charts)
Minimum: 3 bars
Consolidation Bars Setting:
Determines how many bars without new structure are needed before flagging consolidation.
Lower values (3-10): Faster detection, catches brief pauses, more sensitive
Best for: Lower timeframes, volatile markets, avoiding any chop
Higher values (20-40): More reliable, only flags true extended consolidation
Best for: Higher timeframes, trending markets, patient traders
Current defaults scale with timeframe (more bars needed on shorter timeframes)
Historical S/R Zones:
Shows previous support and resistance levels to provide context.
Default: 2 historical zones (shows current + 2 previous)
Range: 0-3 zones
Visual Hierarchy: Older zones are more transparent with dashed borders
Usage: Higher numbers (2-3) show more historical context but can clutter the chart. Start with 2 and adjust based on your preference.
Live Structure Feature (Yellow Warning ⚠):
Provides early warning of potential structure changes before full confirmation.
What it does: Detects potential swing highs/lows after just 2 bars instead of waiting for full swing_length confirmation
Live Peak: Shows when a high is followed by 2 lower closes (potential top forming)
Live Trough: Shows when a low is followed by 2 higher closes (potential bottom forming)
Important: These are UNCONFIRMED - they may be invalidated if price reverses
Use case: Get early awareness of potential reversals while waiting for confirmation
Displayed in: Info table only (no visual markers on chart to reduce clutter)
Only shows: Peaks higher than last swing high, or troughs lower than last swing low (filters out noise)
Higher Timeframe (HTF) Analysis:
View higher timeframe ICC structure while trading on lower timeframes.
How to enable: Toggle "Show Higher Timeframe ICC" ON
Setup: Set "Higher Timeframe" to your reference timeframe
Example: Trading on 15-minute? Set HTF to 240 (4-hour) or 60 (1-hour)
Example: Trading on 5-minute? Set HTF to 60 (1-hour) or 15 (15-minute)
What it shows:
HTF indication levels displayed as dashed lines
Blue = HTF Bullish Indication
Purple = HTF Bearish Indication
HTF phase and levels shown in info table
Trading workflow:
Check HTF phase for overall market direction
Wait for HTF correction phase
Drop to lower timeframe to find precise entries
Enter when lower TF shows continuation in alignment with HTF
Best practice: HTF should be 3-4x your trading timeframe for best results
Reversal Entries Toggle:
Default: ON (shows all signal types)
Toggle OFF for more conservative trading (only trend continuation signals)
Recommended: Backtest with both settings to see which works better for your style
New traders should consider disabling reversal entries initially
Volatility-Based Zones:
When enabled, support/resistance zones automatically adjust their height based on ATR (Average True Range).
More volatile = wider zones
Less volatile = tighter zones
Toggle OFF for fixed-width zones
Community Feedback Welcome:
This is an evolving project and your input is valuable! Please share:
Bug reports and issues you encounter
Feature requests and suggestions for improvement
Results from your backtesting and live trading experience
Feedback on the reversal entry feature (too aggressive? working well?)
Ideas for better aligning with the ICC methodology
Perfect for traders learning or implementing the ICC methodology with the benefit of modern automation, multi-timeframe analysis, and flexible entry signal options.

RCV Essentials════════════════════════════════════════════
RCV ESSENTIALS - MULTI-TIMEFRAME & SESSION ANALYSIS TOOL
════════════════════════════════════════════
📊 WHAT THIS INDICATOR DOES
This professional-grade indicator combines two powerful analysis modules:
1. TRADING SESSION TRACKER - Visualizes high/low ranges for major global market sessions (NY Open, London Open, Asian Session, etc.)
2. MULTI-TIMEFRAME CANDLE DISPLAY - Shows up to 8 higher timeframes simultaneously on your chart (15m, 30m, 1H, 4H, 1D, 1W, 1M, 3M)
════════════════════════════════════════════
🎯 KEY FEATURES
════════════════════════════════════════════
TRADING SESSIONS MODULE:
✓ Track up to 6 custom trading sessions simultaneously
✓ Real-time high/low range detection during active sessions
✓ Pre-configured for NYO (7-9am), LNO (2-3am), Asian Session (4:30pm-12am)
✓ 60+ global timezone options
✓ Customizable colors, labels, and transparency
✓ Daily divider lines (optional Sunday skip for traditional markets)
✓ Only displays on ≤30m timeframes for optimal clarity
MULTI-TIMEFRAME CANDLES MODULE:
✓ Display 1-8 higher timeframes with up to 10 candles each
✓ Real-time candle updates (non-repainting)
✓ Fully customizable colors (separate bullish/bearish for body/border/wick)
✓ Adjustable candle width, spacing, and positioning
✓ Smart label system (top/bottom/both, aligned or follow candles)
✓ Automatic timeframe validation (only shows TFs higher than chart)
✓ Memory-optimized with automatic cleanup
════════════════════════════════════════════
🔧 HOW IT WORKS
════════════════════════════════════════════
TECHNICAL IMPLEMENTATION:
Session Tracking Algorithm:
• Detects session start/end using time() function with timezone support
• Continuously monitors and updates high/low during active session
• Finalizes range when session ends using var persistence
• Draws boxes using real-time bar_index positioning
• Maintains session ranges across multiple days for reference
Multi-Timeframe System:
• Uses ta.change(time()) detection to identify new MTF candle formation
• Constructs candles using custom Type definitions (Candle, CandleSet, Config)
• Stores OHLC data in arrays with automatic size management
• Renders using box objects (bodies) and line objects (wicks)
• Updates current candle every tick; historical candles remain static
• Calculates dynamic positioning based on user settings (offset, spacing, width)
Object-Oriented Architecture:
• Custom Type "Candle" - Stores OHLC values, timestamps, visual elements
• Custom Type "CandleSet" - Manages arrays of candles + settings per timeframe
• Custom Type "Config" - Centralizes all display configuration
• Efficient memory management via unshift() for new candles, pop() for old
Performance Optimizations:
• var declarations minimize recalculation overhead
• Conditional execution (sessions only on short timeframes)
• Maximum display limits prevent excessive object creation
• Timeframe validation at barstate.isfirst reduces redundant checks
════════════════════════════════════════════
📈 HOW TO USE
════════════════════════════════════════════
SETUP:
1. Add indicator to chart (works best on 1m-30m timeframes)
2. Open Settings → "Trading Sessions" group
- Enable desired sessions (NYO, LNO, AS, or custom)
- Select your timezone from 60+ options
- Adjust colors and transparency
3. Open Settings → "Multi-TF Candles" group
- Enable timeframes (TF1-TF8)
- Configure each timeframe and display count
- Customize colors and layout
READING THE CHART:
• Session boxes show high/low ranges during active sessions
• MTF candles display to the right of current price
• Labels identify each timeframe (15m, 1H, 4H, etc.)
• Real-time updates on the most recent MTF candle
TRADING APPLICATIONS:
Session Breakout Strategy:
→ Identify session high/low (e.g., Asian session 16:30-00:00)
→ Wait for break above/below range
→ Confirm with higher timeframe candle close
→ Enter in breakout direction, stop at opposite side of range
Multi-Timeframe Confirmation:
→ Spot setup on primary chart (e.g., 5m)
→ Verify 15m, 1H, 4H candles align with trade direction
→ Only take trades where higher TFs confirm
→ Exit when higher TF candles show reversal
Combined Session + MTF:
→ Asian session establishes range overnight
→ London Open breaks Asian high
→ Confirm with bullish 15m + 1H candles
→ Enter long with stop below Asian high
════════════════════════════════════════════
🎨 ORIGINALITY & INNOVATION
════════════════════════════════════════════
What makes this indicator original:
1. INTEGRATED DUAL-MODULE DESIGN
Unlike separate session or MTF indicators, this combines both in a single performance-optimized script, enabling powerful correlation analysis between session behavior and timeframe structure.
2. ADVANCED RENDERING SYSTEM
Uses custom Pine Script v5 Types with dynamic box/line object management instead of basic plot functions. This enables:
• Precise visual control over positioning and spacing
• Real-time updates without repainting
• Efficient memory handling via automatic cleanup
• Support for 8 simultaneous timeframes with independent settings
3. INTELLIGENT SESSION TRACKING
The algorithm continuously recalculates ranges bar-by-bar during active sessions, then preserves the final range. This differs from static zone indicators that simply draw fixed boxes at predefined levels.
4. MODULAR ARCHITECTURE
Custom Type definitions (Candle, CandleSet, Config) create extensible, maintainable code structure while supporting complex multi-timeframe operations with minimal performance impact.
5. PROFESSIONAL FLEXIBILITY
Extensive customization: 6 configurable sessions, 8 timeframe slots, 60+ timezones, granular color/sizing/spacing controls, multiple label positioning modes—adaptable to any market or trading style.
6. SMART VISUAL DESIGN
Automatic timeframe validation, dynamic label alignment options, and intelligent spacing calculations ensure clarity even with multiple timeframes displayed simultaneously.
════════════════════════════════════════════
⚙️ CONFIGURATION OPTIONS
════════════════════════════════════════════
TRADING SESSIONS:
• Session 1-6: On/Off toggles
• Time Ranges: Custom start-end times
• Labels: Custom text for each session
• Colors: Individual color per session
• Timezone: 60+ options (Americas, Europe, Asia, Pacific, Africa)
• Range Transparency: 0-100%
• Outline: Optional border
• Label Display: Show/hide session names
• Daily Divider: Dotted lines at day changes
• Skip Sunday: For traditional markets vs 24/7 crypto
MULTI-TF CANDLES:
• Timeframes 1-8: Enable/disable individually
• Timeframe Selection: Any TF (seconds to months)
• Display Count: 1-10 candles per timeframe
• Bullish Colors: Body/Border/Wick (independent)
• Bearish Colors: Body/Border/Wick (independent)
• Candle Width: 1-10+ bars
• Right Margin: 0-200+ bars from edge
• TF Spacing: Gap between timeframe groups
• Label Color: Any color
• Label Size: Tiny/Small/Normal/Large/Huge
• Label Position: Top/Bottom/Both
• Label Alignment: Follow Candles or Align
════════════════════════════════════════════
📋 TECHNICAL SPECIFICATIONS
════════════════════════════════════════════
• Pine Script Version: v5
• Chart Overlay: True
• Max Boxes: 500
• Max Lines: 500
• Max Labels: 500
• Max Bars Back: 5000
• Update Frequency: Real-time (every tick)
• Timeframe Compatibility: Chart TF must be lower than selected MTFs
• Session Display: Activates only on ≤30 minute timeframes
• Memory Management: Automatic cleanup via array operations
