OpeningRange (Trading_Tix)Purpose:
The indicator highlights the high, low, and middle (50%) price levels of a specified session's opening range. These levels can serve as key support and resistance zones for trading strategies. The indicator also offers options to extend these levels beyond the session into later timeframes, making it useful for tracking breakout or trend continuation setups.
Key Features:
1. Session Detection:
The indicator identifies a specific session period using the user-defined Session Time. It calculates the start time, high, and low prices during this period:
rangeTime: Defines the session time range (default: 5:00 PM to 2:59 AM).
extendTime: Defines the extended time range where lines/backgrounds can be prolonged.
2. Opening Range Calculation:
High (high_val) and Low (low_val)**:
Tracks the highest and lowest prices during the session.
Middle Line:
A midpoint is calculated by averaging high_val and low_val.
3. Visual Elements:
Horizontal Lines:
Drawn at the high, low, and middle levels.
Customizable in width and color.
Shaded Background Box:
Covers the range between high and low prices.
The box’s color and transparency can be adjusted.
Line and Box Extension:
Optionally extends these elements into the extended time range.
4. Customization:
Users have the flexibility to:
Toggle visibility of lines, middle line, and background box.
Adjust colors, line thickness, and style.
Enable or disable the extension of lines and backgrounds into the extended period.
How It Works:
Initialization:
The script initializes variables to store range data (startTime, high_val, low_val) and drawing objects (lines, boxes).
It detects whether the current bar falls within the session (inSession) or extended timeframe (inExtend).
Plotting:
During the session:
Deletes previous lines and boxes from prior sessions.
Draws new lines at the high, low, and middle levels.
Creates a background box covering the range, if enabled.
During the extended period:
Extends the session lines and box, if the user has opted for extensions.
Updates:
Continuously adjusts the high/low values and updates the lines as new price data arrives.
Use Cases:
This indicator can be valuable for traders who:
Use the opening range to identify potential breakout zones.
Trade based on price consolidation within the range.
Want a visual representation of key price levels to plan entries and exits.
Would you like help refining this script further or adjusting its settings to match your trading style?
在脚本中搜索"track"

Rolling Beta against SPY📈 Pine Script Showcase: Rolling Beta Against SPY
Understanding how your favorite stock or ETF moves in relation to a benchmark like the S&P 500 can offer powerful insights into risk and exposure. This script calculates and visualizes the rolling beta of any asset versus the SPY ETF (which tracks the S&P 500).
🧠 What Is Beta?
Beta measures the sensitivity of an asset's returns to movements in the broader market. A beta of:
- 1.0 means the asset moves in lockstep with SPY,
- >1.0 indicates higher volatility than the market,
- <1.0 implies lower volatility or possible defensive behavior,
- <0 suggests inverse correlation (e.g., hedging instruments).
🧮 How It Works
This script computes rolling beta over a user-defined window (default = 60 periods) using classic linear regression math:
- Calculates daily returns for both the asset and SPY.
- Computes covariance between the two return streams.
- Divides by the variance of SPY returns to get beta.
⚙️ Customization
You can adjust the window size to control the smoothing:
- Shorter windows capture recent volatility changes,
- Longer windows give more stable, long-term estimates.
📊 Visual Output
The script plots the beta series dynamically, allowing you to observe how your asset’s correlation to SPY evolves over time. This is especially useful in regime-change environments or during major macroeconomic shifts.
💡 Use Cases
- Portfolio construction: Understand how your assets co-move with the market.
- Risk management: Detect when beta spikes—potentially signaling higher market sensitivity.
- Market timing: Use beta shifts to infer changing investor sentiment or market structure.
📌 Pro Tip: Combine this rolling beta with volatility, Sharpe ratio, or correlation tracking for a more robust factor-based analysis.
Ready to add a layer of quantitative insight to your chart? Add the script to your watchlist and start analyzing your favorite tickers against SPY today!

Dskyz (DAFE) Turning Point Indicator - Dskyz (DAFE) Turning Point Indicator — Smart Reversal Signals
Inspired by the intelligent logic of a pervious indicator I saw. This script represents a next-generation reversal detection system—completely re-engineered with cutting-edge filters, adaptive logic, and intelligent dashboards.
The Dskyz (DAFE) Turning Point Indicator
🧠 What Is It?
is designed to identify key market reversal zones with extraordinary accuracy by combining trend direction, volatility confirmation, price action patterns, and smart filtering layers—all visualized in a highly interactive and informative chart overlay.
This isn’t just a signal generator—it’s a decision-making assistant.
⚙️ Inputs & How to Use Them
All input fields are grouped for ease-of-use and explanation:
🔸 Reversal Logic Settings
Source: The price source used for signal generation (default: hlcc4). Can be changed to any standard price formula (open, close, hl2, etc.).
ATR Period: Used for determining volatility and dynamic trailing stop logic.
Supertrend Factor / Period: Calculates directional movement to detect trending vs choppy zones.
Reversal Sensitivity Thresholds: Internal logic filters minor pullbacks from true reversals.
🔸 Filters
Trend Filter: Enables trend-only signals (optional).
Volume Spike Filter: Confirms reversals with significant volume activity.
Volatility Zone Coloring: Visually highlights high-volatility areas to avoid late entries or fakeouts.
Custom High/Low Detection: Smart local top/bottom scanning to reinforce accuracy.
🔸 Visual & Dashboard Options
Signal Labels: Toggle signal labels on the chart.
Color Theme: Choose your visual theme for easier visibility.
Dashboard Toggle: Activate a compact dashboard summarizing strategy health (win rate, drawdown, trend state, volatility).
🧩 Functions Used
ta.supertrend(): Determines trend direction for signal confirmation and filtering.
ta.atr(): Calculates real-time volatility to determine trailing stop exits and visual zones.
ta.rsi() (internally optimized): Helps filter overbought/oversold conditions.
Local High/Low Scanner: Tracks recent pivots using a custom dynamic lookback.
Signal Engine: Consolidates multiple confirmation layers before plotting.
🚀 What Makes It Unique?
Unlike traditional reversal indicators, this one combines:
Multi-factor signal validation: No single indicator makes the call—volume, trend, price action, and volatility all contribute.
Adaptive filtering: The indicator evolves with the market—less noise, smarter signals.
Visual volatility heatmap zones: Avoid entering during uncertainty or manipulation spikes.
Interactive trend dashboard: Immediate insight into the strength and condition of the current market phase.
Highly customizable: Turn features on/off to match your trading style—scalping, swing, or trend-following.
Precision timing: Uses optimized versions of RSI and ATR that adjust automatically with price context.
🧬 Recommended for:
Commodity: Futures, Forex, Crypto
Timeframes: 1m to 1h for active traders. 4h+ for swing trades.
Pair With: Support/resistance zones, Fibonacci levels, and smart money concepts for additional confluence.
🎯 Why It Works
- Traditional reversal signals suffer from lag and noise. This system filters both by:
- Using multi-source confirmation, not just price movement.
-Tracking volatility directly, not assuming static markets.
-Detecting exhaustion, not just divergence.
-Keeping your screen clean, with only the most relevant data shown.
🧾 Credit & Acknowledgement
🧠 Original Concept Inspiration: This project was deeply inspired by the work of Enes_Yetkin_ and their approach to reversal detection. This version expands on the concept with additional technical layers, updated visuals, and real-time adaptability.
📌 Final Thoughts
This is more than a reversal tool. It's a market condition interpreter, entry/exit planner, and risk assistant all in one. Every aspect is engineered to give you an edge—especially when timing means everything.
Use it with discipline. Use it with clarity. Trade smarter.
**I will continue to release incredible strategies and indicators until I turn this into a brand or until someone offers me a contract.
-Dskyz

Market Clock with Inline HoursThis script displays a powerful, configurable market session clock that shows the open/closed status and trading hours for major global financial markets — including specialized logic for NY Futures (Globex).
🔑 Key Features:
✅ Real-Time Session Status:
Shows whether each selected market is currently OPEN or CLOSED, based on the user’s selected time zone.
✅ NY Futures Weekend Logic:
Built-in logic ensures NY Futures are marked CLOSED:
Friday after 5:00 PM ET
All of Saturday
Sunday until 6:00 PM ET
This reflects the true CME Globex trading schedule.
✅ 12-Hour Format + Timezone Labels:
Session hours are displayed in 12-hour AM/PM format alongside their associated timezone (EST, GMT, JST, etc.) for clarity.
✅ Fully Configurable Markets:
You can choose to display:
NY Market (RTH)
NY Futures (Globex)
London
Tokyo
Frankfurt
And you can easily toggle them on/off in the settings.
✅ Text Size & Position Customization:
Easily control the text size (tiny → huge) and screen position (top/bottom, left/center/right).
✅ Auto Timezone Offset Support:
Select from a list of common time zones (EST, UTC, JST, etc.), or enter your own custom UTC offset for global flexibility.
✅ Compact & Clean Design:
The layout groups each market’s:
Real-time OPEN/CLOSED status
Trading hours
All into a single column, making the layout clean and dashboard-ready.
🧠 Who is this for?
Day traders
Futures traders
Forex traders
Anyone who tracks multiple time zones or global markets
📌 Notes:
Clock updates based on chart timeframe (e.g., every 1m on a 1-minute chart)
Pine Script doesn't support real-time per-second updates, but works well for market status tracking
💬 Feedback Welcome!
This script was designed to be lightweight and user-friendly. Suggestions and improvements are always welcome — feel free to leave a comment or reach out directly.

MÈGAS ALGO : ZIG-ZAG CYCLE INSIGTH [INDICATOR]Overview
The Zig-Zag Cycle Insigth is a revisited version of the classic Zig Zag indicator, designed to provide traders with a more comprehensive and actionable view of price movements.
This advanced tool not only highlights significant price swings but also incorporates additional features such as cycle analysis, real-time data tracking, and Fibonacci retracement levels. These enhancements make it an invaluable resource for identifying trends, potential reversal points, and market structure.
This indicator adheres to TradingView's guidelines and is optimized for both technical analysts and active traders who seek deeper insights into market dynamics.
Key Features:
1. Customizable Thresholds for Price Movements:
- Users can set personalized thresholds for price movement percentages and time periods.
This ensures that only significant price swings are plotted, reducing noise and increasing
clarity.
- Straight lines connect swing highs and lows, providing a cleaner visual representation of
the trend.
2. Cycle Analysis Table:
- A dynamic table is included to analyze price cycles based on three key factors:
- Price Change: Measures the magnitude of each swing (high-to-low or low-to-high).
- Time Duration (Bar Count): Tracks the number of bars elapsed between consecutive swings,
offering precise timing insights.
- Volume: Analyzes trading volume during each segment of the cycle.
- The indicator calculates the **maximum**, **minimum**, and **mean** values for each
parameter across all completed cycles, providing deeper statistical insights into market
behavior.
- This table updates in real-time, offering traders a quantitative understanding of how price
behaves over different cycles.
3. Real-Time Data Integration:
- The indicator displays live updates of current price action relative to the last identified
swing high/low. This includes:
- Current distance from the last pivot point.
- Percentage change since the last pivot.
- Volume traded since the last pivot.
4. Fibonacci Retracement Levels:
- Integrated Fibonacci retracement levels are dynamically calculated based on the most
recent significant swing high and low.
- Key retracement levels (23.6%, 38.2%, 50%, 61.8%, and 78.6%) are plotted alongside the Zig
Zag lines, helping traders identify potential support/resistance zones.
- Extension levels (100%, 161.8%, etc.) are also included to anticipate possible breakout
targets.
5. Customizable Alerts:
- Users can configure alerts for specific real-time conditions, such as:
- Price Change
- Duration
- Volume
- Fibonacci Retracement Levels
How It Works:
1. Zig Zag Identification:
- The indicator scans historical price data to identify significant turning points where the
price moves by at least the user-defined percentage threshold.
- These turning points are connected by straight lines to form the Zig Zag pattern.
2. Cycle Analysis:
For each completed cycle (from one swing high/low to the next), the indicator calculates:
- Price Change: Difference between the start and end prices of the cycle.
- Maximum Price Change: The largest price difference observed across all cycles.
- Minimum Price Change: The smallest price difference observed across all cycles.
- Mean Price Change: The average price difference across all cycles.
- Time Duration (Bar Count): Number of bars elapsed between consecutive swings.
- Maximum Duration: The longest cycle in terms of bar count.
- Minimum Duration: The shortest cycle in terms of bar count.
- Mean Duration: The average cycle length in terms of bar count.
- Volume: Total volume traded during the cycle.
- Maximum Volume: The highest volume traded during any single cycle.
- Minimum Volume: The lowest volume traded during any single cycle.
- Mean Volume: The average volume traded across all cycles.
- These calculations provide traders with a statistical overview of market behavior, enabling
them to identify patterns and anomalies in price, time, and volume.
3. Fibonacci Integration:
- Once a new swing high or low is identified, the indicator automatically calculates Fibonacci
retracement and extension levels.
- These levels serve as reference points for potential entry/exit opportunities.
4. Real-Time Updates:
- As the market evolves, the indicator continuously monitors the relationship between the
current price and the last identified swing point.
- Real-time metrics, such as percentage change and volume, are updated dynamically.
5. Alerts Based on Real-Time Parameters:
- The indicator allows users to set customizable alerts based on real-time conditions:
- Price Change Alert: Triggered when the real-time price change is less or greater than a
predefined percentage threshold (e.g., > or < fixed value).
- Duration Alert: Triggered when the cycle duration (in bars) is less or greater than a
predefined
bar count threshold (e.g., > or < fixed value).
- Volume Alert: Triggered when the trading volume during the current cycle is less or greater
than a predefined volume threshold (e.g., > or < fixed value).
Advantages of Zig-Zag Cycle Insigth
- Comprehensive Insights: Combining cycle analysis, Fibonacci retracements, and real-time data
provides a holistic view of market conditions.
- Statistical Analysis: The inclusion of maximum, minimum, and mean values for price change,
duration, and volume offers deeper insights into market behavior.
- Actionable Signals: Customizable alerts ensure traders never miss critical market events based
on real-time price, duration, and volume parameters.
- User-Friendly Design: Clear visuals and intuitive controls make it accessible for traders of all
skill levels.
Reference:
TradingView/ZigZag
TradingView/AutofibRetracement
Please Note:
This indicator is provided for informational and educational purposes only. It is not financial advice, and it should not be considered a recommendation to buy, sell, or trade any financial instrument. Trading involves significant risks, including the potential loss of your entire investment. Always conduct your own research and consult with a licensed financial advisor before making any trading decisions.
The results and images provided are based on algorithms and historical/paid real-time market data but do not guarantee future results or accuracy. Use this tool at your own risk, and understand that past performance is not indicative of future outcomes.

Multi-timeframe Trend & Momentum DashboardMulti-Timeframe Trend & Momentum Dashboard
This indicator is a comprehensive multi-timeframe analysis tool designed for traders who want to quickly assess market trends and momentum across several timeframes. It combines trend detection with duration tracking and displays key information in an easy-to-read on-chart table. Key features include:
Multi-Timeframe Analysis:
Analyzes nine different timeframes (from 1-minute up to 1-week) simultaneously, helping you gauge the overall market trend at a glance.
Trend Detection & Duration:
Uses a combination of a short-term EMA and a long-term SMA to determine whether the market is bullish, bearish, or neutral. It also tracks how long the current trend has persisted in terms of consecutive bars and displays this duration next to each timeframe.
RSI Display & Visual Alerts:
Calculates the RSI for each timeframe. RSI values are color-coded—green when above 50 (indicating bullish momentum) and red when below 50 (indicating bearish conditions). Additionally, if the market is bearish on a particular timeframe while the RSI is above 50, the RSI cell flashes yellow to alert you of a potential trend reversal or divergence.
On-Chart Trend Start Markers:
When a new trend is detected on your current chart’s timeframe, the indicator automatically marks the bar with a label showing the new trend direction, providing a clear visual cue for trend changes.
This powerful tool is perfect for traders looking to combine multi-timeframe trend analysis with momentum indicators, enabling a more informed and dynamic trading strategy. Whether you’re a day trader or swing trader, the Multi-Timeframe Trend & Momentum Dashboard brings clarity to market conditions across multiple time horizons.

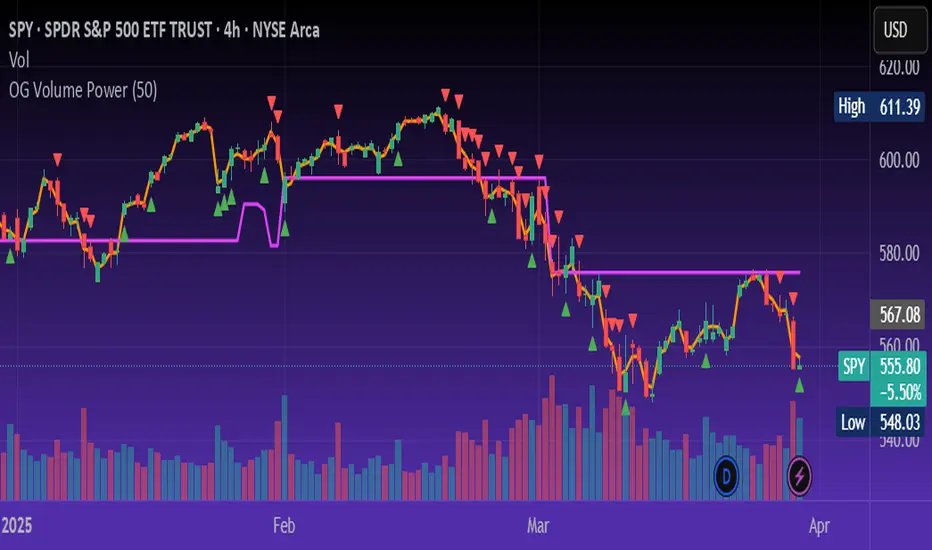
OG Volume PowerDescription:
The OG Volume Power is an elite-level volume analysis suite built for identifying momentum surges, trend continuation, and buyer/seller imbalances at critical price levels. It combines real-time VWAP tracking, a dynamic Point of Control (POC), and volume delta clusters to give traders a complete picture of price and volume interaction.
🔍 Key Features:
Real-Time VWAP:
Tracks volume-weighted average price to identify mean reversion and intraday fair value zones. Ideal for institutional-level entries and exits.
Dynamic POC (Point of Control):
Automatically finds the price level with the highest volume over the last N candles (default 50), helping traders pinpoint where market participants are most committed.
Buyer/Seller Volume Delta Clusters:
Highlights imbalances between buying and selling pressure using bullish and bearish volume deltas that exceed the 20-bar volume average — excellent for momentum detection and early trend recognition.
⚙️ How It Works:
Green triangle: Buyer surge (bullish delta + above average volume)
Red triangle: Seller surge (bearish delta + above average volume)
Magenta line: Dynamic POC (highest volume price over recent candles)
Orange line: VWAP (acts as a magnetic force for price)
📈 Best For:
Intraday scalping or swing trading on SPY, QQQ, BTC, or Forex
Volume flow confirmation before breakout entries
Filtering false breakouts with delta strength signals
🧠 Pro Tip:
Use OG Volume Power alongside your trend indicators (like OG EMA Stack or OG Supertrend) to confirm that volume is backing the move. Look for surges near VWAP or POC zones for sniper-level entries.
BAS EnhancedBAS Enhanced Indicator – A Powerful Market Trend & Volatility Tool
The BAS Enhanced Indicator is a cutting-edge trading tool designed to help traders analyze market trends, volatility, and price momentum with precision. This indicator builds upon traditional Bollinger Bands concepts, integrating adaptive price action tracking, dynamic band width analysis, and advanced smoothing techniques to generate clear and actionable trading insights.
🔹 Key Features & Benefits:
✅ Smart Price Selection – Choose between Close, High, Low, HL2, or HLC3 to tailor the indicator to different market conditions.
✅ Dynamic Band Analysis – Measures price movements relative to dynamically calculated upper and lower bands for real-time market assessment.
✅ Volatility & Trend Strength Measurement – The indicator uses a unique Width Calculation (wd) to gauge market volatility, helping traders understand the strength of price movements.
✅ Composite Indicator Calculation – Combines price position and band width with customizable power functions to provide a more refined momentum signal.
✅ Smoothing for Accuracy – Uses Exponential Moving Average (EMA) and Simple Moving Average (SMA) for a clearer trend visualization, reducing noise in volatile markets.
✅ Two Signal Lines for Confirmation – Includes customizable bullish and bearish signal lines, allowing traders to identify breakouts and reversals with greater confidence.
✅ Visual & Alert-Based Trading Signals – The indicator plots:
Smoothed Composite Indicator (Blue Line) – Tracks market momentum
%D Moving Average (Red Line) – A secondary smoothing layer for trend confirmation
Mid Values (Orange & Purple Lines) – Additional volatility references
Signal Lines (Green & Red Horizontal Lines) – Key breakout levels
✅ Built-in Alerts for Trade Signals – Get notified instantly when:
Bullish Alert 🚀 – The indicator crosses above the upper signal line
Bearish Alert 📉 – The indicator crosses below the lower signal line
📈 How to Use the BAS Enhanced Indicator?
🔹 Trend Trading: Use crossovers above Signal Line 2 as a potential buy signal and crossovers below Signal Line 1 as a potential sell signal.
🔹 Volatility Monitoring: When the band width (wd) expands, market volatility is increasing – ideal for breakout traders. When wd contracts, market volatility is low, signaling potential consolidation.
🔹 Momentum Confirmation: Use the %D Moving Average to confirm sustained trend movements before entering a trade.
🚀 Why Use BAS Enhanced?
This indicator is perfect for day traders, swing traders, and trend-followers looking to enhance their market timing, filter false signals, and improve decision-making. Whether you're trading stocks, forex, or crypto, BAS Enhanced helps you stay ahead of market movements with precision and clarity.
🔔 Add BAS Enhanced to your TradingView toolkit today and trade smarter with confidence!

Percentage Based ZigZag█ OVERVIEW
The Percentage-Based ZigZag indicator is a custom technical analysis tool designed to highlight significant price reversals while filtering out market noise. Unlike many standard zigzag tools that rely solely on fixed price moves or generic trend-following methods, this indicator uses a configurable percentage threshold to dynamically determine meaningful pivot points. This approach not only adapts to different market conditions but also helps traders distinguish between minor fluctuations and truly significant trend shifts—whether scalping on shorter timeframes or analyzing longer-term trends.
█ KEY FEATURES & ORIGINALITY
Dynamic Pivot Detection
The indicator identifies pivot points by measuring the percentage change from the previous extreme (high or low). Only when this change exceeds a user-defined threshold is a new pivot recognized. This method ensures that only substantial moves are considered, making the indicator robust in volatile or noisy markets.
Enhanced ZigZag Visualization
By connecting significant highs and lows with a continuous line, the indicator creates a clear visual map of price swings. Each pivot point is labelled with the corresponding price and the percentage change from the previous pivot, providing immediate quantitative insight into the magnitude of the move.
Trend Reversal Projections
In addition to marking completed reversals, the script computes and displays potential future reversal points based on the current trend’s momentum. This forecasting element gives traders an advanced look at possible turning points, which can be particularly useful for short-term scalping strategies.
Customizable Visual Settings
Users can tailor the appearance by:
• Setting the percentage threshold to control sensitivity.
• Customizing colors for bullish (e.g., green) and bearish (e.g., red) reversals.
• Enabling optional background color changes that visually indicate the prevailing trend.
█ UNDERLYING METHODOLOGY & CALCULATIONS
Percentage-Based Filtering
The script continuously monitors price action and calculates the relative percentage change from the last identified pivot. A new pivot is confirmed only when the price moves a preset percentage away from this pivot, ensuring that minor fluctuations do not trigger false signals.
Pivot Point Logic
The indicator tracks the highest high and the lowest low since the last pivot. When the price reverses by the required percentage from these extremes, the algorithm:
1 — Labels the point as a significant high or low.
2 — Draws a connecting line from the previous pivot to the current one.
3 — Resets the extreme-tracking for detecting the next move.
Real-Time Reversal Estimation
Building on traditional zigzag methods, the script incorporates a projection calculation. By analyzing the current trend’s strength and recent percentage moves, it estimates where a future reversal might occur, offering traders actionable foresight.
█ HOW TO USE THE INDICATOR
1 — Apply the Indicator
• Add the Percentage-Based ZigZag indicator to your trading chart.
2 — Adjust Settings for Your Market
• Percentage Move – Set a threshold that matches your trading style:
- Lower values for sensitive, high-frequency analysis (ideal for scalping).
- Higher values for filtering out noise on longer timeframes.
• Visual Customization – Choose your preferred colors for bullish and bearish signals and enable background color changes for visual trend cues.
• Reversal Projection – Enable or disable the projection feature to display potential upcoming reversal points.
3 — Interpret the Signals
• ZigZag Lines – White lines trace significant high-to-low or low-to-high movements, visually connecting key swing points.
• Pivot Labels – Each pivot is annotated with the exact price level and percentage change, providing quantitative insight into market momentum.
• Trend Projections – When enabled, projected reversal levels offer insight into where the current trend might change.
4 — Integrate with Your Trading Strategy
• Use the indicator to identify support and resistance zones derived from significant pivots.
• Combine the quantitative data (percentage changes) with your risk management strategy to set optimal stop-loss and take-profit levels.
• Experiment with different threshold settings to adapt the indicator for various instruments or market conditions.
█ CONCLUSION
The Percentage-Based ZigZag indicator goes beyond traditional trend-following tools by filtering out market noise and providing clear, quantifiable insights into price action. With its percentage threshold for pivot detection and real-time reversal projections, this original methodology and customizable feature set offer traders a versatile edge for making informed trading decisions.

Trend CounterTREND COUNTER is a Trend Exhaustion Indicator that tracks the persistence of price movements over a series of bars, helping traders identify potential trend exhaustion and reversals.
It compares each bar's value (typically the closing price) to a previous bar from a set lookback period (the lookback bar), counting consecutive bullish or bearish price movements.
The count resets when the trend reverses, signaling a potential shift in momentum.
• Price movement is considered bullish if the current price exceeds the lookback bar's price, incrementing the bullish count with each consecutive occurrence.
• Price movement is considered bearish if the current price is lower than the lookback bar's price, incrementing the bearish count with each consecutive occurrence.
• The count resets when the trend reverses.
• The user sets the threshold for sequence resets by defining the maximum number of consecutive occurrences.
• The count may reset before a trend reversal if it surpasses the user-defined threshold.
This type of indicator is useful for detecting trends, trend exhaustion, overbought or oversold conditions, and potential reversal points, helping traders anticipate market turns.
• Sequential occurrences gauge trend strength.
A long sequence of bullish bars suggests strong upward momentum, while consecutive bearish bars indicate sustained downward pressure.
This helps traders assess whether a trend is likely to continue or weaken.
• Identify thresholds for potential reversal points.
Counting consecutive bullish or bearish price movements can highlight overextended trends.
A trend reaching a predefined threshold may signal an upcoming reversal or momentum slowdown.
• Identify potential entry or exit points.
If trends are showing signs of exhaustion after a certain number of consecutive price movements, traders may use this for timing adjustments to their position.
• Assess risk.
Understanding trend strength helps traders better adjust stop-loss or take-profit levels.
Sequential counting provides a structured approach to trade management.
Visualization & Customization
The Sequential Momentum indicator visually represents consecutive bullish or bearish price movements to define trends and highlight key shifts.
• The bullish/bearish bar sequences are based on user-defined thresholds.
• Customizable bar coloring, labels, and plot shapes enhanced trend visualization.
• Dynamic color transitions make trend shifts easily identifiable.
Tracking consecutive bullish or bearish price movements can be effective when combined with other indicators or applied in specific market conditions (e.g., trending or volatile markets).
However, its reliability depends on market conditions and the trader’s interpretation.
This indicator is best used as a complementary tool rather than a standalone signal, helping traders visualize and quantify market momentum within a broader strategy.
Uptrick: Alpha TrendIntroduction
Uptrick: Alpha Trend is a comprehensive technical analysis indicator designed to provide traders with detailed insights into market trends, momentum, and risk metrics. It adapts to various trading styles—from quick scalps to longer-term positions—by dynamically adjusting its calculations and visual elements. By combining multiple smoothing techniques, advanced color schemes, and customizable data tables, the indicator offers a holistic view of market behavior.
Originality
The Alpha Trend indicator distinguishes itself by blending established technical concepts with innovative adaptations. It employs three different smoothing techniques tailored to specific trading modes (Scalp, Swing, and Position), and it dynamically adjusts its parameters to match the chosen mode. The indicator also offers a wide range of color palettes and multiple on-screen tables that display key metrics. This unique combination of features, along with its ability to adapt in real time, sets it apart as a versatile tool for both novice and experienced traders.
Features
1. Multi-Mode Trend Line
The indicator automatically selects a smoothing method based on the trading mode:
- Scalp Mode uses the Hull Moving Average (HMA) for rapid responsiveness.
- Swing Mode employs the Exponential Moving Average (EMA) for balanced reactivity.
- Position Mode applies the Weighted Moving Average (WMA) for smoother, long-term trends.
Each method is chosen to best capture the price action dynamics appropriate to the trader’s timeframe.
2. Adaptive Momentum Thresholds
It tracks bullish and bearish momentum with counters that increment as the trend confirms directional movement. When these counters exceed a user-defined threshold, the indicator generates optional buy or sell signals. This approach helps filter out minor fluctuations and highlights significant market moves.
3. Gradient Fills
Two types of fills enhance visual clarity:
- Standard Gradient Fill displays ATR-based zones above and below the trend line, indicating potential bullish and bearish areas.
- Fading Gradient Fill creates a smooth transition between the trend line and the price, visually emphasizing the distance between them.
4. Bar Coloring and Signal Markers
The indicator can color-code bars based on market conditions—bullish, bearish, or neutral—allowing for immediate visual assessment. Additionally, signal markers such as buy and sell arrows are plotted when momentum thresholds are breached.
5. Comprehensive Data Tables
Uptrick: Alpha Trend offers several optional tables for detailed analysis:
- Insider Info: Displays key metrics like the current trend value, bullish/bearish momentum counts, and ATR.
- Indicator Metrics: Lists input settings such as trend length, damping, signal threshold, and net momentum.
- Market Analysis: Summarizes overall trend direction, trend strength, Sortino ratio, return, and volatility.
- Price & Trend Dynamics: Details price deviation from the trend, trend slope, and ATR ratio.
- Momentum & Volatility Insights: Presents RSI, standard deviation (volatility), and net momentum.
- Performance & Acceleration Metrics: Focuses on the Sortino ratio, trend acceleration, return, and trend strength.
Each table can be positioned flexibly on the chart, allowing traders to customize the layout according to their needs.
Why It Combines Specific Smoothing Techniques
Smoothing techniques are essential for filtering out market noise and revealing underlying trends. The indicator combines three smoothing methods for the following reasons:
- The Hull Moving Average (HMA) in Scalp Mode minimizes lag and responds quickly to price changes, which is critical for short-term trading.
- The Exponential Moving Average (EMA) in Swing Mode gives more weight to recent data, striking a balance between speed and smoothness. This makes it suitable for mid-term trend analysis.
- The Weighted Moving Average (WMA) in Position Mode smooths out short-term fluctuations, offering a clear view of longer-term trends and reducing the impact of transient market volatility.
By using these specific methods in their respective trading modes, the indicator ensures that the trend line is appropriately responsive for the intended time frame, enhancing decision-making while maintaining clarity.
Inputs
1. Trend Length (Default: 30)
Defines the lookback period for the smoothing calculation. A shorter trend length results in a more responsive line, while a longer length produces a smoother, less volatile trend.
2. Trend Damping (Default: 0.75)
Controls the degree of smoothing applied to the trend line. Lower values lead to a smoother curve, whereas higher values increase sensitivity to price fluctuations.
3. Signal Strength Threshold (Default: 5)
Specifies the number of consecutive bullish or bearish bars required to trigger a signal. Higher thresholds reduce the frequency of signals, focusing on stronger moves.
4. Enable Bar Coloring (Default: True)
Toggles whether each price bar is colored to indicate bullish, bearish, or neutral conditions.
5. Enable Signals (Default: True)
When enabled, this option plots buy or sell arrows on the chart once the momentum thresholds are met.
6. Enable Standard Gradient Fill (Default: False)
Activates ATR-based gradient fills around the trend line to visualize potential support and resistance zones.
7. Enable Fading Gradient Fill (Default: True)
Draws a gradual color transition between the trend line and the current price, emphasizing their divergence.
8. Trading Mode (Options: Scalp, Swing, Position)
Determines which smoothing method and ATR period to use, adapting the indicator’s behavior to short-term, medium-term, or long-term trading.
9. Table Position Inputs
Allows users to select from nine possible chart positions (top, middle, bottom; left, center, right) for each data table.
10. Show Table Booleans
Separate toggles control the display of each table (Insider Info, Indicator Metrics, Market Analysis, and the three Deep Tables), enabling a customized view of the data.
Color Schemes
(Default) - The colors in the preview image of the indicator.
(Emerald)
(Sapphire)
(Golden Blaze)
(Mystic)
(Monochrome)
(Pastel)
(Vibrant)
(Earth)
(Neon)
Calculations
1. Trend Line Methods
- Scalp Mode: Utilizes the Hull Moving Average (HMA), which computes two weighted moving averages (one at half the length and one at full length), subtracts them, and then applies a final weighted average based on the square root of the length. This method minimizes lag and increases responsiveness.
- Swing Mode: Uses the Exponential Moving Average (EMA), which assigns greater weight to recent prices, thus balancing quick reaction with smoothness.
- Position Mode: Applies the Weighted Moving Average (WMA) to focus on longer-term trends by emphasizing the entire lookback period and reducing the impact of short-term volatility.
2. Momentum Tracking
The indicator maintains separate counters for bullish and bearish momentum. These counters increase as the trend confirms directional movement and reset when the trend reverses. When a counter exceeds the defined signal strength threshold, a corresponding signal (buy or sell) is triggered.
3. Volatility and ATR Zones
The Average True Range (ATR) is calculated using a period that adapts to the selected trading mode (shorter for Scalp, longer for Position). The ATR value is then used to define upper and lower zones around the trend line, highlighting the current level of market volatility.
4. Return and Trend Acceleration
- Return is calculated as the difference between the current and previous closing prices, providing a simple measure of price change.
- Trend Acceleration is derived from the change in the trend line’s movement (its first derivative) compared to the previous bar. This metric indicates whether the trend is gaining or losing momentum.
5. Sortino Ratio and Standard Deviation
- The Sortino Ratio measures risk-adjusted performance by comparing returns to downside volatility (only considering negative price changes).
- Standard Deviation is computed over the lookback period to assess the extent of price fluctuations, offering insights into market stability.
Usage
This indicator is suitable for various time frames and market instruments. Traders can enable or disable specific visual elements such as gradient fills, bar coloring, and signal markers based on their preference. For a minimalist approach, one might choose to display only the primary trend line. For a deeper analysis, enabling multiple tables can provide extensive data on momentum, volatility, trend dynamics, and risk metrics.
Important Note on Risk
Trading involves inherent risk, and no indicator can eliminate the uncertainty of the markets. Past performance is not indicative of future results. It is essential to use proper risk management, test any new tool thoroughly, and consult multiple sources or professional advice before making trading decisions.
Conclusion
Uptrick: Alpha Trend unifies a diverse set of calculations, adaptive smoothing techniques, and customizable visual elements into one powerful tool. By combining the Hull, Exponential, and Weighted Moving Averages, the indicator is able to provide a trend line that is both responsive and smooth, depending on the trading mode. Its advanced color schemes, gradient fills, and detailed data tables deliver a comprehensive analysis of market trends, momentum, and risk. Whether you are a short-term trader or a long-term investor, this indicator aims to clarify price action and assist you in making more informed trading decisions.

ZenAlgo - QZenAlgo - Q
Description
ZenAlgo - Q is an oscillator based on the QQE (Quantitative Qualitative Estimation) method. This version incorporates refinements for additional visualization and interpretation options. It is designed to help traders observe momentum changes and divergence patterns in price movements.
Key Features
QQE-Based Calculation : Derived from the open-source QQE script by Glaz (Metastock Version of QQE), with modifications for alternative visualization.
Dual RSI-Based Analysis : Uses two RSI calculations to provide additional context on price movements.
Adaptive Trend Bands : Adjust dynamically based on the market conditions.
Divergence Identification : Highlights potential differences between price action and oscillator movement.
Dynamic Color Coding : Displays histogram bars to illustrate shifts in oscillator values.
Configurable Alerts : Enables notifications for specific oscillator conditions.
How It Works
The indicator calculates a smoothed RSI-based oscillator that tracks the relative strength of price movement. It applies an exponential moving average (EMA) smoothing to reduce noise while maintaining responsiveness.
Two adaptive bands are calculated using a variation of the QQE method, which helps define dynamic overbought and oversold conditions.
The histogram bars shift in color based on the position of the oscillator relative to the bands. Lighter shades indicate weaker momentum, while stronger momentum is represented by more saturated colors.
The script also includes a secondary RSI component, which provides an additional layer of analysis. This secondary RSI helps refine momentum trends by smoothing out short-term fluctuations.
Divergence identification is built-in, highlighting where price action deviates from oscillator readings. Bullish divergence occurs when price forms a lower low while the oscillator forms a higher low, and bearish divergence is identified when price forms a higher high while the oscillator forms a lower high.
The indicator does not generate buy or sell signals but instead provides contextual information that can be used alongside other trading strategies.
Use Cases
Trend Observation : Traders can use the histogram to observe whether momentum is strengthening or weakening over time. A shift in color can indicate a potential change in trend strength.
Divergence Analysis : By comparing oscillator divergence with price movement, traders can identify situations where price action may be losing momentum. Divergences do not guarantee reversals but can serve as an early warning to re-evaluate positions.
Momentum Tracking : The dual RSI structure allows users to monitor both short-term and long-term momentum. When both RSI components are aligned, it suggests a more stable trend, while divergence between them may indicate potential consolidation or trend shifts.
Supplementary Analysis : This indicator is best used as a supporting tool alongside volume-based or trend-following indicators. It helps visualize underlying price behavior but should not be used in isolation for decision-making.
Market Context Interpretation : The combination of adaptive bands and histogram visualization allows traders to assess how recent price action compares to historical movement, helping to place current conditions in a broader market context.
Attribution
This script is an adaptation of the open-source QQE script originally developed by Glaz. We acknowledge and appreciate the original author's work, which served as a foundation for our modifications.
Disclaimer
This indicator is intended for informational purposes only. It should not be interpreted as financial advice. Always conduct independent research and risk management before making trading decisions.

VWAP Suite by Augur - Multi PeriodOverview
The Multi-Timeframe VWAP Suite revolutionizes price analysis by combining institutional-grade volume-weighted pricing with multi-period deviation analytics. This professional toolkit simultaneously tracks VWAP across 5 time horizons (Daily to Yearly) with smart deviation bands, offering traders unparalleled insight into market structure and volatility dynamics.
Key Features
Multi-Timeframe VWAP Matrix
Simultaneous Daily/Weekly/Monthly/Quarterly/Yearly VWAP tracking
Institutional-level volume-weighted calculations
Independent timeframe toggles for focused analysis
Smart Deviation Architecture
Dual-layer standard deviation bands (1σ & 2σ)
Separate colors for upper/lower deviation zones
Adaptive 95% transparency fills for layered visualization
Professional Visual Design
Strategic color coding per timeframe (FIXED palette)
Dark Blue/Yellow/Purple/Pink/Red VWAP hierarchy
Orange-Green-Red-Blue deviation band system
Advanced Calculation Engine
HLC3 price source integration
Cumulative volume-weighting algorithm
Real-time standard deviation updates

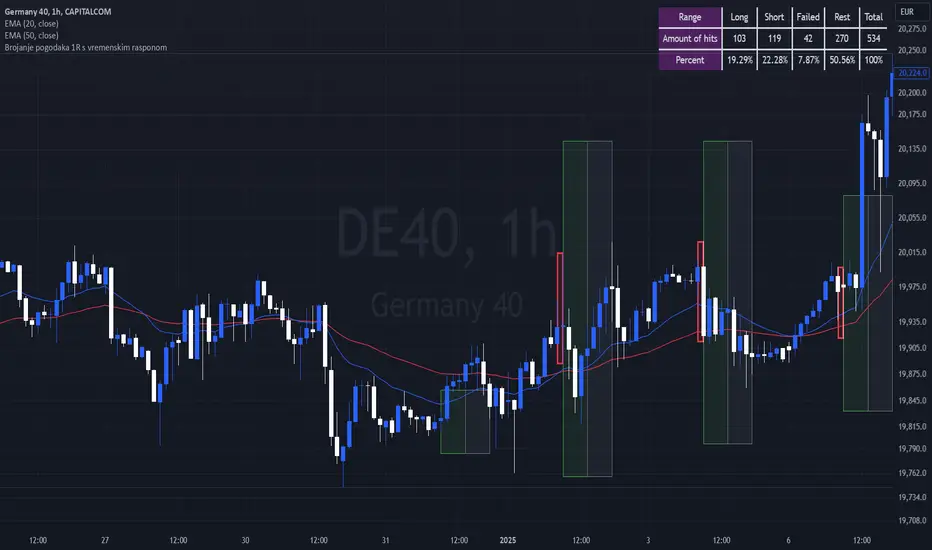
Breakout Josip strategy is focused on analyzing price movements during specific time intervals (from 9:00 AM to 12:00 PM) each day. It tracks the highest and lowest prices in that period and uses them to set targets for potential trades, placing horizontal lines based on these levels. Additionally, you're interested in tracking the success and failure of trades based on whether price breaks certain levels during this time range. The strategy also calculates various metrics like the percentage of successful trades, failed trades, and total trades during a selected time range.
Dynamic Market Structure DetectorTitle: Dynamic Market Structure Detector – Real-Time BoS & ChoCH Signals
Short Description:
Identify market structure dynamically with real-time Break of Structure (BoS) and Change of Character (ChoCH) signals. Highlight untested support and resistance zones to improve trading precision.
Full Description:
The Dynamic Market Structure Detector is a powerful TradingView indicator designed for traders who want to automate the identification of key market structure levels. This indicator simplifies market analysis by dynamically tracking swing highs and lows, marking critical Break of Structure (BoS) and Change of Character (ChoCH) points, and highlighting untested support and resistance zones.
Key Features:
1. Real-Time Signals:
• Marks Break of Structure (BoS) and Change of Character (ChoCH) points as they occur.
• Automatically updates as the market evolves.
2. Dynamic Swing Highs and Lows:
• Tracks swing highs and lows based on user-defined sensitivity (Swing Length).
• Adjust swing length to tailor signals for intraday or swing trading.
3. Untested Zones Highlight:
• Visualize untested support and resistance zones dynamically.
• Opacity settings allow customization for better chart readability.
4. Customizable Inputs:
• Swing Length:
Adjust the sensitivity of BoS and ChoCH signals.
• Smaller Swing Length values (e.g., 3–5): Capture short-term market movements, ideal for intraday trading.
• Larger Swing Length values (e.g., 10–20): Focus on significant market structure changes for swing or positional trading.
Experiment with these values to find the best fit for your trading style.
• Untested Zone Opacity:
Control the visibility of highlighted support and resistance zones.
• Lower opacity values (e.g., 10–50): Make the zones more prominent, helpful for darker chart backgrounds.
• Higher opacity values (e.g., 70–90): Provide subtle highlights, better suited for lighter chart setups.
• A value of 100% renders the zones completely transparent (invisible).
Use this setting to customize the visual appearance of your chart while still retaining key zone information.
5. User-Friendly Visualization:
• Color-coded labels for BoS (Green) and ChoCH (Red).
• Highlight zones for untested areas using customizable colors (Support: Blue, Resistance: Orange).
Why Use This Indicator?
• Simplifies market structure analysis by automating key calculations.
• Helps traders identify potential trend reversals and continuation points.
• Reduces the need for manual charting, saving time and effort.
• Provides visual clarity on untested zones for better decision-making.
Recommended Usage:
• Intraday Traders: Use smaller Swing Length values (e.g., 3–5) to capture short-term market movements.
• Swing Traders: Opt for higher Swing Length values (e.g., 10–20) to focus on larger market structure changes.
• Monitor untested zones for potential price reactions, enhancing your trade entries and exits.
Notes :
This indicator is best suited for traders who prefer price action trading and market structure analysis. While the indicator provides reliable insights, it is recommended to use it in conjunction with other analysis tools for a holistic trading approach.
Credits:
Developed by TradeTech Analysis to empower traders with automated tools for smarter trading decisions.

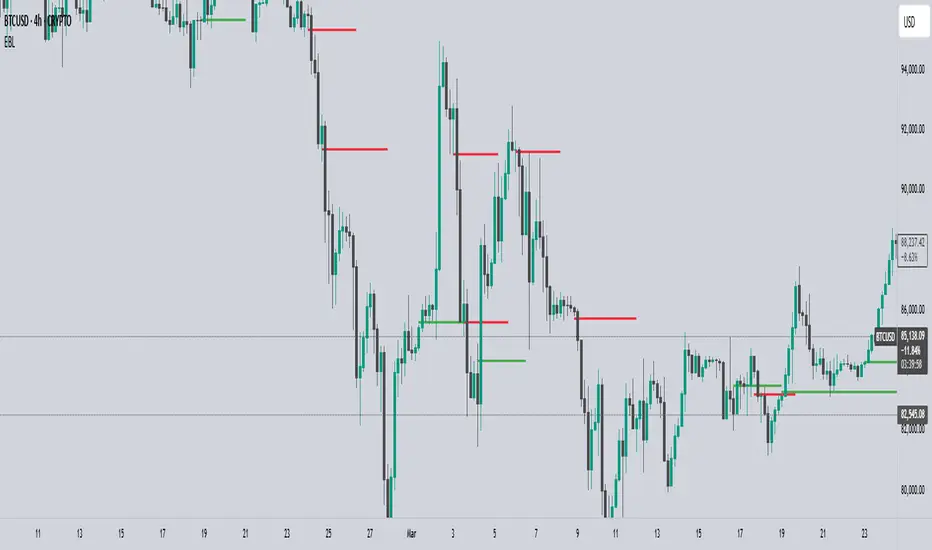
EBL - Enigma BOS LogicThe EBL - Enigma BOS Logic indicator is designed to detect key trend reversal points with precision by leveraging a unique concept based on two-candle price action analysis. Inspired by the balance of pairs in creation, this indicator identifies trend changes by focusing on significant bullish and bearish candle pairs, storing key levels, and waiting for confirmation to provide actionable trade signals. It goes beyond conventional trend-following indicators by offering real-time alerts and clear visual cues for traders.
How It Works
Bullish Setup:
The indicator identifies a bullish candle followed by a bearish candle. It then stores the high of the bullish candle as a potential reversal level.
A bullish confirmation occurs when a future bullish candle closes above the stored high. When this happens:
A green arrow is plotted below the confirming candle.
A horizontal green line is drawn at the stored high level, extending forward by a user-defined number of bars.
An alert is triggered to notify the trader of a confirmed bullish trend.
Bearish Setup:
The indicator identifies a bearish candle followed by a bullish candle. It stores the low of the bearish candle as a potential reversal level.
A bearish confirmation occurs when a future bearish candle closes below the stored low. When this happens:
A red arrow is plotted above the confirming candle.
A horizontal red line is drawn at the stored low level, extending forward by a user-defined number of bars.
An alert is triggered to notify the trader of a confirmed bearish trend.
Touch or Cross Alerts:
In addition to initial trend confirmation, the indicator tracks price movements relative to the drawn horizontal lines.
If the price returns to touch or cross a previously drawn horizontal line, an alert is triggered, indicating a potential re-entry or retracement opportunity.
Customization Options
To make the indicator versatile and adaptable for different trading styles, several customization options are provided:
Line Colors: Traders can customize the colors of the bullish and bearish lines.
Show/Hide Arrows and Lines: Users can choose whether to display the arrows and horizontal lines on the chart.
Line Length: The length of the horizontal lines (number of bars they extend into the future) is user-defined, offering flexibility based on trading timeframes and preferences.
Use Cases
Trend Reversal Detection: EBL is ideal for identifying key trend reversals, allowing traders to enter trades with a high probability of success.
Breakout Confirmation: The indicator provides visual and alert-based confirmation of breakouts beyond critical support or resistance levels.
Re-entry Opportunities: With alerts for price touching or crossing horizontal lines, traders can spot potential re-entry points during retracements.
Conceptual Foundation
The methodology behind this indicator is rooted in the principle that markets often move in pairs of bullish and bearish forces. By tracking the interaction between consecutive bullish and bearish candles and waiting for clear confirmations, this indicator ensures that only high-probability trend changes are signaled. This reduces noise and enhances trading accuracy, making it suitable for scalping, day trading, and swing trading across various timeframes.
How to Use
Apply the indicator to any chart and timeframe of your choice.
Set your preferred customization options, including line colors, arrow display, and line length.
Watch for arrows and listen for alerts to identify confirmed trend changes.
Pay attention to touch or cross alerts on horizontal lines, as these can signal potential re-entry or secondary trade opportunities.
Combine with other analysis: While EBL is powerful on its own, combining it with support/resistance analysis, moving averages, or volume indicators can further enhance its effectiveness.
This indicator is a powerful tool for traders seeking precision in identifying trend changes and actionable trade signals. Its unique logic, real-time alerts, and clear visual cues make it a valuable addition to any trader’s toolkit.
FON60DK by leventsahThe strategy generates buy and sell signals using the Tillson T3 and TOTT (Twin Optimized Trend Tracker) indicators. Additionally, the Williams %R indicator is used to filter the signals. Below is an explanation of the main components of the code:
1. Input Parameters:
Tillson T3 and TOTT parameters: Separate parameters are defined for both buy (AL) and sell (SAT) conditions. These parameters control the sensitivity and behavior of the indicators.
Williams %R period: The period for the Williams %R indicator is set to determine overbought and oversold levels.
2. Tillson T3 Calculation:
The Tillson T3 indicator is a smoothed moving average that uses an exponential moving average (EMA) with additional smoothing. The formula calculates a weighted average of multiple EMAs to produce a smoother line.
The t3 function computes the Tillson T3 value based on the close price and the input parameters.
3. TOTT Calculation (Twin Optimized Trend Tracker):
The TOTT indicator is a trend-following tool that adjusts its sensitivity based on market conditions. It uses a combination of price action and a volatility coefficient to determine trend direction.
The Var_Func function calculates the TOTT value, which is then used to derive the OTT (Optimized Trend Tracker) levels for both buy and sell conditions.
4. Williams %R Calculation:
Williams %R is a momentum oscillator that measures overbought and oversold levels. It is calculated using the highest high and lowest low over a specified period.
5. Buy and Sell Conditions:
Buy Condition: A buy signal is generated when the Tillson T3 value crosses above the TOTT upper band (OTTup) and the Williams %R is above -20 (indicating an oversold condition).
Sell Condition: A sell signal is generated when the Tillson T3 value crosses below the TOTT lower band (OTTdnS) and the Williams %R is above -70 (used to close long positions).
6. Strategy Execution:
The strategy.entry function is used to open a long position when the buy condition is met.
The strategy.close function is used to close the long position when the sell condition is met.
7. Visualization:
The bars on the chart are colored green when a long position is open.
The Tillson T3, TOTT upper band (OTTup), and TOTT lower band (OTTdn) are plotted on the chart for both buy and sell conditions.
8. Plots:
The Tillson T3 values for buy and sell conditions are plotted in blue.
The TOTT upper and lower bands are plotted in green and red, respectively, for both buy and sell conditions.
Summary:
This strategy combines trend-following indicators (Tillson T3 and TOTT) with a momentum oscillator (Williams %R) to generate buy and sell signals. The use of separate parameters for buy and sell conditions allows for fine-tuning the strategy based on market behavior. The visual elements, such as colored bars and plotted indicators, help traders quickly identify signals and trends on the chart.

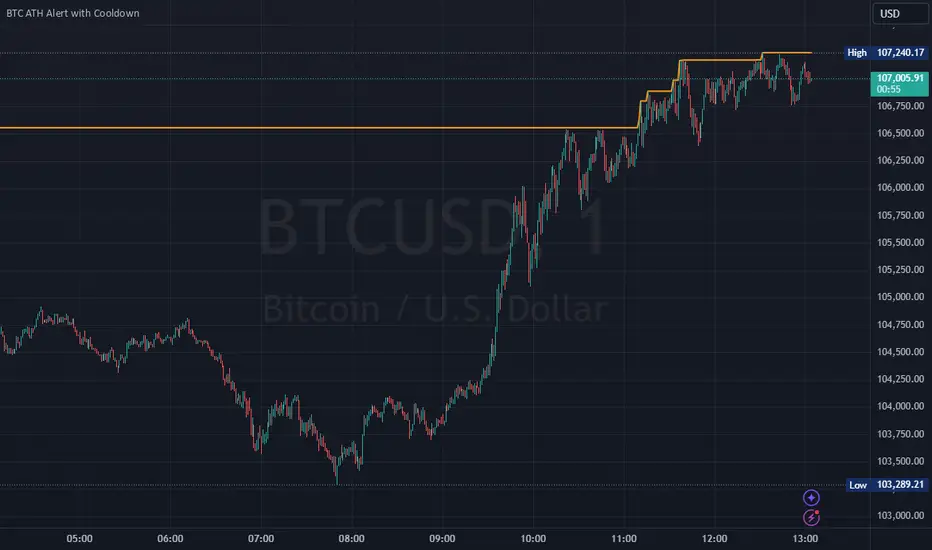
Bitcoin All-Time High (ATH) Alert with Cooldown₿ Bitcoin All-Time High (ATH) Alert with Cooldown 🚀👩🚀
🔍 What it does:
This indicator tracks new all-time highs (ATHs) and alerts you when Bitcoin (or any asset) reaches a fresh ATH, while avoiding alert spam with a customizable cooldown period.
✨ Key Features
✅ Alerts for New ATHs: Never miss when Bitcoin makes history!
✅ Cooldown Period: Prevents multiple alerts within a short timeframe (customizable in settings).
✅ ATH Line on Chart: A clear, visual line marking the all-time high price.
✅ Manual Reset Option: Reset the ATH for testing or specific chart conditions.
⚙️ How to Use
Add the Indicator: Apply it to your chart like any other indicator. Ideally on a small time frame, the cooldown is 20 bars by default (adjustable) which gives 20 minutes on the 1 min chart.
Customize Settings:
- Cooldown Period (bars): Set the number of bars to wait before triggering another alert (e.g., 20 bars).
- Show All-Time High Line: Toggle to display or hide the ATH line visually.
- Reset All-Time High: Use this to manually reset the ATH to the current bar's high.
Create an Alert:
Open the "Alerts" menu.
Select the condition: "New All-Time High" .
Choose a trigger type:
Once Per Bar: For immediate alerts when a new ATH occurs.
Once Per Bar Close: To confirm the ATH at the end of each bar.
🛠️ Who is it for?
Traders and HODLers who want to stay on top of price action.
Anyone looking for clean and efficient ATH tracking with no redundant alerts
🚀 Never miss a new ATH again. Stay ahead of the market!
High and Retracement Finder
This Pine Script indicator, titled "High and Retracement Finder," is designed to identify significant highs and lows on a price chart based on a user-defined starting point and retracement threshold. It begins analysis from a manually set bar index and tracks the highest high until the price retraces by a specified percentage (retracement threshold). Once this retracement occurs, it switches focus to finding the lowest low. If the price surpasses the previous high during this phase, the cycle resets, and the script resumes tracking a new highest high. The script visually marks these significant highs and lows with arrows on the chart, helping traders identify potential turning points or retracements in the market.

Rate of Change of OBV with RSI ColorThis indicator combines three popular tools in technical analysis : On-Balance Volume (OBV), Rate of Change (ROC), and Relative Strength Index (RSI). It aims to monitor momentum and potential trend reversals based on volume and price changes.
Calculation:
ROC(OBV) = ((OBV(today) - OBV(today - period)) / OBV(today - period)) * 100
This calculates the percentage change in OBV over a specific period. A positive ROC indicates an upward trend in volume, while a negative ROC suggests a downward trend.
What it Monitors:
OBV: Tracks the volume flow associated with price movements. Rising OBV suggests buying pressure, while falling OBV suggests selling pressure.
ROC of OBV:
Measures the rate of change in the OBV, indicating if the volume flow is accelerating or decelerating.
RSI: Measures the strength of recent price movements, indicating potential overbought or oversold conditions.
How it can be Used:
Identifying Trend Continuation: Rising ROC OBV with a rising RSI might suggest a continuation of an uptrend, especially if the color is lime (RSI above 60).
Identifying Trend Reversal: Falling ROC OBV with a declining RSI might suggest a potential trend reversal, especially if the color approaches blue (RSI below 40).
Confirmation with Threshold: The horizontal line (threshold) can be used as a support or resistance level. Bouncing ROC OBV off the threshold with a color change could suggest a pause in the trend but not necessarily a reversal.
When this Indicator is Useful:
This indicator can be useful for assets with strong volume activity, where tracking volume changes provides additional insights.
It might be helpful during periods of consolidation or trend continuation to identify potential breakouts or confirmations.
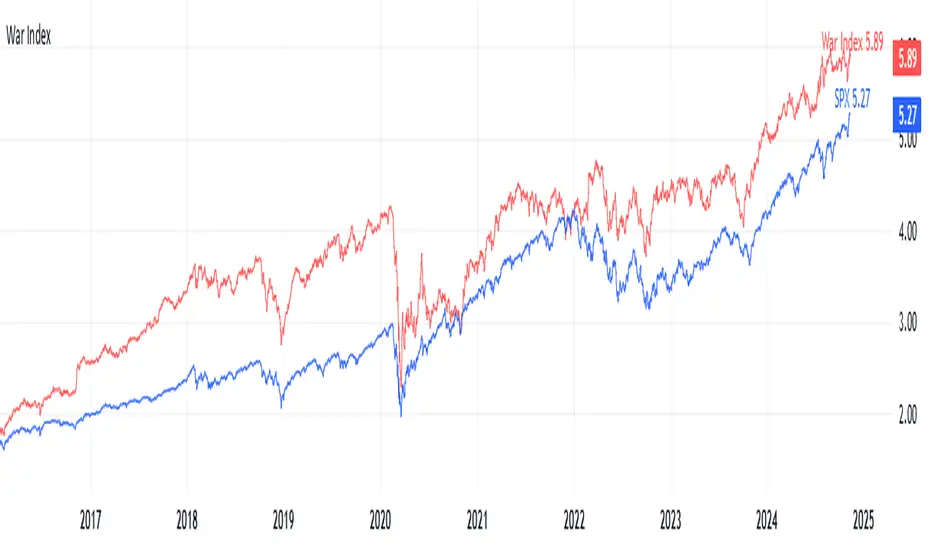
War IndexIntroduction
Welcome to the War Index! This project aims to provide traders, investors, and analysts with a specialized financial indicator that tracks the performance of key defense and aerospace companies. By aggregating the percentage changes of selected stocks, the War Index offers insights into the defense sector's dynamics and its relationship with the broader market.
What is the War Index?
The War Index is a custom financial indicator designed to approximate the collective performance of major defense and aerospace companies. It aggregates the daily percentage changes of selected stocks within the defense sector to provide a singular metric that reflects the overall health and trends of this industry. Additionally, the index is compared against the S&P 500 (SPX) to contextualize its performance relative to the broader market.
Index Components
The War Index comprises the following 16 stocks, each representing a significant player in the defense and aerospace industries:
Lockheed Martin Corporation ( NYSE:LMT )
Northrop Grumman Corporation ( NYSE:NOC )
Boeing Company ( NYSE:BA )
Raytheon Technologies Corporation ( NYSE:RTX )
General Dynamics Corporation ( NYSE:GD )
BAE Systems plc ( OTC:BAESY )
L3Harris Technologies, Inc. ( NYSE:LHX )
Textron Inc. ( NYSE:TXT )
Huntington Ingalls Industries, Inc. ( NYSE:HII )
Oshkosh Corporation ( NYSE:OSK )
Leidos Holdings, Inc. ( NYSE:LDOS )
Kratos Defense & Security Solutions, Inc. ( NASDAQ:KTOS )
Spirit AeroSystems Holdings, Inc. ( NYSE:SPR )
Parsons Corporation ( NYSE:PSN )
CACI International Inc ( NYSE:CACI )
ViaSat, Inc. ( NASDAQ:VSAT )
Purpose of the War Index
The War Index serves several key purposes:
Sector Performance Tracking : By aggregating the performance of major defense and aerospace companies, the index provides a clear picture of the sector's overall health.
Investment Analysis : Investors can use the index to identify trends, evaluate sector strength, and make informed decisions regarding their portfolios.
Comparative Benchmarking : Comparing the War Index with broader market indices like the S&P 500 helps in understanding how the defense sector performs relative to the general market.
Disclaimer: This War Index is an approximated indicator intended for informational purposes only. It should not be construed as investment advice. Always conduct your own research or consult with a financial advisor before making investment decisions.
Multi-Trend SynchronizerMulti-Trend Synchronizer
The Multi-Trend Synchronizer indicator provides a multi-timeframe trend analysis using SMMA (Smoothed Moving Average) across three user-defined timeframes: short, medium, and long-term. By synchronizing trends from these timeframes, this tool helps traders identify stronger alignment signals for potential trend continuation or reversal, enhancing decision-making in various market conditions.
Key Features
Multi-Timeframe Trend Analysis: Users can set three different timeframes, allowing flexibility in tracking trends over short (e.g., 15 minutes), medium (e.g., 1 hour), and long-term (e.g., 4 hours) intervals.
Clear Trend Visualization: The indicator plots SMMA lines on the main chart, color-coded by timeframe for intuitive reading. It also displays an at-a-glance trend alignment table, showing the current trend direction (bullish, bearish, or neutral) for each timeframe.
Buy and Sell Signals: Alignment across all timeframes generates Buy and Sell signals, visualized on the chart with distinct markers to aid entry/exit timing.
Usage Notes
This indicator is best used for trend-following strategies. The SMMA-based design provides smoother trend transitions, reducing noise compared to standard moving averages. However, as with all indicators, it is not foolproof and should be combined with other analyses for robust decision-making.
How It Works
The indicator calculates SMMA values for each selected timeframe and tracks trend changes based on SMMA's direction. When all timeframes show a unified direction (either bullish or bearish), the indicator generates a Buy or Sell signal. A table displays real-time trend direction, with color codes to assist traders in quickly assessing the market's overall direction.
Indicator Settings
Timeframes: Customize each SMMA timeframe to align with personal trading strategies or market conditions.
SMMA Length: Adjust the length of the SMMA to control sensitivity. Lower values may increase signal frequency, while higher values provide smoother, more stable trend indicators.
Disclaimer: As with any trend-following tool, this indicator is most effective when used in trending markets and may be less reliable in sideways conditions. Past performance does not guarantee future results, and users should be cautious of market volatility.
Use it for educational purposes!
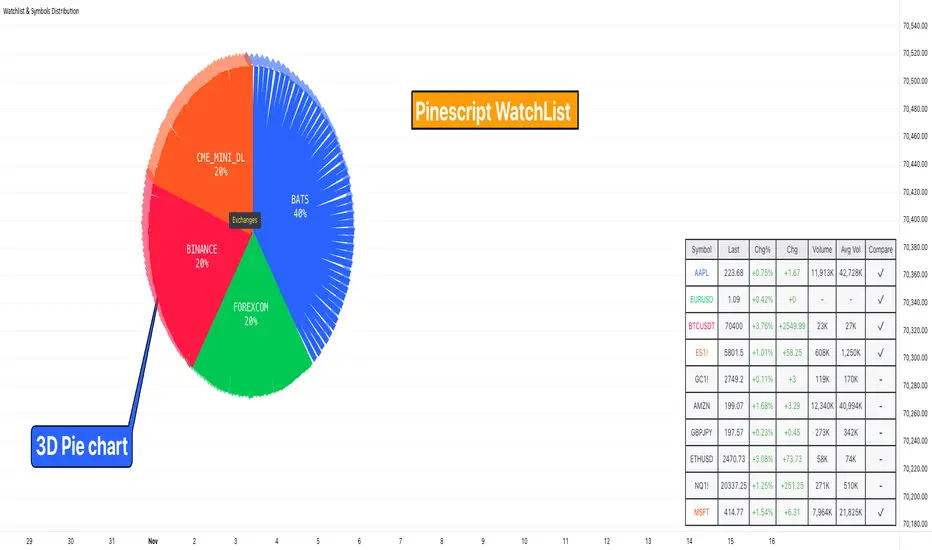
Watchlist & Symbols Distribution [Daveatt]TLDR;
I got bored so I just coded the TradingView watchlist interface in Pinescript :)
TLDR 2:
Sharing it open-source what took me 1 full day to code - haven't coded in Pinescript in a long time, so I'm a bit slow for now :)
█ OVERVIEW
This script offers a comprehensive market analysis tool inspired by TradingView's native watchlist interface features.
It combines an interactive watchlist with powerful distribution visualization capabilities and a performance comparison panel.
The script was developed with a focus on providing multiple visualization methods while working within PineScript's limitations.
█ DEVELOPMENT BACKGROUND
The pie chart implementation was greatly inspired by the ( "Crypto Map Dashboard" script / )
adapting its circular visualization technique to create dynamic distribution charts. However, due to PineScript's 500-line limitation per script, I had to optimize the code to allow users to switch between pie chart analysis and performance comparison modes rather than displaying both simultaneously.
█ SETUP AND DISPLAY
For optimal visualization, users need to adjust the chart's display settings manually.
This involves:
Expanding the indicator window vertically to accommodate both the watchlist and graphical elements
Adjusting the Y-axis scale by dragging it to ensure proper spacing for the comparison panel grid
Modifying the X-axis scale to achieve the desired time window display
Fine-tuning these adjustments whenever switching between pie chart and comparison panel modes
These manual adjustments are necessary due to PineScript's limitations in controlling chart scaling programmatically. While this requires some initial setup, it allows users to customize the display to their preferred viewing proportions.
█ MAIN FEATURES
Distribution Analysis
The script provides three distinct distribution visualization modes through a pie chart.
Users can analyze their symbols by exchanges, asset types (such as Crypto, Forex, Futures), or market sectors.
If you can't see it well at first, adjust your chart scaling until it's displayed nicely.
Asset Exchanges
www.tradingview.com
Asset Types
Asset Sectors
The pie charts feature an optional 3D effect with adjustable depth and angle parameters. To enhance visual customization, four different color schemes are available: Default, Pastel, Dark, and Neon.
Each segment of the pie chart includes interactive tooltips that can be configured to show different levels of detail. Importantly, the pie chart only visualizes the distribution of selected assets (those marked with a checkmark in the watchlist), providing a focused view of the user's current interests.
Interactive Watchlist
The watchlist component displays real-time data for up to 10 user-defined symbols. Each entry shows current price, price changes (both absolute and percentage), volume metrics, and a comparison toggle.
The table is dynamically updated and features color-coded entries that correspond to their respective performance lines in the comparison chart. The watchlist serves as both an information display and a control panel for the comparison feature.
Performance Comparison
One of the script's most innovative features is its performance comparison panel.
Using polylines for smooth visualization, it tracks the 30-day performance of selected symbols relative to a 0% baseline.
The comparison chart includes a sophisticated grid system with 5% intervals and a dynamic legend showing current performance values.
The polyline implementation allows for fluid, continuous lines that accurately represent price movements, providing a more refined visual experience than traditional line plots. Like the pie charts, the comparison panel only displays performance lines for symbols that have been selected in the watchlist, allowing users to focus on their specific assets of interest.
█ TECHNICAL IMPLEMENTATION
The script utilizes several advanced PineScript features:
Dynamic array management for symbol tracking
Polyline-based charting for smooth performance visualization
Real-time data processing with security calls
Interactive tooltips and labels
Optimized drawing routines to maintain performance
Selective visualization based on user choices
█ CUSTOMIZATION
Users can personalize almost every aspect of the script:
Symbol selection and comparison preferences
Visual theme selection with four distinct color schemes
Pie chart dimensions and positioning
Tooltip information density
Component visibility toggles
█ LIMITATIONS
The primary limitation stems from PineScript's 500-line restriction per script.
This constraint necessitated the implementation of a mode-switching system between pie charts and the comparison panel, as displaying both simultaneously would exceed the line limit. Additionally, the script relies on manual chart scale adjustments, as PineScript doesn't provide direct control over chart scaling when overlay=false is enabled.
However, these limitations led to a more focused and efficient design approach that gives users control over their viewing experience.
█ CONCLUSION
All those tools exist in the native TradingView watchlist interface and they're better than what I just did.
However, now it exists in Pinescript... so I believe it's a win lol :)