Session Volume Profile Sniffer: HVN & Rejection ZonesA simple tool built for traders who rely on intraday volume structure.
What this script does
This script tracks volume distribution inside a selected session and highlights two key price levels:
High Volume Nodes (HVNs) — areas where price spent time building heavy participation.
Low Volume Nodes (LVNs) — thin zones where price moved quickly with very little interest.
Instead of plotting a full profile, this tool gives you the exact rejection-level lines you usually hunt manually.
Why these levels matter
HVN → price tends to react, stall, or flip direction
LVN → price often rejects strongly since liquidity is thin
Rejection patterns around these areas give clean entry signals
Positioning trades around HVN/LVN helps filter noise in choppy sessions
This script removes the trouble of drawing profiles, counting bins, or guessing node levels. Everything is calculated inside the session you choose.
How the detection works
Inside your session window, the script:
1. Tracks each tick-based price bucket
2. Accumulates raw volume for every bucket
Identifies:
HVNs = buckets with volume above a tier
LVNs = buckets with volume below a tier
3. Prints each level as a single clean line
4. Generates:
Long signal → bounce from LVN
Short signal → rejection from HVN
Built-in exits use ATR-based conditions for quick testing.
Features
Session-based volume mapping
HVN + LVN levels drawn automatically
Entry triggers based on rejection
ATR exits for experimental backtests
Clean, minimal visual output
Best use cases
Intraday futures
Index scalping
FX sessions (London / NY)
Crypto sessions (user-timed)
Anyone who trades around volume structure
Adjustable settings
Session window
Volume bin size
HVN multiplier
LVN multiplier
Enable/disable zone lines
This keeps it flexible enough for both scalpers and slow-paced intraday setups.
Important note
This script is built for study + idea testing.
It is not intended as a final system.
Once you identify how price behaves around these nodes, you can blend this tool into your own setup.
在脚本中搜索"track"

EMA Cross + RSI + ADX - Autotrade Strategy V2Overview
A versatile trend-following strategy combining EMA 9/21 crossovers with RSI momentum filtering and optional ADX trend strength confirmation. Designed for both cryptocurrency and traditional futures/options markets with built-in stop loss management and automated position reversals.
Key Features
Multi-Market Compatibility: Works on both crypto futures (Bitcoin, Ethereum) and traditional markets (NIFTY, Bank NIFTY, S&P 500 futures, equity options)
Triple Confirmation System: EMA crossover + RSI filter + ADX strength (optional)
Automated Risk Management: 2% stop loss with wick-touch detection
Position Auto-Reversal: Opposite signals automatically close and reverse positions
Webhook Ready: Six distinct alert messages for automation (Entry Buy/Sell, Close Long/Short, SL Hit Long/Short)
Performance Metrics
NIFTY Futures (15min): 50%+ win rate with ADX filter OFF
Crypto Markets: Requires extensive backtesting before live deployment
Optimal Timeframes: 15-minute to 1-hour charts (patience required for higher timeframes)
Strategy Logic
Entry Signals:
LONG: EMA 9 crosses above EMA 21 + RSI > 55 + ADX > 20 (if enabled)
SHORT: EMA 9 crosses below EMA 21 + RSI < 45 + ADX > 20 (if enabled)
Exit Signals:
Opposite EMA crossover (auto-closes current position)
Stop loss hit at 2% from entry price (tracks candle wicks)
Technical Indicators:
Fast EMA: 9-period (short-term trend)
Slow EMA: 21-period (primary trend)
RSI: 14-period with 55/45 thresholds (momentum confirmation)
ADX: 14-period with 20 threshold (trend strength filter - optional)
Market-Specific Settings
Traditional Markets (NIFTY, Bank NIFTY, S&P Futures, Options)
Recommended Settings:
ADX Filter: Turn OFF (less choppy, cleaner trends)
Timeframe: 15-minute chart
Win Rate: 50%+ on NIFTY Futures
Why No ADX: Traditional markets have more institutional participation and smoother price action, making ADX unnecessary
Cryptocurrency Markets (BTC, ETH, Altcoins)
Recommended Settings:
ADX Filter: Turn ON (ADX > 20)
Timeframe: 15-minute to 1-hour
Extensive backtesting required before live trading
Why ADX: Crypto markets are highly volatile and prone to false breakouts; ADX filters low-quality chop
Best Practices
✅ Backtest thoroughly on your specific instrument and timeframe
✅ Use larger timeframes (1H, 4H) for higher quality signals and better risk/reward
✅ Adjust RSI thresholds based on market volatility (try 52/48 for more signals, 60/40 for fewer but stronger)
✅ Monitor ADX effectiveness - disable for traditional markets, enable for crypto
✅ Proper position sizing - adjust default_qty_value based on your capital and instrument price
✅ Paper trade first - test for 2-4 weeks before risking real capital
Risk Management
Fixed 2% stop loss per trade (adjustable)
Stop loss tracks candle wicks for accurate execution
Positions auto-reverse on opposite signals (no manual intervention needed)
0.075% commission built into backtest (adjust for your broker)
Customization Options
All parameters are adjustable via inputs:
EMA periods (default: 9/21)
RSI length and thresholds (default: 14-period, 55/45 levels)
ADX length and threshold (default: 14-period, 20 threshold)
Stop loss percentage (default: 2%)
Webhook Automation
This strategy includes six distinct alert messages for automated trading:
"Entry Buy" - Long position opened
"Entry Sell" - Short position opened
"Close Long" - Long position closed on opposite crossover
"Close Short" - Short position closed on opposite crossover
"SL Hit Long" - Long stop loss triggered
"SL Hit Short" - Short stop loss triggered
Compatible with Delta Exchange, Binance Futures, 3Commas, Alertatron, and other webhook platforms.
Important Notes
⚠️ Crypto markets require extensive backtesting - volatility patterns differ significantly from traditional markets
⚠️ Higher timeframes = better results - 15min works but 1H/4H provide cleaner signals
⚠️ ADX toggle is critical - OFF for traditional markets, ON for crypto
⚠️ Not financial advice - always conduct your own research and use proper risk management
⚠️ Past performance ≠ future results - backtest results may not reflect live trading conditions
Disclaimer
This strategy is for educational and informational purposes only. Trading futures and options involves substantial risk of loss. Always backtest thoroughly, start with paper trading, and never risk more than you can afford to lose. The author assumes no responsibility for any trading losses incurred using this strategy.

Dskyz (DAFE) AI Adaptive Regime - Beginners VersionDskyz (DAFE) AI Adaptive Regime - Pro: Revolutionizing Trading for All
Introduction
In the fast-paced world of financial markets, traders need tools that can keep up with ever-changing conditions while remaining accessible. The Dskyz (DAFE) AI Adaptive Regime - Pro is a groundbreaking TradingView strategy that delivers advanced, AI-driven trading capabilities to everyday traders. Available on TradingView (TradingView Scripts), this Pine Script strategy combines sophisticated market analysis with user-friendly features, making it a standout choice for both novice and experienced traders.
Core Functionality
The strategy is built to adapt to different market regimes—trending, ranging, volatile, or quiet—using a robust set of technical indicators, including:
Moving Averages (MA): Fast and slow EMAs to detect trend direction.
Average True Range (ATR): For dynamic stop-loss and volatility assessment.
Relative Strength Index (RSI) and MACD: Multi-timeframe confirmation of momentum and trend.
Average Directional Index (ADX): To identify trending markets.
Bollinger Bands: For assessing volatility and range conditions.
Candlestick Patterns: Recognizes patterns like bullish engulfing, hammer, and double bottoms, confirmed by volume spikes.
It generates buy and sell signals based on a scoring system that weighs these indicators, ensuring trades align with the current market environment. The strategy also includes dynamic risk management with ATR-based stops and trailing stops, as well as performance tracking to optimize future trades.
What Sets It Apart
The Dskyz (DAFE) AI Adaptive Regime - Pro distinguishes itself from other TradingView strategies through several unique features, which we compare to common alternatives below:
| Feature | Dskyz (DAFE) | Typical TradingView Strategies|
|---------|-------------|------------------------------------------------------------|
| Regime Detection | Automatically identifies and adapts to **four** market regimes | Often static or limited to trend/range detection |
| Multi‑Timeframe Analysis | Uses higher‑timeframe RSI/MACD for confirmation | Rarely incorporates multi‑timeframe data |
| Pattern Recognition | Detects candlestick patterns **with volume confirmation** | Limited or no pattern recognition |
| Dynamic Risk Management | ATR‑based stops and trailing stops | Often uses fixed stops or basic risk rules |
| Performance Tracking | Adjusts thresholds based on past performance | Typically static parameters |
| Beginner‑Friendly Presets | Aggressive, Conservative, Optimized profiles | Requires manual parameter tuning |
| Visual Cues | Color‑coded backgrounds for regimes | Basic or no visual aids |
The Dskyz strategy’s ability to integrate regime detection, multi-timeframe analysis, and user-friendly presets makes it uniquely versatile and accessible, addressing the needs of everyday traders who want professional-grade tools without the complexity.
-Key Features and Benefits
[Why It’s Ideal for Everyday Traders
⚡The Dskyz (DAFE) AI Adaptive Regime - Pro democratizes advanced trading by offering professional-grade tools in an accessible package. Unlike many TradingView strategies that require deep technical knowledge or fail in changing market conditions, this strategy simplifies complex analysis while maintaining robustness. Its presets and visual aids make it easy for beginners to start, while its adaptive features and performance tracking appeal to advanced traders seeking an edge.
🔄Limitations and Considerations
Market Dependency: Performance varies by market and timeframe. Backtesting is essential to ensure compatibility with your trading style.
Learning Curve: While presets simplify use, understanding regimes and indicators enhances effectiveness.
No Guaranteed Profits: Like all strategies, success depends on market conditions and proper execution. The Reddit discussion highlights skepticism about TradingView strategies’ universal success (Reddit Discussion).
Instrument Specificity: Optimized for futures (e.g., ES, NQ) due to fixed tick values. Test on other instruments like stocks or forex to verify compatibility.
📌Conclusion
The Dskyz (DAFE) AI Adaptive Regime - Pro is a revolutionary TradingView strategy that empowers everyday traders with advanced, AI-driven tools. Its ability to adapt to market regimes, confirm signals across timeframes, and manage risk dynamically. sets it apart from typical strategies. By offering beginner-friendly presets and visual cues, it makes sophisticated trading accessible without sacrificing power. Whether you’re a novice looking to trade smarter or a pro seeking a competitive edge, this strategy is your ticket to mastering the markets. Add it to your chart, backtest it, and join the elite traders leveraging AI to dominate. Trade like a boss today! 🚀
Use it with discipline. Use it with clarity. Trade smarter.
**I will continue to release incredible strategies and indicators until I turn this into a brand or until someone offers me a contract.
-Dskyz

ADX for BTC [PineIndicators]The ADX Strategy for BTC is a trend-following system that uses the Average Directional Index (ADX) to determine market strength and momentum shifts. Designed for Bitcoin trading, this strategy applies a customizable ADX threshold to confirm trend signals and optionally filters entries using a Simple Moving Average (SMA). The system features automated entry and exit conditions, dynamic trade visualization, and built-in trade tracking for historical performance analysis.
⚙️ Core Strategy Components
1️⃣ Average Directional Index (ADX) Calculation
The ADX indicator measures trend strength without indicating direction. It is derived from the Positive Directional Movement (+DI) and Negative Directional Movement (-DI):
+DI (Positive Directional Index): Measures upward price movement.
-DI (Negative Directional Index): Measures downward price movement.
ADX Value: Higher values indicate stronger trends, regardless of direction.
This strategy uses a default ADX length of 14 to smooth out short-term fluctuations while detecting sustainable trends.
2️⃣ SMA Filter (Optional Trend Confirmation)
The strategy includes a 200-period SMA filter to validate trend direction before entering trades. If enabled:
✅ Long Entry is only allowed when price is above a long-term SMA multiplier (5x the standard SMA length).
✅ If disabled, the strategy only considers the ADX crossover threshold for trade entries.
This filter helps reduce entries in sideways or weak-trend conditions, improving signal reliability.
📌 Trade Logic & Conditions
🔹 Long Entry Conditions
A buy signal is triggered when:
✅ ADX crosses above the threshold (default = 14), indicating a strengthening trend.
✅ (If SMA filter is enabled) Price is above the long-term SMA multiplier.
🔻 Exit Conditions
A position is closed when:
✅ ADX crosses below the stop threshold (default = 45), signaling trend weakening.
By adjusting the entry and exit ADX levels, traders can fine-tune sensitivity to trend changes.
📏 Trade Visualization & Tracking
Trade Markers
"Buy" label (▲) appears when a long position is opened.
"Close" label (▼) appears when a position is exited.
Trade History Boxes
Green if a trade is profitable.
Red if a trade closes at a loss.
Trend Tracking Lines
Horizontal lines mark entry and exit prices.
A filled trade box visually represents trade duration and profitability.
These elements provide clear visual insights into trade execution and performance.
⚡ How to Use This Strategy
1️⃣ Apply the script to a BTC chart in TradingView.
2️⃣ Adjust ADX entry/exit levels based on trend sensitivity.
3️⃣ Enable or disable the SMA filter for trend confirmation.
4️⃣ Backtest performance to analyze historical trade execution.
5️⃣ Monitor trade markers and history boxes for real-time trend insights.
This strategy is designed for trend traders looking to capture high-momentum market conditions while filtering out weak trends.

Multi-Timeframe RSI Grid Strategy with ArrowsKey Features of the Strategy
Multi-Timeframe RSI Analysis:
The strategy calculates RSI values for three different timeframes:
The current chart's timeframe.
Two higher timeframes (configurable via higher_tf1 and higher_tf2 inputs).
It uses these RSI values to identify overbought (sell) and oversold (buy) conditions.
Grid Trading System:
The strategy uses a grid-based approach to scale into trades. It adds positions at predefined intervals (grid_space) based on the ATR (Average True Range) and a grid multiplication factor (grid_factor).
The grid system allows for pyramiding (adding to positions) up to a maximum number of grid levels (max_grid).
Daily Profit Target:
The strategy has a daily profit target (daily_target). Once the target is reached, it closes all open positions and stops trading for the day.
Drawdown Protection:
If the open drawdown exceeds 2% of the account equity, the strategy closes all positions to limit losses.
Reverse Signals:
If the RSI conditions reverse (e.g., from buy to sell or vice versa), the strategy closes all open positions and resets the grid.
Visualization:
The script plots buy and sell signals as arrows on the chart.
It also plots the RSI values for the current and higher timeframes, along with overbought and oversold levels.
How It Works
Inputs:
The user can configure parameters like RSI length, overbought/oversold levels, higher timeframes, grid spacing, lot size multiplier, maximum grid levels, daily profit target, and ATR length.
RSI Calculation:
The RSI is calculated for the current timeframe and the two higher timeframes using ta.rsi().
Grid System:
The grid system uses the ATR to determine the spacing between grid levels (grid_space).
When the price moves in the desired direction, the strategy adds positions at intervals of grid_space, increasing the lot size by a multiplier (lot_multiplier) for each new grid level.
Entry Conditions:
A buy signal is generated when the RSI is below the oversold level on all three timeframes.
A sell signal is generated when the RSI is above the overbought level on all three timeframes.
Position Management:
The strategy scales into positions using the grid system.
It closes all positions if the daily profit target is reached or if a reverse signal is detected.
Visualization:
Buy and sell signals are plotted as arrows on the chart.
RSI values for all timeframes are plotted, along with overbought and oversold levels.
Example Scenario
Suppose the current RSI is below 30 (oversold), and the RSI on the 60-minute and 240-minute charts is also below 30. This triggers a buy signal.
The strategy enters a long position with a base lot size.
If the price moves against the position by grid_space, the strategy adds another long position with a larger lot size (scaled by lot_multiplier).
This process continues until the maximum grid level (max_grid) is reached or the daily profit target is achieved.
Key Variables
grid_level: Tracks the current grid level (number of positions added).
last_entry_price: Tracks the price of the last entry.
base_size: The base lot size for the initial position.
daily_profit_target: The daily profit target in percentage terms.
target_reached: A flag to indicate whether the daily profit target has been achieved.
Potential Use Cases
This strategy is suitable for traders who want to combine RSI-based signals with a grid trading approach to capitalize on mean-reverting price movements.
It can be used in trending or ranging markets, depending on the RSI settings and grid parameters.
Limitations
The grid trading system can lead to significant drawdowns if the market moves strongly against the initial position.
The strategy relies heavily on RSI, which may produce false signals in strongly trending markets.
The daily profit target may limit potential gains in highly volatile markets.
Customization
You can adjust the input parameters (e.g., RSI length, overbought/oversold levels, grid spacing, lot multiplier) to suit your trading style and market conditions.
You can also modify the drawdown protection threshold or add additional filters (e.g., volume, moving averages) to improve the strategy's performance.
In summary, this script is a sophisticated trading strategy that combines RSI-based signals with a grid trading system to manage entries, exits, and position sizing. It includes features like daily profit targets, drawdown protection, and multi-timeframe analysis to enhance its robustnes

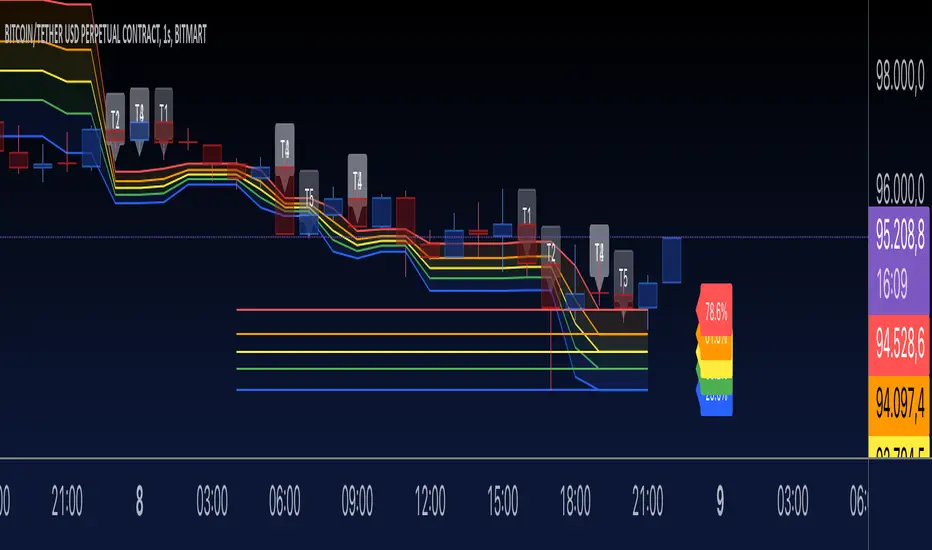
Fibonacci Trend - Aynet1. Inputs
lookbackPeriod: Defines the number of bars to consider for calculating swing highs and lows. Default is 20.
fibLevel1 to fibLevel5: Fibonacci retracement levels to calculate price levels (23.6%, 38.2%, 50%, 61.8%, 78.6%).
useTime: Enables or disables time-based Fibonacci projections.
riskPercent: Defines the percentage of risk for trading purposes (currently not used in calculations).
2. Functions
isSwingHigh(index): Identifies a swing high at the given index, where the high of that candle is higher than both its previous and subsequent candles.
isSwingLow(index): Identifies a swing low at the given index, where the low of that candle is lower than both its previous and subsequent candles.
3. Variables
swingHigh and swingLow: Store the most recent swing high and swing low prices.
swingHighTime and swingLowTime: Store the timestamps of the swing high and swing low.
fib1 to fib5: Fibonacci levels based on the difference between swingHigh and swingLow.
4. Swing Point Detection
The script checks if the last bar is a swing high or swing low using the isSwingHigh() and isSwingLow() functions.
If a swing high is detected:
The high price is stored in swingHigh.
The timestamp of the swing high is stored in swingHighTime.
If a swing low is detected:
The low price is stored in swingLow.
The timestamp of the swing low is stored in swingLowTime.
5. Fibonacci Levels Calculation
If both swingHigh and swingLow are defined, the script calculates the Fibonacci retracement levels (fib1 to fib5) based on the price difference (priceDiff = swingHigh - swingLow).
6. Plotting Fibonacci Levels
Fibonacci levels (fib1 to fib5) are plotted as horizontal lines using the line.new() function.
Labels (e.g., "23.6%") are added near the lines to indicate the level.
Lines and labels are color-coded:
23.6% → Blue
38.2% → Green
50.0% → Yellow
61.8% → Orange
78.6% → Red
7. Filling Between Fibonacci Levels
The plot() function creates lines for each Fibonacci level.
The fill() function is used to fill the space between two levels with semi-transparent colors:
Blue → Between fib1 and fib2
Green → Between fib2 and fib3
Yellow → Between fib3 and fib4
Orange → Between fib4 and fib5
8. Time-Based Fibonacci Projections
If useTime is enabled:
The time difference (timeDiff) between the swing high and swing low is calculated.
Fibonacci time projections are added based on multiples of 23.6%.
If the current time reaches a projected time, a label (e.g., "T1", "T2") is displayed near the high price.
9. Trading Logic
Two placeholder variables are defined for trading logic:
longCondition: Tracks whether a condition for a long trade is met (currently not implemented).
shortCondition: Tracks whether a condition for a short trade is met (currently not implemented).
These variables can be extended to define entry/exit signals based on Fibonacci levels.
How It Works
Detect Swing Points: It identifies recent swing high and swing low points on the chart.
Calculate Fibonacci Levels: Based on the swing points, it computes retracement levels.
Visualize Levels: Plots the levels on the chart with labels and fills between them.
Time Projections: Optionally calculates time-based projections for future price movements.
Trading Opportunities: The framework provides tools for detecting potential reversal or breakout zones using Fibonacci levels.
BTC Volatility Band StrategyThis script/strategy is a pullback system designed for securities with high volatility so naturally Bitcoin is an excellent choice for trading this. This could be used both on a daily chart or on lower timeframes (I found good results on 3hr timeframe but haven't tested it on anything under 1hr).
A volatility band is created by comparing the candle close price of the previous 2 candles and and it uses this change in price to create a moving average. A band is wrapped around the moving average with a standard deviation of 1 for the inner band and 2 for the outer band. If the price is above a pre-set MA (moving average filter) then it is determined we are in an uptrend so the strategy will issue a buy signal when we are in an uptrend and there is a pullback which causes the lower inner deviation band to be spiked, but if the price continues and falls through the outer deviation band then a buy signal will not issue as this detriments that the volatility spike is to great. You can see a spike "buy" event occur on the indicator where the background is coloured green. For a short/sell then there will be a spike on the upper inner band and we are below the pre-set MA filter, for this it shows with red background on the indicator.
The user can change the date range they wish to test, the moving average period for the volatility tracking and the inner and outer band deviations. On BTC I left the inner deviation and outer deviation bands on standard settings but found the 3 period volatility tracking to be good for trading 1 day chart and the 5 period volatility tracking good for the 3hr chart. Since this is not a buy and hold strategy then for trading you would probably want to stick with the most liquid coins so you can get in and out very fast on any exchange. If you wanted to tray this on less volatile markets then changing the inner deviation band to ~0.75 would work okay in various futures markets likely stocks as well. The take profit and stop loss levels are based on a multiple of the trading range looking back the past 7 candles.
Attached result is trading 1 BTCUSDT contract on Binance.

EMA and Dow Theory Strategies V2📘 Overview
This strategy is an advanced evolution of the original EMA × Dow Theory hybrid model. V2 introduces true swing‑based trend detection, gradient trend‑zones, higher‑timeframe swing overlays, and dynamic exit logic designed for intraday to short‑term trading across crypto, forex, stocks, and indices.
The system provides precise entries, adaptive exits, and highly visual guidance that helps traders understand trend structure at a glance.
🧠 Key Features
🔹 1. Dual‑EMA Trend Logic (Symbol + External Index)
Both the chart symbol and an external index (OTHERS.D) are evaluated using fast/slow EMAs to determine correlation‑based trend bias.
🔹 2. Dow Theory Swing Detection (Real‑time)
The script identifies swing highs/lows and updates trend direction when price breaks them. This creates a structural trend model that reacts faster than EMAs alone.
🔹 3. Gradient Trend Zones (Visual Trend Strength)
When trend is up or down, the area between price and the latest swing level is filled with a multi‑step gradient. This makes trend strength and distance-to-structure visually intuitive.
🔹 4. Higher‑Timeframe Swing Trend (htfTrend)
Swing highs/lows from a higher timeframe (e.g., 4H) are plotted to show macro structure. Used only for visual context, not for filtering entries.
🔹 5. RSI‑Based Entry Protection
RSI prevents entries during extreme overbought/oversold conditions.
🔹 6. Dynamic Exit System
Includes:
Custom stop‑loss (%)
Partial take‑profit (TP1/TP2/TP3)
Automatic scale‑out when trend color weakens
“Color‑change lockout” to prevent immediate re‑entry
Real‑time PnL tracking and labels
🔹 7. Alerts for All Key Events
Entry, stop‑loss, partial exits, and trend‑change exits all generate structured JSON alerts.
🔹 8. Visual PnL Labels & Equity Tracking
PnL for the latest trade is displayed directly on the chart, including scale‑out adjustments.
⚙️ Input Parameters
Parameter Description
Fast EMA / Slow EMA EMAs used for symbol trend detection
Index Fast / Slow EMA EMAs applied to external index
StopLoss (%) Custom stop‑loss threshold
Scale‑Out % Portion to exit when trend color weakens
RSI Period / Levels Overbought/oversold filters
Swing Detection Length Bars used to detect swing highs/lows
Stats Display Position of statistics table
🧭 About htfTrend (Higher Timeframe Trend)
The higher‑timeframe swing trend is displayed visually but not used for entry logic.
Why? Strict HTF filtering reduces trade frequency and often removes profitable setups. By keeping it visual‑only, traders retain flexibility while still benefiting from macro structure awareness.
Use it as a contextual guide, not a constraint.
📘 概要
本ストラテジーは、V1 を大幅に拡張した EMA × ダウ理論 × スイング構造 × 上位足トレンド可視化 の複合型モデルです。 短期〜デイトレード向けに最適化されており、仮想通貨・FX・株式・指数など幅広いアセットで利用できます。
V2 では、スイング構造の自動検出、グラデーションによるトレンド強度の可視化、上位足スイングライン、動的な利確/損切りロジック が追加され、視覚的にもロジック的にも大幅に強化されています。
🧠 主な機能
🔹 1. 銘柄+外部インデックスの EMA クロス判定
対象銘柄と OTHERS.D の EMA を比較し、相関を考慮したトレンド方向を判定します。
🔹 2. ダウ理論に基づくスイング高値・安値の自動検出
スイング更新によりトレンド方向を切り替える、構造ベースのトレンド判定を採用。
🔹 3. グラデーション背景によるトレンド強度の可視化
スイングラインから現在価格までを段階的に塗り分け、 「どれだけトレンドが伸びているか」を直感的に把握できます。
🔹 4. 上位足スイングトレンド(htfTrend)の表示
4H などの上位足でのスイング高値・安値を表示し、 大局的なトレンド構造を視覚的に把握できます(ロジックには未使用)。
🔹 5. RSI による過熱・売られすぎフィルター
極端な RSI 状態でのエントリーを防止。
🔹 6. 動的イグジットシステム
カスタム損切り(%)
TP1/TP2/TP3 の段階的利確
トレンド色の弱まりによる自動スケールアウト
色変化後の再エントリー制限(waitForColorChange)
リアルタイム PnL の追跡とラベル表示
🔹 7. アラート完備(JSON 形式)
エントリー、損切り、部分利確、トレンド反転などすべてに対応。
🔹 8. 損益ラベル・統計表示
直近トレードの損益をチャート上に表示し、視覚的に把握できます。
⚙️ 設定項目
設定項目名 説明
Fast / Slow EMA 銘柄の EMA 設定
Index Fast / Slow EMA 外部インデックスの EMA 設定
損切り(%) カスタム損切りライン
部分利確割合 トレンド弱化時のスケールアウト割合
RSI 期間・水準 過熱/売られすぎフィルター
スイング検出期間 スイング高値・安値の検出に使用
統計表示位置 テーブルの表示位置
🧭 上位足トレンド(htfTrend)について
上位足スイングの更新に基づくトレンド判定を表示しますが、 エントリー条件には使用していません。
理由: 上位足を厳密にロジックへ組み込むと、トレード機会が大幅に減るためです。
本ストラテジーでは、 「大局の把握は視覚で、エントリーは柔軟に」 という設計思想を採用しています。
→ 裁量で利確判断や逆張り回避に活用できます。

PA Builder [PrimeAutomation]1. PA Builder – Overview
PA Builder is not a fixed strategy; it’s a framework for building strategies. Instead of giving traders one rigid system, it provides a toolbox where entries, exits, filters, risk parameters, and automation rules can all be defined and combined. The core philosophy is confluence: the idea that a trade should only be taken when multiple independent signals agree. The Builder is built around this principle. Every module; trend, reactors, bands, reversals, volume, structure, divergences, externals can be treated as one layer of confidence. The stronger the alignment across layers, the higher the quality of the setup in theory.
In practice, this means PA Builder encourages traders to think in terms of “confluence,” not single indicators. Trend and positioning define whether you should even be looking for longs or shorts. Timing tools such as bands, reversals and candlestick structures determine when inside that broader bias you want to engage. Confirmation tools like volume and flow tell you whether capital is actually supporting the move. Filter systems then ensure that even if everything looks good locally, you still respect higher-timeframe or opposing warnings. The Builder’s philosophy is simple: enter less often, but only when conditions are genuinely in your favour.
2. Core Entry Signal Components
The entry logic in PA Builder is built on a set of signal engines that can be combined in many ways. Trend Signals form a natural foundation. They use low-lag low-pass filters, borrowed from audio signal processing, to extract directional bias from price without the classic delay of classical moving averages. The sensitivity parameter controls how reactive this engine is: lower values favour cleaner trends and fewer whipsaws, while higher values are better suited to short-term intraday trading where speed matters more than smoothness. Many traders start by requiring that Trend Signals show “all bullish” or “all bearish” before allowing any entries in that direction.
Trend signals firing short positions
On top of this directional backbone, the Dynamic Reactor behaves as an adaptive baseline. It accelerates in volatile phases and slows down during consolidation, effectively acting as a moving reference point for both trend and price position. A typical use of this module is to insist that, for long trades, the price sits above a bullish reactor; for shorts, below a bearish one. At the higher-timeframe level, the Quantum Reactor provides a VWAP-style reference that can be anchored to larger candles than the chart you are trading. A common configuration is to trade on a 15-minute chart while requiring that price is above the 4-hour Quantum Reactor for longs or below it for shorts. The “fast” and “slow” options determine how quickly this reference adapts to new information.
Timing is then refined with tools like Quantum Bands, reversals and candle structure analysis. Quantum Bands identify extremes within the current environment. In an uptrend, a tag of the lower band can be treated as a pullback rather than a breakdown; in a downtrend, the upper band acts like a shorting zone. Many traders combine “trend up and above higher-timeframe reactor” with “price temporarily below lower band” to construct a mean-reversion entry inside a larger uptrend. Reversal detection modules examine recent bars to find turning points, with shorter lookbacks capturing fast flips and longer lookbacks tracking deeper structural changes. Candle structure logic goes beyond classical candlestick names and instead focuses on whether price action confirms follow-through or reversion behaviour, with options like “2X” modes that wait for two successive confirmations before acting.
Before and after filtering using reactor applied.
Additional confirmation layers come from Volume Matrix, Money Flow, OSC True7 and divergence detection. Volume and flow tools answer whether actual capital is participating in the move or whether price is drifting on thin activity. OSC True7 categorises the state of the trend into intuitive buckets, strong, healthy, neutral, or exhausted, making it easier to avoid chasing extremes. Divergences between price and momentum can be used either as entry triggers in contrarian systems or as hard filters that block trades when warning signs are present. Finally, two external indicator inputs make it possible to integrate RSI, MACD, custom indicators or even other strategies into the Builder, either as simple thresholds or as comparative logic between two external sources (for example, requiring a fast EMA to be above a slow EMA before allowing longs).
3. Exit System & Trade Management
The exit systems in PA Builder are designed to be as vital as the entry logic. It assumes exits are not an afterthought, but half of the edge. Instead of forcing a single take profit point, the system uses a three-tier structure where you can assign different portions of the position to different targets. A common pattern is to scale out a small portion early (for example at one ATR), another portion at an intermediate level, and keep the largest slice for a deeper move. This creates a natural balance: you book something early to reduce emotional stress, while leaving room to participate in the full potential of a trend.
Targets can be defined using ATR multiples or risk-to-reward ratios that are directly tied to the initial stop distance. Using ATR keeps exits proportional to current volatility. A two ATR target in a quiet environment is very different in absolute price distance from the same multiple in a high-volatility environment, yet conceptually it represents the same “size” move. Risk-to-reward exits build on this by ensuring that if you risk one unit (1R), the reward targets are set at predefined multiples of that risk. This enforces positive expectancy at the structural level: the strategy cannot generate entries with inherently negative payoffs.
Once price begins to move in your favour, trailing logic takes over if you choose to enable it. Trailing can begin immediately from entry or only after a target has been hit. Many users prefer to let TP1 and TP2 behave as fixed profit points and then apply a trailing stop or trailing take profit to the final remainder. That way, routine winners are banked mechanically, while occasional explosive moves can be ridden for as long as the market allows. The breakeven module supports this behaviour by automatically moving stops to entry (or slightly through entry into profit) after a specified condition such as TP1 being hit. This transforms the risk profile mid trade: once breakeven has been secured, remaining size can be managed with much less psychological pressure.
The system also recognises the cost of time. Kill Switch functionality exits trades that have been open too long under mediocre conditions, typically when they are in modest profit but not progressing. This protects you from capital being tied up while better opportunities appear elsewhere. Underlying all of this are several trailing stop mechanisms: percentage-based, tick-based for very short-term strategies, TP linked trailing that activates only once a certain profit threshold has been achieved, and ATR based trailing that automatically scales the trail distance with volatility. Each method serves a slightly different profile of strategy, but all share the same aim: preserve gains and limit downside in a structured way rather than rely on discretionary judgement after the fact.
4. Filters and Risk Management
The filter systems in PA Builder formalise the idea that good trading is often about knowing when not to act. “Do Not Trade” conditions can be configured so that even a perfectly aligned bullish entry stack is overridden if certain bearish evidence is present. These can include higher timeframe reversal structures, powerful opposing divergences, or conflicting signals in key modules. By assigning conditions specifically to “Do Not Long” and “Do Not Short” rather than only to entries, you create asymmetry: buying requires bullish evidence and an absence of strong bearish warnings; selling requires the mirror.
Volatility filters extend this logic to the regime level. Some strategies are inherently suited to low volatility, range bound environments where fading extremes is profitable; others require expansion and energy to function properly. By binding trading permission to volatility ranges, you ensure that a mean-reversion system does not blindly attempt to fade a breakout, and that a momentum system does not spin its wheels in a dead, sideways market. You can even reference volatility from a higher timeframe than the one you trade, so that a five-minute strategy is still aware of the broader one-hour volatility regime it sits inside.
Applied DO NOT TRADE - removes poor signal
Risk management and position sizing are configured so each trade is expressed in units of risk rather than arbitrary size. Leverage, in this framework, is simply a scaling factor for capital efficiency; the actual risk per trade is still controlled by the distance between entry and stop and the percentage of equity you choose to expose. Reinvestment options then decide what proportion of accumulated profit is fed back into position sizing. A more aggressive reinvestment setting accelerates compounding but increases the amplitude of drawdowns; a more conservative one smooths the equity curve at the cost of slower growth. The Base Trade Value parameter ties all of this together by deciding how much nominal capital or how many contracts are committed per trade in light of your maximum allowed simultaneous positions and your intended use of leverage.
External exit conditions provide further flexibility. For example, you might design a system whose entries rely purely on PA Builder’s internal modules, but whose exits use RSI readings, moving average crosses, or a proprietary external indicator. The separation of entry and exit logic allows you to bolt on different behaviours at the tail end of trades while keeping your core signal engine intact. In all cases, the objective is the same: express risk in a controlled, repeatable way that can survive long stretches of unfavourable market conditions.
5. PDT, Cooldowns and Visual Modes
For traders subject to Pattern Day Trading rules, PA Builder includes a day-trade tracking system that counts business days correctly and respects the three-trades-in-five-days limit. This goes beyond simple compliance; it forces discipline. When intraday trading is heavily constrained, you are naturally pushed toward swing-oriented strategies with fewer, more selective entries. The tool visually marks your PDT status so you never inadvertently cross the line and trigger a lockout.
Cooldown systems address another reality: psychological vulnerability after streaks. Following several consecutive wins, many traders unconsciously loosen their standards, take marginal signals, oversize positions, or overtrade. A win-streak cooldown deliberately pauses trading after a configured number of wins, giving you time to reset. The same applies to losing streaks. After a run of losses, the strongest temptation is often to “make it back now,” which is exactly when discipline is weakest. A loss-streak cooldown enforces a break in activity during this high-risk emotional state, helping to prevent cascading damage driven by revenge trading.
Visualisation comes in two main modes. Classic mode emphasises precision: it draws explicit entry lines, stop levels, target levels and fill zones, making it easy to audit risk/reward on each trade, verify that the exit logic behaves as intended, and review historical trades in detail. Modern mode emphasises market feel: instead of focusing on exact levels, it colours candles and backgrounds to reflect momentum, profit state and dynamics.
This helps you see at a glance whether a strategy is operating in a smooth trending environment or a choppy, fragmented one, and whether current trades are broadly working or struggling. Many users develop and debug in Classic mode and then monitor live performance in Modern mode, so both representations become part of the workflow.
6. Strategy Design Workflow, Examples and Cautions
Designing with PA Builder is inherently iterative. You begin with a simple theory and a minimal configuration, perhaps just a trend filter and a basic stop/target structure, and run a backtest. You then examine where the system fails. If you see many losses occurring in counter-trend conditions, you add an additional directional filter or restrict entries with a higher-timeframe reactor condition. If you observe many small whipsaw losses, you might require candle structure confirmation or volume confirmation before allowing an entry. Each change is made one at a time and evaluated. This process gradually builds a layered system where every component has a clear purpose: some reduce drawdown, some increase win rate, some cut out only the worst trades, and others help capture more of the best ones.
A conservative swing strategy might need an agreement between short-term trend signals, a higher-timeframe Quantum position, and a bullish Dynamic Reactor state, while checking that volume supports the move and that no significant bearish reversals or divergences are present on higher timeframes. It might accept relatively few trades, but each trade would be tightly controlled, scaled out over several ATR-based targets and protected with breakeven and trailing logic. On the opposite end, an aggressive scalping configuration would relax some filters, favour faster sensitivities, use short lookback reversals, and tighten stops and targets dramatically, relying on high frequency and careful volatility filtering to maintain edge.
Throughout all of this, overfitting remains the main danger. The more parameters you tune and the more coincidental rules you add to make the backtest equity curve smoother, the more likely it is that you are capturing noise rather than a real, repeatable edge. Signs of overfitting include heavily optimised numeric values with no intuitive justification, large differences between in-sample and out-of-sample results, or strategies that work spectacularly in very specific regimes and collapse elsewhere. To mitigate this, keep strategies as simple as possible, test across different market regimes (bull, bear, range), and accept that robust systems usually look less “perfect” on the historical chart.
Bridging the gap from backtest to live trading is another critical step. Before risking capital, it is wise to paper trade the configuration for a number of trades to confirm that signal frequency, behaviour and execution align with expectations. When going live, starting with minimal size and gradually scaling up based on real-world performance helps manage both financial and psychological risk. If live results diverge significantly from backtest expectations due to slippage, fees, or changing market conditions, you can adjust, reduce size, or temporarily pause rather than commit fully to a failing configuration.
Ultimately, PA Builder is designed to be a tool for building structured, rules-driven trading systems. It gives you the tools to express your ideas, test them, refine them, and run them under controlled risk. It does not remove uncertainty or guarantee results, but it does provide a clear, transparent way to translate trading concepts into executable, testable logic, and to evolve those systems as markets change and your understanding deepens.

KDH v2.0 (English) Trading Strategy Indicator# KDH Diamond Strategy v3.3 - TradingView Description
---
## 🇬🇧 ENGLISH VERSION
### 📊 KDH Diamond Strategy v3.3
**Professional High-Leverage Futures Trading System**
---
#### 🎯 Overview
KDH Diamond is an advanced algorithmic trading strategy specifically optimized for **1-hour timeframe futures trading** with high-leverage environments. Built on proven institutional concepts including Fair Value Gaps (FVG), Volume Profile analysis, and multi-layered confirmation filters, this strategy delivers consistent results without repainting.
---
#### ✨ Key Features
**🔥 Optimized for 1H Timeframe**
- Extensively backtested across multiple markets
- Highest profit rate achieved on 1-hour charts
- Perfect for swing traders and active position management
**🎨 No Repainting - 100% Reliable Signals**
- All signals are confirmed and locked on bar close
- What you see in backtest is what you get in real-time
- Complete transparency with `calc_on_order_fills=true`
**💎 Automated Risk Management**
- Automatic Stop Loss and Take Profit calculation
- Intelligent SL/TP placement based on market structure
- Built-in position sizing controls (adjustable % per trade)
**🚀 High-Leverage Futures Optimized**
- Designed specifically for leveraged futures trading
- Risk-reward ratios calibrated for 10-20x leverage environments
- Precision entry timing to maximize profit potential
**🔄 Advanced Position Management**
- Automatic reversal entries at TP levels
- Multiple re-entry opportunities per signal
- Dynamic trade management based on market conditions
**🎛️ Multi-Layer Confirmation System**
- **SMA50 Filter (1H)**: Trend alignment confirmation
- **Momentum Filter**: KAMA-based directional strength
- **RSI Divergence Filter**: Reversal detection at extremes
- **Volume Profile Filter**: Order flow and liquidity analysis
---
#### 📈 How It Works
**Signal Generation**
The strategy identifies **Inverted Fair Value Gaps (IFVG)** - institutional order blocks that signal high-probability reversal or continuation zones. Each signal is validated through multiple confirmation filters before execution.
**Entry Logic**
- Limit orders placed at optimal price levels within FVG zones
- Price must touch the midline and close in favorable direction
- All filters must align for signal activation
**Exit Strategy**
- Stop Loss: Placed at the next opposing FVG level
- Take Profit: Calculated using nearest FVG in profit direction
- Automatic reversal entry option at TP levels
**Visual System**
- Color-coded boxes show FVG zones (green/red)
- Real-time position tracking with entry, SL, and TP lines
- Comprehensive dashboard displaying filter status and P&L
---
#### 🎯 Who Is This For?
✅ **Perfect For:**
- Futures traders using 10-20x leverage
- Traders seeking systematic, rule-based strategies
- Those who want automated SL/TP management
- 1-hour chart swing traders
- Traders familiar with institutional concepts (FVG, order flow)
❌ **Not Ideal For:**
- Scalpers (designed for 1H timeframe)
- Spot-only traders (optimized for leveraged futures)
- Beginners unfamiliar with leverage risks
- Set-and-forget automated trading (requires monitoring)
---
#### 📊 What You Get
**Strategy Features:**
- Complete FVG detection and inversion system
- 4 professional-grade confirmation filters
- Automated SL/TP calculation and placement
- TP reversal entry system
- Volume Profile sentiment analysis
- Real-time position tracking dashboard
- Webhook alert support for automation
- Clean, organized code with detailed comments
**Visual Components:**
- FVG boxes with inversion coloring
- Volume Profile sentiment boxes (optional)
- Entry, SL, and TP lines for each position
- Position status table with live P&L
- Filter status dashboard
---
#### ⚙️ Customization Options
**Adjustable Filters (User Control):**
- SMA50 Filter (1H) - Trend alignment ON/OFF
- Momentum Filter - Directional strength ON/OFF
- RSI Divergence Filter - Reversal detection ON/OFF
- Volume Profile Filter - Order flow analysis ON/OFF
**Fixed Parameters (Optimized):**
- All core parameters are pre-optimized for 1H timeframe
- Ensures consistent performance without overwhelming options
- Prevents parameter over-fitting by users
---
#### ⚠️ Important Disclaimers
**Risk Warning:**
This strategy is designed for leveraged futures trading, which carries substantial risk. High leverage (10-20x) can result in rapid losses. Only trade with capital you can afford to lose.
**Performance:**
Past performance does not guarantee future results. Always backtest on your specific market and timeframe before live trading.
**Usage:**
This is a trading tool, not financial advice. Users are responsible for their own trading decisions and risk management.
**Requirements:**
- Understanding of futures trading and leverage
- Familiarity with Fair Value Gaps and institutional concepts
- Ability to monitor positions (not fully automated)
- Proper risk management discipline
---
#### 🔧 Technical Specifications
- **Platform:** TradingView Pine Script v5
- **Type:** Strategy (with backtesting capabilities)
- **Timeframe:** Optimized for 1H (works on other timeframes)
- **Markets:** Any futures market (crypto, stocks, indices, forex)
- **Repainting:** NO - All signals are final on bar close
- **Alerts:** Full webhook support for automation
- **Default Settings:** 10% position size, pyramiding enabled (max 10 positions)
---
#### 📞 Support
Questions about setup or usage? Contact the author through TradingView messages.
**Note:** This indicator is for educational and trading tool purposes only. The author is not responsible for trading losses. Trade responsibly and within your risk tolerance.

Quantura - Quantified Price Action StrategyIntroduction
“Quantura – Quantified Price Action Strategy” is an invite-only Pine Script strategy designed to combine multiple price action concepts into a single trading framework. It integrates supply and demand zones, liquidity sweeps and runs, fair value gaps (FVGs), RSI filters, and EMA trend confirmation. The strategy also provides a visual overlay with dynamic trend-colored candles for easier chart interpretation. It is intended for multi-market use across cryptocurrencies, Forex, equities, and indices.
Originality & Value
The strategy is original in how it unifies several institutional-style price action elements and validates trades only when they align. This reduces noise compared to using single indicators in isolation. Its unique value lies in the combination of:
Supply & Demand detection: Dynamic boxes identified through pivots, ATR, and volume sensitivity.
Liquidity sweeps and runs: Detects when swing highs/lows are broken and retested, distinguishing between liquidity grabs (sweeps) and directional runs.
RSI filter: Can be set to normal or aggressive, confirming momentum before trades.
Fair Value Gaps (FVGs): Optional detection and filtering of price inefficiencies.
EMA filter: Aligns trades with the broader market trend.
Trend candle visualization: Candles dynamically colored bullish, bearish, or neutral, based on strategy positions.
This layered confluence approach ensures that entries are not taken on a single condition but require agreement across several dimensions of market structure, momentum, and order flow.
Functionality & Indicators
Supply & Demand Zones: Zones are created when pivots, ATR sensitivity, and volume thresholds overlap.
Liquidity: Swing highs and lows are tracked, with options for sweep (fakeout/reversal) or run (continuation) detection.
RSI: Confirms long signals when oversold and shorts when overbought, with configurable aggressiveness.
FVG filter: Adds validation by requiring price interaction with inefficiency zones.
EMA filter: Ensures longs are above EMA and shorts below EMA.
Signals & Visualization: Trade entries are marked on the chart, while candles change color to reflect trade direction and status.
Parameters & Customization
Supply & Demand: Sensitivity (swing range, volume multiplier, ATR multiplier) and display options.
Liquidity filter: Mode (Run or Sweep), display, and swing length.
RSI: Enable/disable, length, and style (normal or aggressive).
Fair Value Gaps: Sensitivity via ATR factor, optional volume filter, and display toggles.
EMA: Length, enable/disable, and visualization.
Risk management: Up to three configurable take-profit levels, stop-loss, break-even logic, and capital-based position sizing.
Visualization: Custom candle coloring and optional overlay for better clarity.
Default Properties (Strategy Settings)
Initial Capital: 10,000 USD
Position Size: 100% of equity per trade (backtest default)
Commission: 0.1%
Slippage: 1
Pyramiding: 0 (only one position at a time)
Note: The default of 100% equity per trade is used for testing purposes only and would not be sustainable in real trading. A typical allocation in practice would be between 1–5% of account equity per trade, sometimes up to 10%.
Backtesting & Performance
Backtests on XPTUSD over 2.5 years with the default settings produced:
164 trades
67.68% win rate
Profit factor: 1.7
Maximum drawdown: 27.81%
These results show how the confluence of supply/demand, liquidity, and RSI filters can produce robust setups. However, past performance does not guarantee future results. While the trade count (164) is sufficient for statistical analysis, results may vary across markets and timeframes.
Risk Management
Three configurable take-profit levels with percentage allocation.
Initial stop-loss based on user-defined percentage.
Dynamic stop-loss that adjusts with market movement.
Break-even logic that shifts stops to entry after predefined gains.
Position sizing based on risk percentage of equity.
This framework allows both conservative and aggressive configurations, depending on user preference.
Limitations & Market Conditions
Works best in volatile and liquid markets such as crypto, metals, indices, and FX.
May produce false signals in low-volume or sideways environments.
Unexpected news or macro events can override technical conditions.
Default position sizing of 100% equity is highly aggressive and should be reduced before any practical use.
Usage Guide
Add “Quantura – Quantified Price Action Strategy” to your chart.
Select Supply & Demand, Liquidity, RSI, EMA, and FVG settings according to your market and timeframe.
Configure risk management: take-profits, stop-loss, and risk-per-trade percentage.
Use the Strategy Tester to analyze statistics, equity curve, and performance under different conditions.
Optimize parameters before applying the strategy to different markets.
Author & Access
Developed 100% by Quantura. Published as an Invite-Only script.
Important
This description complies with TradingView’s publishing rules. It clarifies originality, explains the underlying logic, discloses default properties, and presents backtest results with realistic disclaimers.

One For All Strategy by Anson🏆 Exclusive Indicator: One For All Strategy
.
📈 Works for stocks, forex, crypto, indices
📈 Easy to use, real-time alerts, no repaint
📈 No grid, no martingale, no hedging
📈 One position at a time
.
One For All Strategy by Anson
A multi-indicator TradingView strategy designed to identify long and short trading opportunities by combining trend-following and momentum signals, paired with risk management rules to guide entries and exits.
.
Core Logic & Key Indicator:
X Moving Average: A proprietary adaptive moving average that adjusts its responsiveness to price changes based on market volatility. It uses an efficiency ratio to modify its smoothing behavior—adapting to whether the market is trending or ranging. Users can toggle a setting to let this ratio dynamically adjust the indicator’s sensitivity or use a fixed smoothing factor.
.
Entry Conditions:
.
Long Entry: Triggered when momentum signals strength, price action aligns with a broader upward trend, the X MA indicates short-term upward momentum, and a minimum number of bars have passed since the last trade (to prevent overtrading).
.
Short Entry: Triggered when momentum signals weakness, price action aligns with a broader downward trend, the X MA indicates short-term downward momentum, and a minimum number of bars have passed since the last trade.
.
Exit Conditions:
.
Trailing Stop: Activates after a position has been open for a set number of bars (to avoid premature exits). A trailing stop—based on a percentage of the entry price—locks in profits as the trade moves favorably, adjusting dynamically to protect gains.
.
Additional Features:
Visualisation: Overlays the X MA (orange line) and price (semi-transparent blue) on the chart for clear signal tracking.
.
See the author's instructions on the right to learn how to get access to the strategy.

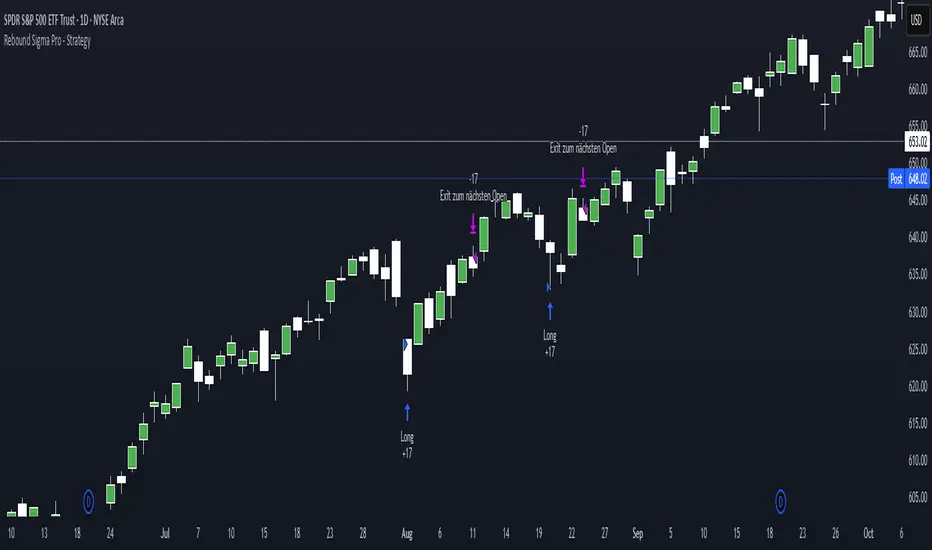
Rebound Sigma Pro - StrategyOverview
Rebound Sigma Pro is a mean-reversion indicator that detects statistically oversold conditions in trending markets.
It helps traders identify potential short-term rebounds based on momentum exhaustion and volatility-adjusted entry zones.
Concept
The indicator combines two quantitative components:
Short-term momentum to detect short-term exhaustion
Trend filter to ensure setups align with the long-term direction
When a stock in an uptrend becomes temporarily oversold, a limit-entry signal is plotted.
The trade is then tracked until short-term conditions normalize or a time-based exit occurs.
Visual Signals
Green Triangle: Suggests placing a limit order for the next session
Green Circle: Confirms entry was filled
Red Triangle: Signals an exit for the next session’s open
Orange Background: Pending order
Green Background: Position active
Red Background: Exit phase
Yellow Line: Entry reference price
User Inputs
Limit Entry (% below previous close) – Default 1 %
Use Limit Entry – Switch between limit or market entries
Enable Time Exit – Optional holding-period constraint
Maximum Holding Days
All other internal parameters (momentum length, filters) are pre-configured.
Alerts
Limit Order Signal: New setup detected
Entry Confirmed: Order filled
Exit Signal: Exit expected next day
Usage
Designed for liquid equities and ETFs
Works best in confirmed uptrends
Backtesting encouraged to adapt parameters per symbol and timeframe
Notes
Not an automated strategy; manual order execution required
Past behavior does not imply future performance
Always apply sound position sizing and risk management
Disclaimer
This indicator is provided for educational and analytical purposes only.
It does not constitute financial advice or performance assurance.
Twisted Forex's Doji + Area StrategyTitle
Twisted Forex’s Doji + Area Strategy
Description
What this strategy does
This strategy looks for doji candles forming inside or near supply/demand areas . Areas are built from swing pivots and sized with ATR, then tracked for retests (“confirmations”). When a doji prints close to an area and quality checks pass, the strategy places a trade with the stop beyond the doji and a configurable R:R target.
How areas (zones) are built
• Swings are detected with a user-set pivot length.
• Each swing spawns a horizontal area centered at the pivot price with half-height = zoneHalfATR × ATR .
• Duplicates are de-duplicated by center distance (ATR-scaled).
• Areas fade when broken beyond a buffer or after an optional age (expiry).
• Retests are recorded when price touches and then bounces away from the area; repeated reactions increase the zone’s “strength”.
Signal logic (summary)
Doji detection: strict or loose body criteria with optional minimum wick fractions and ATR-scaled minimum range.
Proximity: price must be inside/near a supply or demand area (proxATR × ATR).
Side resolution: overlap is resolved by (a) which side price penetrates more, (b) fast/slow EMA trend, or (c) nearest distance. Optional “previous candle flip” can bias long after a bearish candle and short after a bullish one.
Optional 1-bar confirmation: the bar after the doji must close away from the area by confirmATR × ATR .
Quality filter (Off/Soft/Strict): four checks—(i) wick rejection past the edge, (ii) doji closes in an edge “band” of the area, (iii) fresh touch (cooldown), (iv) approach impulse over a short lookback. In Strict , thresholds auto-tighten.
Orders & exits
• Long: stop below doji low minus buffer; Short: above doji high plus buffer.
• Target = rrMultiple × risk distance .
• Pyramiding is off by default.
Position sizing
You can size from the script or from Strategy Properties:
• Script-driven (default): set Position sizing = “Risk % of equity” and choose riskPercent (e.g., 1.0%). The script applies safe floors/rounding (FX micro-lots by default) so quantity never rounds to zero.
• Properties-driven : toggle Use TV Properties → Order size ON, then pick “Percent of equity” in Properties (e.g., 1%). The header includes safe defaults so trades still place.
Key inputs to explore
• Zone building : pivotLen, zoneHalfATR, minDepartureATR, expiryBars, breakATR, leftBars, dedupeATR.
• Doji & proximity : strictDoji, dojiBodyFrac, minWickFrac, minRangeATR, proxATR, minBarsBetween.
• Overlap resolution : usePenetration, useTrend (EMA 21/55), “previous candle flip”, needNextBarConf & confirmATR.
• Quality : qualityMode (Off/Soft/Strict), minQualPass/kStrict, wickPenATR, edgeBandFrac, approachLookback, approachMinATR, freshTouchBars.
• Zone strength gating : minStrengthSoft / minStrengthStrict.
• HTF confluence (optional) : useHTFTrend (HTF EMA 34/89) and/or useHTFZoneProx (HTF swing bands).
Tips to make it cleaner / higher quality
• Turn needNextBarConf ON and use confirmATR = 0.10–0.15 .
• Increase approachMinATR (e.g., 0.35–0.45) to require a stronger pre-touch impulse.
• Raise minStrengthSoft/Strict (e.g., 4–6) so only well-reacted zones can signal.
• Use signalsOnlyConfirmed ON if you prefer trades only from zones with retests (the script falls back gracefully when none exist yet).
• Nudge proxATR to 0.5–0.6 to demand tighter proximity to the level.
• Optional: enable useHTFTrend to filter counter-trend setups.
Default settings used in this publication
• Initial capital: 100,000 (illustrative).
• Slippage: 1 tick; Commission: 0% (you can raise commission if you prefer—spread is partly modeled by slippage).
• Sizing: Risk % of equity via inputs; riskPercent = 1.0% ; FX uses micro-lot floors by default.
• Quality: Off by default (Soft/Strict available).
• HTF trend gate: Off by default.
Backtesting notes
For a meaningful sample size, test on liquid symbols/timeframes that yield 100+ trades (e.g., majors on 5–15m over 1–2 years). Backtests are modelled and broker costs/spread vary—validate on your feed and forward-test.
How to read the chart
Shaded bands are supply (above) and demand (below). Brighter bands are the nearest K per side (visual aid). BUY/SELL labels mark entries; colored dots show entry/SL/TP levels. You can hide zones or unconfirmed zones for a cleaner view.
Disclaimer
This is educational material, not financial advice. Trading involves risk. Always test and size responsibly.

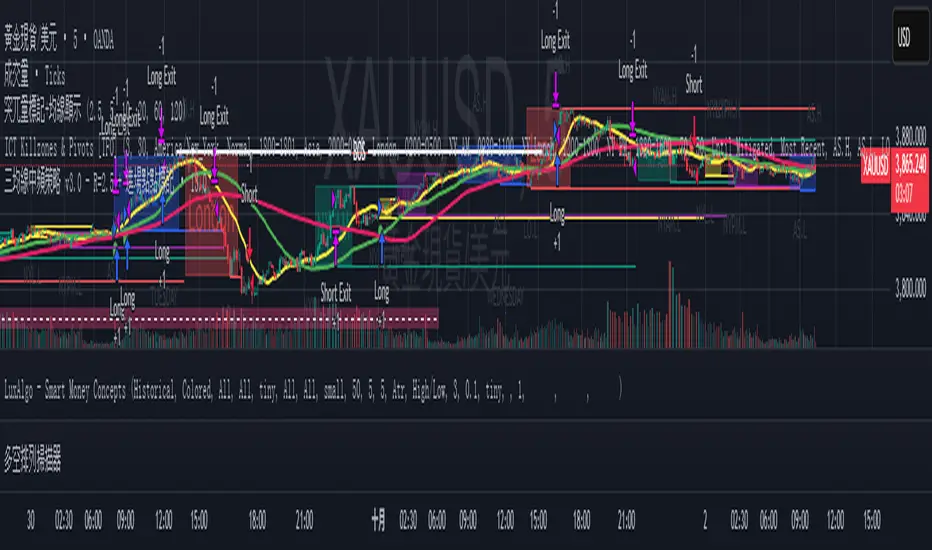
三均線中頻策略 v3.0 - R=2.5 + 進場點點標記📌 Core Strategy Concept
This is a medium-frequency trend-following model that utilizes three Simple Moving Averages to determine bullish or bearish alignment. It then enters trades in the direction of the trend when price confirms a breakout and applies a fixed risk-to-reward ratio (R). Stop loss and take profit levels are dynamically calculated based on moving averages, ensuring clear risk control and systematic execution.
✅ Strategy Advantages
📏 Clear Rules Trade conditions based on triple SMA alignment and price breakout; easy to replicate.
🛡 Defined Risk Stop loss and take profit are calculated based on moving averages with a fixed R ratio, ensuring disciplined risk management.
⚖️ Balanced Frequency Medium trade frequency avoids overtrading while still capturing sufficient opportunities.
👁 Visual Markers Entry points are visually marked on the chart for easy backtesting and live tracking.
RSI Momentum ScalperOverview
The "RSI Momentum Scalper" is a Pine Script v5 strategy crafted for trading highly volatile markets, with a special focus on newly listed cryptocurrencies. This strategy harnesses the Relative Strength Index (RSI) alongside volume analysis and momentum thresholds to pinpoint short-term trading opportunities. It supports both long and short trades, managed with customizable take profit, stop loss, and trailing stop levels, which are visually plotted on the chart for easy tracking.
Why I Created This Strategy
I developed the "RSI Momentum Scalper" because I was seeking a reliable trading strategy tailored to newly listed, highly volatile cryptocurrencies. These assets often experience rapid price fluctuations, rendering traditional strategies less effective. I aimed to create a tool that could exploit momentum and volume spikes while managing risk through adaptable exit parameters. This strategy is designed to address that need, offering a flexible approach for traders in dynamic crypto markets.
How It Works
The strategy utilizes RSI to identify momentum shifts, combined with volume confirmation, to trigger long or short entries. Trades are controlled with take profit, stop loss, and trailing stop levels, which adjust dynamically as the price moves in your favor. The trailing stop helps lock in profits, while the plotted exit levels provide clear visual cues for trade management.
Customizable Settings
The script is highly customizable, allowing you to adjust it to various market conditions and trading styles. Here’s a brief overview of the key settings:
Trade Mode: Select "Both," "Long Only," or "Short Only" to determine the trade direction.
(Default: Both)
RSI Length: Sets the lookback period for the RSI calculation (2 to 30).
(Default: 8)
A shorter length increases RSI sensitivity, suitable for volatile assets.
RSI Overbought: Defines the upper RSI threshold (60 to 99) for short entries.
(Default: 90)
Higher values signal stronger overbought conditions.
RSI Oversold: Defines the lower RSI threshold (1 to 40) for long entries.
(Default: 10)
Lower values indicate stronger oversold conditions.
RSI Momentum Threshold: Sets the minimum RSI momentum change (1 to 15) to trigger entries.
(Default: 14)
Adjusts the sensitivity to price momentum.
Volume Multiplier: Multiplies the volume moving average to filter high-volume bars (1.0 to 3.0).
(Default: 1)
Higher values require stronger volume confirmation.
Volume MA Length: Sets the lookback period for the volume moving average (5 to 50).
(Default: 13)
Influences the volume trend sensitivity.
Take Profit %: Sets the profit target as a percentage of the entry price (0.1 to 10.0).
(Default: 4.15)
Determines when to close a winning trade.
Stop Loss %: Sets the loss limit as a percentage of the entry price (0.1 to 6.0).
(Default: 1.85)
Protects against significant losses.
Trailing Stop %: Sets the trailing stop distance as a percentage (0.1 to 4.0).
(Default: 2.55)
Locks in profits as the price moves favorably.
Visual Features
Exit Levels: Take profit (green), fixed stop loss (red), and trailing stop (orange) levels are plotted when in a position.
Performance Table: Displays win rate, total trades, and net profit in the top-right corner.
How to Use
Add the strategy to your chart in TradingView.
Adjust the input settings based on the cryptocurrency and timeframe you’re trading.
Monitor the plotted exit levels for trade management.
Use the performance table to assess the strategy’s performance over time.
Notes
Test the strategy on a demo account or with historical data before live trading.
The strategy is optimized for short-term scalping; adjust settings for longer timeframes if needed.

Dynamic Swing Anchored VWAP STRAT (Zeiierman/PineIndicators)Dynamic Swing Anchored VWAP STRATEGY — Zeiierman × PineIndicators (Pine Script v6)
A pivot-to-pivot Anchored VWAP strategy that adapts to volatility, enters long on bullish structure, and closes on bearish structure. Built for TradingView in Pine Script v6.
Full credits to zeiierman.
Repainting notice: The original indicator logic is repainting. Swing labels (HH/HL/LH/LL) are finalized after enough bars have printed, so labels do not occur in real time. It is not possible to execute at historical label points. Treat results as educational and validate with Bar Replay and paper trading before considering any discretionary use.
Concept
The script identifies swing highs/lows over a user-defined lookback ( Swing Period ). When structure flips (most recent swing low is newer than the most recent swing high, or vice versa), a new regime begins.
At each confirmed pivot, a fresh Anchored VWAP segment is started and updated bar-by-bar using an EWMA-style decay on price×volume and volume.
Responsiveness is controlled by Adaptive Price Tracking (APT) . Optionally, APT auto-adjusts with an ATR ratio so that high volatility accelerates responsiveness and low volatility smooths it.
Longs are opened/held in bullish regimes and closed when the regime turns bearish. No short positions are taken by design.
How it works (under the hood)
Swing detection: Uses ta.highestbars / ta.lowestbars over prd to update swing highs (ph) and lows (pl), plus their bar indices (phL, plL).
Regime logic: If phL > plL → bullish regime; else → bearish regime. A change in this condition triggers a re-anchor of the VWAP at the newest pivot.
Adaptive VWAP math: APT is converted to an exponential decay factor ( alphaFromAPT ), then applied to running sums of price×volume and volume, producing the current VWAP estimate.
Rendering: Each pivot-anchored VWAP segment is drawn as a polyline and color-coded by regime. Optional structure labels (HH/HL/LH/LL) annotate the swing character.
Orders: On bullish flips, strategy.entry("L") opens/maintains a long; on bearish flips, strategy.close("L") exits.
Inputs & controls
Swing Period (prd) — Higher values identify larger, slower swings; lower values catch more frequent pivots but add noise.
Adaptive Price Tracking (APT) — Governs the VWAP’s “half-life.” Smaller APT → faster/closer to price; larger APT → smoother/stabler.
Adapt APT by ATR ratio — When enabled, APT scales with volatility so the VWAP speeds up in turbulent markets and slows down in quiet markets.
Volatility Bias — Tunes the strength of APT’s response to volatility (above 1 = stronger effect; below 1 = milder).
Style settings — Colors for swing labels and VWAP segments, plus line width for visibility.
Trade logic summary
Entry: Long when the swing structure turns bullish (latest swing low is more recent than the last swing high).
Exit: Close the long when structure turns bearish.
Position size: qty = strategy.equity / close × 5 (dynamic sizing; scales with account equity and instrument price). Consider reducing the multiplier for a more conservative profile.
Recommended workflow
Apply to instruments with reliable volume (equities, futures, crypto; FX tick volume can work but varies by broker).
Start on your preferred timeframe. Intraday often benefits from smaller APT (more reactive); higher timeframes may prefer larger APT (smoother).
Begin with defaults ( prd=50, APT=20 ); then toggle “Adapt by ATR” and vary Volatility Bias to observe how segments tighten/loosen.
Use Bar Replay to watch how pivots confirm and how the strategy re-anchors VWAP at those confirmations.
Layer your own risk rules (stops/targets, max position cap, session filters) before any discretionary use.
Practical tips
Context filter: Consider combining with a higher-timeframe bias (e.g., daily trend) and using this strategy as an entry timing layer.
First pivot preference: Some traders prefer only the first bullish pivot after a bearish regime (and vice versa) to reduce whipsaw in choppy ranges.
Deviations: You can add VWAP deviation bands to pre-plan partial exits or re-entries on mean-reversion pulls.
Sessions: Session-based filters (RTH vs. ETH) can materially change behavior on futures and equities.
Extending the script (ideas)
Add stops/targets (e.g., ATR stop below last swing low; partial profits at k×VWAP deviation).
Introduce mirrored short logic for two-sided testing.
Include alert conditions for regime flips or for price-VWAP interactions.
Incorporate HTF confirmation (e.g., only long when daily VWAP slope ≥ 0).
Throttle entries (e.g., once per regime flip) to avoid over-trading in ranges.
Known limitations
Repainting: Swing labels and pivot confirmations depend on future bars; historical labels can look “perfect.” Treat them as annotations, not executable signals.
Execution realism: Strategy includes commission and slippage fields, yet actual fills differ by venue/liquidity.
No guarantees: Past behavior does not imply future results. This publication is for research/education only and not financial advice.
Defaults (backtest environment)
Initial capital: 10,000
Commission value: 0.01
Slippage: 1
Overlay: true
Max bars back: 5000; Max labels/polylines set for deep swing histories
Quick checklist
Add to chart and verify that the instrument has volume.
Use defaults, then tune APT and Volatility Bias with/without ATR adaptation.
Observe how each pivot re-anchors VWAP and how regime flips drive entries/exits.
Paper trade across several symbols/timeframes before any discretionary decisions.
Attribution & license
Original indicator concept and logic: Zeiierman — please credit the author.
Strategy wrapper and publication: PineIndicators .
License: CC BY-NC-SA 4.0 (Attribution-NonCommercial-ShareAlike). Respect the license when forking or publishing derivatives.

MACD StrategyOverview
The "MACD Strategy" is a straightforward trading strategy tested for BTCUSDT Futures on the 1-minute timeframe, leveraging the Moving Average Convergence Divergence (MACD) indicator to identify momentum-based buy and sell opportunities. Developed with input from expert trading analyst insights, this strategy combines technical precision with risk management, making it suitable for traders of all levels on platforms like TradingView. It focuses on capturing trend reversals and momentum shifts, with clear visual cues and automated alerts for seamless integration with trading bots (e.g., Bitget webhooks).
#### How It Works
This strategy uses the MACD indicator to generate trading signals based on momentum and trend direction:
- **Buy Signal**: Triggered when the MACD line crosses above the signal line, and the MACD histogram turns positive (above zero). This suggests increasing bullish momentum.
- **Sell Signal**: Triggered when the MACD line crosses below the signal line, and the MACD histogram turns negative (below zero), indicating growing bearish momentum.
Once a signal is detected, the strategy opens a position (long for buy, short for sell) with a position size calculated based on your risk tolerance. It includes a stop-loss to limit losses and a take-profit to lock in gains, both dynamically adjusted using the Average True Range (ATR) for adaptability to market volatility.
#### Key Features
- **MACD-Based Signals**: Relies solely on MACD for entry points, plotted in a separate pane for clear momentum analysis.
- **Risk Management**: Automatically calculates position size based on a percentage of your account balance and sets stop-loss and take-profit levels using ATR multipliers and a risk:reward ratio.
- **Visual Feedback**: Plots entry, stop-loss, and take-profit lines on the chart with labeled markers for easy tracking.
- **Alerts**: Includes Bitget webhook-compatible alerts for automated trading, notifying you of buy and sell signals in real-time.
#### Input Parameters
- **Account Balance**: Default 10000 – Set your initial trading capital to determine position sizing.
- **MACD Fast Length**: Default 12 – The short-term EMA period for MACD sensitivity.
- **MACD Slow Length**: Default 26 – The long-term EMA period for MACD calculation.
- **MACD Signal Length**: Default 9 – The smoothing period for the signal line.
- **Risk Per Trade (%)**: Default 3.0 – The percentage of your account balance risked per trade (e.g., 3% of 10000 = 300).
- **Risk:Reward Ratio**: Default 3.0 – The ratio of potential profit to risk (e.g., 3:1 means risking 1 to gain 3).
- **SL Multiplier**: Default 1.0 – Multiplies ATR to set the stop-loss distance (e.g., 1.0 x ATR).
- **TP Multiplier**: Default 3.0 – Multiplies ATR to set the take-profit distance, adjusted by the risk:reward ratio.
- **Line Length (bars)**: Default 25 – Duration in bars for displaying trade lines on the chart.
- **Label Position**: Default 'left' – Position of text labels (left or right) relative to trade lines.
- **ATR Period**: Default 14 – The number of periods for calculating ATR to measure volatility.
#### How to Use
1. **Add to Chart**: Load the "MACD Strategy" as a strategy and the "MACD Indicator" as a separate indicator on your TradingView chart (recommended for BTCUSDT Futures on the 1-minute timeframe).
2. **Customize Settings**: Adjust the input parameters based on your risk tolerance and market conditions. For BTCUSDT Futures, consider reducing `Risk Per Trade (%)` during high volatility (e.g., 1%) or increasing `SL Multiplier` for wider stops.
3. **Visual Analysis**: Watch the main chart for trade entry lines (green for buy, red for sell), stop-loss (red), and take-profit (green) lines with labels. Use the MACD pane below to confirm momentum shifts.
4. **Set Alerts**: Create alerts in TradingView for "Buy Signal" and "Sell Signal" to automate trades via Bitget webhooks.
5. **Backtest and Optimize**: Test the strategy on historical BTCUSDT Futures 1-minute data to fine-tune parameters. The short timeframe requires quick execution, so monitor closely for slippage or latency.
#### Tips for Success
- **Market Conditions**: This strategy performs best in trending markets on the 1-minute timeframe. Avoid choppy conditions where MACD crossovers may produce false signals.
- **Risk Management**: Start with the default 3% risk per trade and adjust downward (e.g., 1%) during volatile periods like BTCUSDT news events. The 3:1 risk:reward ratio targets consistent profitability.
- **Timeframe**: Optimized for 1-minute charts; switch to 5-minute or 15-minute for less noise if needed.
- **Confirmation**: Cross-check MACD signals with price action or support/resistance levels for higher accuracy on BTCUSDT Futures.
#### Limitations
- This strategy relies solely on MACD, so it may lag in fast-moving or sideways markets. Consider adding a secondary filter (e.g., RSI) if needed.
- Stop-loss and take-profit are ATR-based and may need adjustment for BTCUSDT Futures’ high volatility, especially during leverage trading.
#### Conclusion
The "MACD Strategy" offers a simple yet effective way to trade momentum shifts using the MACD indicator, tested for BTCUSDT Futures on the 1-minute timeframe, with robust risk management and visual tools. Whether you’re scalping crypto futures or exploring short-term trends, this strategy provides a solid foundation for automated or manual trading. Share your feedback or customizations in the comments, and happy trading!

Reversed Large Bars Strategy with Williams %RThis strategy script is ideal for volatile assets such as Natural Gas (NATGAS) or Crude Oil (WTI/Brent), which often exhibit strong price movements with high volume.
How It Works:
The strategy identifies short-term reversals after two consecutive large candles with significant volume, under specific conditions. It is based on the assumption that after strong directional moves, a temporary price exhaustion or reversal may occur.
Logic Breakdown:
Large Bar Detection:
A bar is considered “large” if its range (high – low) is significantly higher than the average (by a configurable percentage) and is accompanied by a spike in volume.
Two Consecutive Large Bars:
Entry is only considered when two large bars appear back-to-back — this strengthens the momentum signal.
Candle Type Filter:
For short entries: Two consecutive large bullish bars followed by a bullish candle → implies overextension upwards.
For long entries: Two consecutive large bearish bars followed by a bearish candle → implies overextension downwards.
Williams %R Filter:
The Williams %R oscillator adds confirmation based on overbought/oversold conditions:
Longs are allowed when %R is below the oversold level.
Shorts are allowed when %R is above the overbought level.
Ratio Logic:
A running percentage of bullish vs bearish large bars is tracked over a rolling period. This ensures entries are filtered based on broader context and trend dominance.
Stop Loss / Take Profit / Breakeven:
Each trade includes configurable SL/TP, and optional breakeven logic:
If unrealized profit exceeds a set percentage, SL is moved to entry (optionally with a buffer).

Breackout V8 MomentumBreakout V6 Strategy with Fibonacci TPs
Description
Developed by Coton, this automated trading tool is designed to identify and capitalize on breakouts from consolidation zones, supported by momentum indicators. It leverages technical indicators to detect significant price movements and enters positions with take-profits based on Fibonacci levels and a trailing stop to protect profits. Optimized for crypto trading , it operates in Scalping (1m) or Intraday (5m) modes.
Indicators Used
Volatility Bands : Identify price compression and expansion zones to detect consolidations and breakouts.
Momentum Indicators : Measure the strength and direction of price movements to confirm breakouts.
Volume Indicators : Validate breakouts with significant increases in trading activity.
Dynamic Levels : Define entry and exit points based on adaptive calculations.
Features
Breakout Detection : Identifies exits from consolidation zones with quality filters.
Fibonacci Take-Profits : Profit targets calculated using extension levels to maximize gains.
Trailing Stop : Protects profits by dynamically adjusting the stop-loss based on volatility.
Visualization : Displays consolidation zones, entry levels, stop-losses, and take-profits on the chart.
Alerts : Notifications for confirmed and ongoing breakouts with a minimum risk/reward ratio.
Table : Shows the strategy status and estimated leverage in real-time.
Input Parameters
Trading Mode: Scalping (1m) or Intraday (5m) (default: Intraday)
Fibonacci Level for TP: 1.618 (adjustable 0.5-5.0)
Minimum RR for Alerts: 1.2 (filters alerts)
Alerts
Confirmed Breakout (validated movement with quality criteria).
Ongoing Breakout (tracked with minimum risk/reward ratio, every 5 candles).
Disclaimers
Not financial advice; test in demo mode.
Past performance is not indicative of future results.
High risk in crypto trading; use proper risk management (1-2% per trade).
Commission (0.1%) may impact results; adjust for your broker.
Contact
Coton for questions or improvements.

LANZ Strategy 6.0 [Backtest]🔷 LANZ Strategy 6.0 — Precision Backtesting Based on 09:00 NY Candle, Dynamic SL/TP, and Lot Size per Trade
LANZ Strategy 6.0 is the simulation version of the original LANZ 6.0 indicator. It executes a single LIMIT BUY order per day based on the 09:00 a.m. New York candle, using dynamic Stop Loss and Take Profit levels derived from the candle range. Position sizing is calculated automatically using capital, risk percentage, and pip value — allowing accurate trade simulation and performance tracking.
📌 This is a strategy script — It simulates real trades using strategy.entry() and strategy.exit() with full money management for risk-based backtesting.
🧠 Core Logic & Trade Conditions
🔹 BUY Signal Trigger:
At 09:00 a.m. NY (New York time), if:
The current candle is bullish (close > open)
→ A BUY order is placed at the candle’s close price (EP)
Only one signal is evaluated per day.
⚙️ Stop Loss / Take Profit Logic
SL can be:
Wick low (0%)
Or dynamically calculated using a % of the full candle range
TP is calculated using the user-defined Risk/Reward ratio (e.g., 1:4)
The TP and SL levels are passed to strategy.exit() for each trade simulation.
💰 Risk Management & Lot Size Calculation
Before placing the trade:
The system calculates pip distance from EP to SL
Computes the lot size based on:
Account capital
Risk % per trade
Pip value (auto or manual)
This ensures every trade uses consistent, scalable risk regardless of instrument.
🕒 Manual Close at 3:00 p.m. NY
If the trade is still open by 15:00 NY time, it will be closed using strategy.close().
The final result is the actual % gain/loss based on how far price moved relative to SL.
📊 Backtest Accuracy
One trade per day
LIMIT order at the candle close
SL and TP pre-defined at execution
No repainting
Session-restricted (only runs on 1H timeframe)
✅ Ideal For:
Traders who want to backtest a clean and simple daily entry system
Strategy developers seeking reproducible, high-conviction trades
Users who prefer non-repainting, session-based simulations
👨💻 Credits:
💡 Developed by: LANZ
🧠 Logic & Money Management Engine: LANZ
📈 Designed for: 1H charts
🧪 Purpose: Accurate simulation of LANZ 6.0's NY Candle Entry system

EMA and Dow Theory Strategies🌐 Strategy Description
📘 Overview
This is a hybrid strategy that combines EMA crossovers, Dow Theory swing logic, and multi-timeframe trend overlays. It is suitable for intraday to short-term trading on any asset class: crypto, forex, stocks, and indices.
The strategy provides precise entry/exit signals, dynamic stop-loss and scale-out, and highly visual trade guidance.
🧠 Key Features
・Dual EMA crossover system (applied to both symbol and external index)
・Dow Theory-based swing high/low detection for trend confirmation
・Visual overlay of higher timeframe swing trend (htfTrend)
・RSI filter to avoid overbought/oversold entries
・Dynamic partial take-profit when trend weakens
・Custom stop-loss (%) control
・Visualized trade PnL labels directly on chart
・Alerts for entry, stop-loss, partial exit
・Gradient background zones for swing zones and trend visualization
・Auto-tracked metrics: APR, drawdown, win rate, equity curve
⚙️ Input Parameters
| Parameter | Description |
| ------------------------- | -------------------------------------------------------- |
| Fast EMA / Slow EMA | Periods for detecting local trend via EMAs |
| Index Fast EMA / Slow EMA | EMAs applied to external reference index |
| StopLoss | Maximum loss threshold in % |
| ScaleOut Threshold | Scale-out percentage when trend changes color |
| RSI Period / Levels | RSI period and overbought/oversold levels |
| Swing Detection Length | Number of bars used to detect swing highs/lows |
| Stats Display Options | Toggle PnL labels and position of statistics table |
🧭 About htfTrend (Higher Timeframe Trend)
The script includes a higher timeframe trend (htfTrend) calculated using Dow Theory (pivot highs/lows).
This trend is only used for visual guidance, not for actual entry conditions.
Why? Strictly filtering trades by higher timeframe often leads to missed opportunities and low frequency.
By keeping htfTrend visual-only, traders can still refer to macro structure but retain trade flexibility.
Use it as a contextual tool, not a constraint.
ストラテジー説明
📘 概要
本ストラテジーは、EMAクロスオーバー、ダウ理論によるスイング判定、**上位足トレンドの視覚表示(htfTrend)**を組み合わせた複合型の短期トレーディング戦略です。
仮想通貨・FX・株式・指数など幅広いアセットに対応し、デイトレード〜スキャルピング用途に適しています。
動的な利確/損切り、視覚的にわかりやすいエントリー/イグジット、統計表示を搭載しています。
🧠 主な機能
・対象銘柄+外部インデックスのEMAクロスによるトレンド判定
・ダウ理論に基づいたスイング高値・安値検出とトレンド判断
・上位足スイングトレンド(htfTrend)の視覚表示
・RSIフィルターによる過熱・売られすぎの回避
・トレンドの弱まりに応じた部分利確(スケールアウト)
・**損切り閾値(%)**をカスタマイズ可能
・チャート上に損益ラベル表示
・アラート完備(エントリー・決済・部分利確)
・トレンドゾーンを可視化する背景グラデーション
・勝率・ドローダウン・APR・資産増加率などの自動表示
| 設定項目名 | 説明内容 |
| --------------------- | -------------------------- |
| Fast EMA / Slow EMA | 銘柄に対して使用するEMAの期間設定 |
| Index Fast / Slow EMA | 外部インデックスのEMA設定 |
| 損切り(StopLoss) | 損切りラインのしきい値(%で指定) |
| 部分利確しきい値 | トレンド弱化時にスケールアウトする割合(%) |
| RSI期間・水準 | RSI計算期間と、過熱・売られすぎレベル設定 |
| スイング検出期間 | スイング高値・安値の検出に使用するバー数 |
| 統計表示の切り替え | 損益ラベルや統計テーブルの表示/非表示選択 |
🧭 上位足トレンド(htfTrend)について
本スクリプトには、上位足でのスイング高値・安値の更新に基づく**htfTrend(トレンド判定)が含まれています。
これは視覚的な参考情報であり、エントリーやイグジットには直接使用されていません。**
その理由は、上位足を厳密にロジックに組み込むと、トレード機会の損失が増えるためです。
このスクリプトでは、**判断の補助材料として「表示のみに留める」**設計を採用しています。
→ 裁量で「利確を早める」「逆張りを避ける」判断に活用可能です。

RSI SwingRadar🧠 Strategy Overview
This long-only strategy combines RSI/MA crossovers with ATR-based risk management, designed for cleaner entries during potential bounce phases — especially tuned for assets like XMR/USDT.
🔍 Core Logic:
- RSI Crossover: Entry occurs when the 14-period RSI crosses above its 14-period SMA, signaling a potential shift in momentum.
- Oversold Filter: The RSI must have been below a user-defined oversold threshold (default: 35) on the previous candle, filtering for bounce setups after a pullback.
- ATR-Based Stop/Target: Stop-loss is placed below the low by a user-adjustable ATR multiplier (default: 0.5×). Take-profit is calculated with a Risk:Reward multiplier (default: 4×).
These elements work in tandem — RSI crossovers give momentum confirmation, oversold filtering adds context, and ATR-based exits adapt to volatility, creating a compact yet responsive strategy.
📉 Visuals:
- Dynamic Bands: The chart displays the active stop-loss, entry price, and take-profit as colored bands for easy visual tracking.
- Clean Overlay: Designed with simplicity — only confirmed setups are shown, keeping noise low.
✅ Suggested Use:
- Works best on XMR/USDT or similarly trending assets.
- Best suited for pullback entries during broader uptrends.
- Adjustable for different volatility conditions and asset behaviors.
⚠️ Disclaimer
- This strategy is for educational and research purposes only.
- It does not guarantee profitability in any market.
- Always backtest, forward-test, and understand your own risk tolerance before using any
strategy in a live environment.
- Past performance is not indicative of future results.
- This script is not financial advice.
