Superior-Range Bound Renko - Alerts - 11-29-25 - Signal LynxSuperior-Range Bound Renko – Alerts Edition with Advanced Risk Management Template
Signal Lynx | Free Scripts supporting Automation for the Night-Shift Nation 🌙
1. Overview
This is the Alerts & Indicator Edition of Superior-Range Bound Renko (RBR).
The Strategy version is built for backtesting inside TradingView.
This Alerts version is built for automation: it emits clean, discrete alert events that you can route into webhooks, bots, or relay engines (including your own Signal Lynx-style infrastructure).
Under the hood, this script contains the same core engine as the strategy:
Adaptive Range Bounding based on volatility
Renko Brick Emulation on standard candles
A stack of Laguerre Filters for impulse detection
K-Means-style Adaptive SuperTrend for trend confirmation
The full Signal Lynx Risk Management Engine (state machine, layered exits, AATS, RSIS, etc.)
The difference is in what we output:
Instead of placing historical trades, this version:
Plots the entry and RM signals in a separate pane (overlay = false)
Exposes alertconditions for:
Long Entry
Short Entry
Close Long
Close Short
TP1, TP2, TP3 hits (Staged Take Profit)
This makes it ideal as the signal source for automated execution via TradingView Alerts + Webhooks.
2. Quick Action Guide (TL;DR)
Best Timeframe:
4H and above. This is a swing-trading / position-trading style engine, not a micro-scalper.
Best Assets:
Volatile but structured markets, e.g.:
BTC, ETH, XAUUSD (Gold), GBPJPY, and similar high-volatility majors or indices.
Script Type:
indicator() – Alerts & Visualization Only
No built-in order placement
All “orders” are emitted as alerts for your external bot or manual handling
Strategy Type:
Volatility-Adaptive Trend Following + Impulse Detection
using Renko-like structure and multi-layer Laguerre filters.
Repainting:
Designed to be non-repainting on closed candles.
The underlying Risk Management engine is built around previous-bar data (close , high , low ) for execution-critical logic.
Intrabar values can move while the bar is forming (normal for any advanced signal), but once a bar closes, the alert logic is stable.
Recommended Alert Settings:
Condition: one of the built-in signals (see section 3.B)
Options: “Once Per Bar Close” is strongly recommended for automation
Message: JSON, CSV, or simple tokens – whatever your webhook / relay expects
3. Detailed Report: How the Alerts Edition Works
A. Relationship to the Strategy Version
The Alerts Edition shares the same internal logic as the strategy version:
Same Adaptive Lookback and volatility normalization
Same Range and Close Range construction
Same Renko Brick Emulator and directional memory (renkoDir)
Same Fib structures, Laguerre stack, K-Means SuperTrend, and Baseline signals (B1, B2)
Same Risk Management Engine and layered exits
In the strategy script, these signals are wired into strategy.entry, strategy.exit, and strategy.close.
In the alerts script:
We still compute the final entry/exit signals (Fin, CloseEmAll, TakeProfit1Plot, etc.)
Instead of placing trades, we:
Plot them for visual inspection
Expose them via alertcondition(...) so that TradingView can fire alerts.
This ensures that:
If you use the same settings on the same symbol/timeframe, the Alerts Edition and Strategy Edition agree on where entries and exits occur.
(Subject only to normal intrabar vs. bar-close differences.)
B. Signals & Alert Conditions
The alerts script focuses on discrete, automation-friendly events.
Internally, the main signals are:
Fin – Final entry decision from the RM engine
CloseEmAll – RM-driven “hard close” signal (for full-position exits)
TakeProfit1Plot / 2Plot / 3Plot – One-time event markers when each TP stage is hit
On the chart (in the separate indicator pane), you get:
plot(Fin) – where:
+2 = Long Entry event
-2 = Short Entry event
plot(CloseEmAll) – where:
+1 = “Close Long” event
-1 = “Close Short” event
plot(TP1/TP2/TP3) (if Staged TP is enabled) – integer tags for TP hits:
+1 / +2 / +3 = TP1 / TP2 / TP3 for Longs
-1 / -2 / -3 = TP1 / TP2 / TP3 for Shorts
The corresponding alertconditions are:
Long Entry
alertcondition(Fin == 2, title="Long Entry", message="Long Entry Triggered")
Fire this to open/scale a long position in your bot.
Short Entry
alertcondition(Fin == -2, title="Short Entry", message="Short Entry Triggered")
Fire this to open/scale a short position.
Close Long
alertcondition(CloseEmAll == 1, title="Close Long", message="Close Long Triggered")
Fire this to fully exit a long position.
Close Short
alertcondition(CloseEmAll == -1, title="Close Short", message="Close Short Triggered")
Fire this to fully exit a short position.
TP 1 Hit
alertcondition(TakeProfit1Plot != 0, title="TP 1 Hit", message="TP 1 Level Reached")
First staged take profit hit (either long or short). Your bot can interpret the direction based on position state or message tags.
TP 2 Hit
alertcondition(TakeProfit2Plot != 0, title="TP 2 Hit", message="TP 2 Level Reached")
TP 3 Hit
alertcondition(TakeProfit3Plot != 0, title="TP 3 Hit", message="TP 3 Level Reached")
Together, these give you a complete trade lifecycle:
Open Long / Short
Optionally scale out via TP1/TP2/TP3
Close remaining via Close Long / Close Short
All while the Risk Management Engine enforces the same logic as the strategy version.
C. Using This Script for Automation
This Alerts Edition is designed for:
Webhook-based bots
Execution relays (e.g., your own Lynx-Relay-style engine)
Dedicated external trade managers
Typical setup flow:
Add the script to your chart
Same symbol, timeframe, and settings you use in the Strategy Edition backtests.
Configure Inputs:
Longs / Shorts enabled
Risk Management toggles (SL, TS, Staged TP, AATS, RSIS)
Weekend filter (if you do not want weekend trades)
RBR-specific knobs (Adaptive Lookback, Brick type, ATR vs Standard Brick, etc.)
Create Alerts for Each Event Type You Need:
Long Entry
Short Entry
Close Long
Close Short
TP1 / TP2 / TP3 (optional, if your bot handles partial closes)
For each:
Condition: the corresponding alertcondition
Option: “Once Per Bar Close” is strongly recommended
Message:
You can use structured JSON or a simple token set like:
{"side":"long","event":"entry","symbol":"{{ticker}}","time":"{{timenow}}"}
or a simpler text for manual trading like:
LONG ENTRY | {{ticker}} | {{interval}}
Wire Up Your Bot / Relay:
Point TradingView’s webhook URL to your execution engine
Parse the messages and map them into:
Exchange
Symbol
Side (long/short)
Action (open/close/partial)
Size and risk model (this script does not position-size for you; it only signals when, not how much.)
Because the alerts come from a non-repainting, RM-backed engine that you’ve already validated via the Strategy Edition, you get a much cleaner automation pipeline.
D. Repainting Protection (Alerts Edition)
The same protections as the Strategy Edition apply here:
Execution-critical logic (trailing stop, TP triggers, SL, RM state changes) uses previous bar OHLC:
open , high , low , close
No security() with lookahead or future-bar dependencies.
This means:
Alerts are designed to fire on states that would have been visible at bar close, not on hypothetical “future history.”
Important practical note:
Intrabar: While a bar is forming, internal conditions can oscillate.
Bar Close: With “Once Per Bar Close” alerts, the fired signal corresponds to the final state of the engine for that candle, matching your Strategy Edition expectations.
4. For Developers & Modders
You can treat this Alerts script as an ”RM + Alert Framework” and inject any signal logic you want.
Where to plug in:
Find the section:
// BASELINE & SIGNAL GENERATION
You’ll see how B1 and B2 are built from the RBR stack and then combined:
baseSig = B2
altSig = B1
finalSig = sigSwap ? baseSig : altSig
To use your own logic:
Replace or wrap the code that sets baseSig / altSig with your own conditions:
e.g., RSI, MACD, Heikin Ashi filters, candle patterns, volume filters, etc.
Make sure your final decision is still:
2 → Long / Buy signal
-2 → Short / Sell signal
0 → No trade
finalSig is then passed into the RM engine and eventually becomes Fin, which:
Drives the Long/Short Entry alerts
Interacts with the RM state machine to integrate properly with AATS, SL, TS, TP, etc.
Because this script already exposes alertconditions for key lifecycle events, you don’t need to re-wire alerts each time — just ensure your logic feeds into finalSig correctly.
This lets you use the Signal Lynx Risk Management Engine + Alerts wrapper as a drop-in chassis for your own strategies.
5. About Signal Lynx
Automation for the Night-Shift Nation 🌙
Signal Lynx builds tools and templates that help traders move from:
“I have an indicator” → “I have a structured, automatable strategy with real risk management.”
This Superior-Range Bound Renko – Alerts Edition is the automation-focused companion to the Strategy Edition. It’s designed for:
Traders who backtest with the Strategy version
Then deploy live signals with this Alerts version via webhooks or bots
While relying on the same non-repainting, RM-driven logic
We release this code under the Mozilla Public License 2.0 (MPL-2.0) to support the Pine community with:
Transparent, inspectable logic
A reusable Risk Management template
A reference implementation of advanced adaptive logic + alerts
If you are exploring full-stack automation (TradingView → Webhooks → Exchange / VPS), keep Signal Lynx in your search.
License: Mozilla Public License 2.0 (Open Source).
If you build improvements or helpful variants, please consider sharing them back with the community.
在脚本中搜索"tradingview+筹码结构"

Etherium CME gaps multi-timeframe auto finderThis indicator is a powerful tool that automatically detects and visualizes price gaps (Gaps) in the Ethereum CME futures market across multiple timeframes and also provides alert functionality. Price gaps occur when the futures market is inactive for a certain period, often acting as potential support or resistance zones.
What is an Ethereum CME Gap?
CME (Chicago Mercantile Exchange) is one of the largest derivatives exchanges globally. The Ethereum CME futures market is closed on weekends and certain holidays. When the market reopens, a price difference may occur between the previous closing price and the new opening price, referred to as a "CME Gap."
Key Features of the Indicator
Multi-timeframe gap detection: Detects and displays gaps across 5m, 15m, 30m, 1h, 4h, 1d timeframes simultaneously.
Customizable CME Symbol: You can specify Ethereum CME futures symbols, such as ETH1!.
Two gap price display methods:
CME_price: Displays the gap based on the actual price levels in the CME futures market.
Chart_price: Adjusts the gap to match the price levels on the chart being viewed (e.g., spot market). This helps visualize the impact of futures gaps on the spot market.
Visual customization:
Individual color settings for bullish/bearish gap boxes for each timeframe.
Adjust the extension (display length) of gap boxes in bars.
Configure label display, position, text size, background, and text color.
Highlight significant gaps: Emphasize gaps above a specified percentage with a unique color and border thickness.
Alert functionality: Receive notifications when a gap is detected, with options to enable alerts only for specific timeframes.
Why CME Gaps Matter
Traders often consider CME gaps as significant price zones.
Gap Fill: Historical data shows that many gaps tend to get "filled" over time, meaning the price returns to the gap area, reaching the start or end point of the gap.
Support/Resistance: Unfilled gaps can serve as potential support (Bullish Gap) or resistance (Bearish Gap) zones.
Bullish Gap: Occurs when the current opening price is higher than the previous closing price. Typically leaves an unfilled gap below (previous high), which can act as potential support.
Bearish Gap: Occurs when the current opening price is lower than the previous closing price. Typically leaves an unfilled gap above (previous low), which can act as potential resistance.
How to Use the Indicator
Add Indicator on TradingView: Click the "Indicators" button on the TradingView chart.
Find the indicator in "My Scripts" or "Invite-Only Scripts" and add it to the chart.
Adjust Settings: Once the indicator is added, click the settings (gear) icon to adjust inputs.
CME Symbol (ETH): ETH1! is typically the default symbol for Ethereum CME futures. Confirm based on your broker or data feed.
Min gap %: Set the minimum gap size in percentage; smaller gaps will not be displayed.
Select Exchanges to Display gap price: Choose between "CME_price" or "Chart_price." For viewing futures gaps on a spot chart, "Chart_price" is recommended.
Show Xm/h/d gap boxes: Select which timeframe gap boxes to display.
Color, Extension, Label settings: Customize the visual aspects of gap boxes and labels.
Highlight gap % (>=): Set the minimum percentage for highlighting significant gaps.
Enable Alerts: Choose whether to receive alerts when a gap is detected.
Alert Timeframe: Select whether alerts apply to all timeframes or specific ones only.
Chart Analysis
Once the indicator is applied, gap boxes for the selected timeframes appear on the chart.
Green shades indicate Bullish Gaps, and red shades indicate Bearish Gaps (default green can be customized, and bearish gap color can be set separately).
Highlighted gaps may carry higher significance and should be monitored carefully.
Potential trading opportunities can be explored when the price approaches or attempts to fill a gap.
Usage Strategies (Examples)
Support/Resistance Confirmation: The lower boundary of a bullish gap can act as potential support, while the upper boundary of a bearish gap can act as potential resistance. Observe for reversals or breakouts when price reaches these areas.
Retracement Trading: Trade when the price returns to fill a gap after leaving it through a sharp move up or down.
Multi-timeframe Analysis: Gaps overlapping across multiple timeframes can form stronger support/resistance zones.
Considerations
* "Gap Filled" Condition: The indicator does not draw a gap if it determines that the gap has already been filled by the current bar’s low (bullish gap) or high (bearish gap).
* Tool Only: This indicator is a gap detection tool and should not be used alone for trading decisions. Always combine with other technical analysis tools and your trading strategy.
* Past Data ≠ Future Guarantee: Historical gap fill trends do not guarantee future occurrences.
This indicator allows effective tracking of Ethereum CME futures gaps and provides valuable insights for enhancing your trading strategy.

Range Oscillator Strategy + Stoch Confirm🔹 Short summary
This is a free, educational long-only strategy built on top of the public “Range Oscillator” by Zeiierman (used under CC BY-NC-SA 4.0), combined with a Stochastic timing filter, an EMA-based exit filter and an optional risk-management layer (SL/TP and R-multiple exits). It is NOT financial advice and it is NOT a magic money machine. It’s a structured framework to study how range-expansion + momentum + trend slope can be combined into one rule-based system, often with intentionally RARE trades.
────────────────────────
0. Legal / risk disclaimer
────────────────────────
• This script is FREE and public. I do not charge any fee for it.
• It is for EDUCATIONAL PURPOSES ONLY.
• It is NOT financial advice and does NOT guarantee profits.
• Backtest results can be very different from live results.
• Markets change over time; past performance is NOT indicative of future performance.
• You are fully responsible for your own trades and risk.
Please DO NOT use this script with money you cannot afford to lose. Always start in a demo / paper trading environment and make sure you understand what the logic does before you risk any capital.
────────────────────────
1. About default settings and risk (very important)
────────────────────────
The script is configured with the following defaults in the `strategy()` declaration:
• `initial_capital = 10000`
→ This is only an EXAMPLE account size.
• `default_qty_type = strategy.percent_of_equity`
• `default_qty_value = 100`
→ This means 100% of equity per trade in the default properties.
→ This is AGGRESSIVE and should be treated as a STRESS TEST of the logic, not as a realistic way to trade.
TradingView’s House Rules recommend risking only a small part of equity per trade (often 1–2%, max 5–10% in most cases). To align with these recommendations and to get more realistic backtest results, I STRONGLY RECOMMEND you to:
1. Open **Strategy Settings → Properties**.
2. Set:
• Order size: **Percent of equity**
• Order size (percent): e.g. **1–2%** per trade
3. Make sure **commission** and **slippage** match your own broker conditions.
• By default this script uses `commission_value = 0.1` (0.1%) and `slippage = 3`, which are reasonable example values for many crypto markets.
If you choose to run the strategy with 100% of equity per trade, please treat it ONLY as a stress-test of the logic. It is NOT a sustainable risk model for live trading.
────────────────────────
2. What this strategy tries to do (conceptual overview)
────────────────────────
This is a LONG-ONLY strategy designed to explore the combination of:
1. **Range Oscillator (Zeiierman-based)**
- Measures how far price has moved away from an adaptive mean.
- Uses an ATR-based range to normalize deviation.
- High positive oscillator values indicate strong price expansion away from the mean in a bullish direction.
2. **Stochastic as a timing filter**
- A classic Stochastic (%K and %D) is used.
- The logic requires %K to be below a user-defined level and then crossing above %D.
- This is intended to catch moments when momentum turns up again, rather than chasing every extreme.
3. **EMA Exit Filter (trend slope)**
- An EMA with configurable length (default 70) is calculated.
- The slope of the EMA is monitored: when the slope turns negative while in a long position, and the filter is enabled, it triggers an exit condition.
- This acts as a trend-protection exit: if the medium-term trend starts to weaken, the strategy exits even if the oscillator has not yet fully reverted.
4. **Optional risk-management layer**
- Percentage-based Stop Loss and Take Profit (SL/TP).
- Risk/Reward (R-multiple) exit based on the distance from entry to SL.
- Implemented as OCO orders that work *on top* of the logical exits.
The goal is not to create a “holy grail” system but to serve as a transparent, configurable framework for studying how these concepts behave together on different markets and timeframes.
────────────────────────
3. Components and how they work together
────────────────────────
(1) Range Oscillator (based on “Range Oscillator (Zeiierman)”)
• The script computes a weighted mean price and then measures how far price deviates from that mean.
• Deviation is normalized by an ATR-based range and expressed as an oscillator.
• When the oscillator is above the **entry threshold** (default 100), it signals a strong move away from the mean in the bullish direction.
• When it later drops below the **exit threshold** (default 30), it can trigger an exit (if enabled).
(2) Stochastic confirmation
• Classic Stochastic (%K and %D) is calculated.
• An entry requires:
- %K to be below a user-defined “Cross Level”, and
- then %K to cross above %D.
• This is a momentum confirmation: the strategy tries to enter when momentum turns up from a pullback rather than at any random point.
(3) EMA Exit Filter
• The EMA length is configurable via `emaLength` (default 70).
• The script monitors the EMA slope: it computes the relative change between the current EMA and the previous EMA.
• If the slope turns negative while the strategy holds a long position and the filter is enabled, it triggers an exit condition.
• This is meant to help protect profits or cut losses when the medium-term trend starts to roll over, even if the oscillator conditions are not (yet) signalling exit.
(4) Risk management (optional)
• Stop Loss (SL) and Take Profit (TP):
- Defined as percentages relative to average entry price.
- Both are disabled by default, but you can enable them in the Inputs.
• Risk/Reward Exit:
- Uses the distance from entry to SL to project a profit target at a configurable R-multiple.
- Also optional and disabled by default.
These exits are implemented as `strategy.exit()` OCO orders and can close trades independently of oscillator/EMA conditions if hit first.
────────────────────────
4. Entry & Exit logic (high level)
────────────────────────
A) Time filter
• You can choose a **Start Year** in the Inputs.
• Only candles between the selected start date and 31 Dec 2069 are used for backtesting (`timeCondition`).
• This prevents accidental use of tiny cherry-picked windows and makes tests more honest.
B) Entry condition (long-only)
A long entry is allowed when ALL the following are true:
1. `timeCondition` is true (inside the backtest window).
2. If `useOscEntry` is true:
- Range Oscillator value must be above `entryLevel`.
3. If `useStochEntry` is true:
- Stochastic condition (`stochCondition`) must be true:
- %K < `crossLevel`, then %K crosses above %D.
If these filters agree, the strategy calls `strategy.entry("Long", strategy.long)`.
C) Exit condition (logical exits)
A position can be closed when:
1. `timeCondition` is true AND a long position is open, AND
2. At least one of the following is true:
- If `useOscExit` is true: Oscillator is below `exitLevel`.
- If `useMagicExit` (EMA Exit Filter) is true: EMA slope is negative (`isDown = true`).
In that case, `strategy.close("Long")` is called.
D) Risk-management exits
While a position is open:
• If SL or TP is enabled:
- `strategy.exit("Long Risk", ...)` places an OCO stop/limit order based on the SL/TP percentages.
• If Risk/Reward exit is enabled:
- `strategy.exit("RR Exit", ...)` places an OCO order using a projected R-multiple (`rrMult`) of the SL distance.
These risk-based exits can trigger before the logical oscillator/EMA exits if price hits those levels.
────────────────────────
5. Recommended backtest configuration (to avoid misleading results)
────────────────────────
To align with TradingView House Rules and avoid misleading backtests:
1. **Initial capital**
- 10 000 (or any value you personally want to work with).
2. **Order size**
- Type: **Percent of equity**
- Size: **1–2%** per trade is a reasonable starting point.
- Avoid risking more than 5–10% per trade if you want results that could be sustainable in practice.
3. **Commission & slippage**
- Commission: around 0.1% if that matches your broker.
- Slippage: a few ticks (e.g. 3) to account for real fills.
4. **Timeframe & markets**
- Volatile symbols (e.g. crypto like BTCUSDT, or major indices).
- Timeframes: 1H / 4H / **1D (Daily)** are typical starting points.
- I strongly recommend trying the strategy on **different timeframes**, for example 1D, to see how the behaviour changes between intraday and higher timeframes.
5. **No “caution warning”**
- Make sure your chosen symbol + timeframe + settings do not trigger TradingView’s caution messages.
- If you see warnings (e.g. “too few trades”), adjust timeframe/symbol or the backtest period.
────────────────────────
5a. About low trade count and rare signals
────────────────────────
This strategy is intentionally designed to trade RARELY:
• It is **long-only**.
• It uses strict filters (Range Oscillator threshold + Stochastic confirmation + optional EMA Exit Filter).
• On higher timeframes (especially **1D / Daily**) this can result in a **low total number of trades**, sometimes WELL BELOW 100 trades over the whole backtest.
TradingView’s House Rules mention 100+ trades as a guideline for more robust statistics. In this specific case:
• The **low trade count is a conscious design choice**, not an attempt to cherry-pick a tiny, ultra-profitable window.
• The goal is to study a **small number of high-conviction long entries** on higher timeframes, not to generate frequent intraday signals.
• Because of the low trade count, results should NOT be interpreted as statistically strong or “proven” – they are only one sample of how this logic would have behaved on past data.
Please keep this in mind when you look at the equity curve and performance metrics. A beautiful curve with only a handful of trades is still just a small sample.
────────────────────────
6. How to use this strategy (step-by-step)
────────────────────────
1. Add the script to your chart.
2. Open the **Inputs** tab:
- Set the backtest start year.
- Decide whether to use Oscillator-based entry/exit, Stochastic confirmation, and EMA Exit Filter.
- Optionally enable SL, TP, and Risk/Reward exits.
3. Open the **Properties** tab:
- Set a realistic account size if you want.
- Set order size to a realistic % of equity (e.g. 1–2%).
- Confirm that commission and slippage are realistic for your broker.
4. Run the backtest:
- Look at Net Profit, Max Drawdown, number of trades, and equity curve.
- Remember that a low trade count means the statistics are not very strong.
5. Experiment:
- Tweak thresholds (`entryLevel`, `exitLevel`), Stochastic settings, EMA length, and risk params.
- See how the metrics and trade frequency change.
6. Forward-test:
- Before using any idea in live trading, forward-test on a demo account and observe behaviour in real time.
────────────────────────
7. Originality and usefulness (why this is more than a mashup)
────────────────────────
This script is not intended to be a random visual mashup of indicators. It is designed as a coherent, testable strategy with clear roles for each component:
• Range Oscillator:
- Handles mean vs. range-expansion states via an adaptive, ATR-normalized metric.
• Stochastic:
- Acts as a timing filter to avoid entering purely on extremes and instead waits for momentum to turn.
• EMA Exit Filter:
- Trend-slope-based safety net to exit when the medium-term direction changes against the position.
• Risk module:
- Provides practical, rule-based exits: SL, TP, and R-multiple exit, which are useful for structuring risk even if you modify the core logic.
It aims to give traders a ready-made **framework to study and modify**, not a black box or “signals” product.
────────────────────────
8. Limitations and good practices
────────────────────────
• No single strategy works on all markets or in all regimes.
• This script is long-only; it does not short the market.
• Performance can degrade when market structure changes.
• Overfitting (curve fitting) is a real risk if you endlessly tweak parameters to maximise historical profit.
Good practices:
- Test on multiple symbols and timeframes.
- Focus on stability and drawdown, not only on how high the profit line goes.
- View this as a learning tool and a basis for your own research.
────────────────────────
9. Licensing and credits
────────────────────────
• Core oscillator idea & base code:
- “Range Oscillator (Zeiierman)”
- © Zeiierman, licensed under CC BY-NC-SA 4.0.
• Strategy logic, Stochastic confirmation, EMA Exit Filter, and risk-management layer:
- Modifications by jokiniemi.
Please respect both the original license and TradingView House Rules if you fork or republish any part of this script.
────────────────────────
10. No payments / no vendor pitch
────────────────────────
• This script is completely FREE to use on TradingView.
• There is no paid subscription, no external payment link, and no private signals group attached to it.
• If you have questions, please use TradingView’s comment system or private messages instead of expecting financial advice.
Use this script as a tool to learn, experiment, and build your own understanding of markets.
────────────────────────
11. Example backtest settings used in screenshots
────────────────────────
To avoid any confusion about how the results shown in screenshots were produced, here is one concrete example configuration:
• Symbol: BTCUSDT (or similar major BTC pair)
• Timeframe: 1D (Daily)
• Backtest period: from 2018 to the most recent data
• Initial capital: 10 000
• Order size type: Percent of equity
• Order size: 2% per trade
• Commission: 0.1%
• Slippage: 3 ticks
• Risk settings: Stop Loss and Take Profit disabled by default, Risk/Reward exit disabled by default
• Filters: Range Oscillator entry/exit enabled, Stochastic confirmation enabled, EMA Exit Filter enabled
If you change any of these settings (symbol, timeframe, risk per trade, commission, slippage, filters, etc.), your results will look different. Please always adapt the configuration to your own risk tolerance, market, and trading style.

MTF EMA Trading SystemHere's a comprehensive description and usage guide for publishing your MTF EMA Trading System indicator on TradingView:
MTF EMA Trading System - Pro Edition
📊 Indicator Overview
The MTF EMA Trading System is an advanced multi-timeframe exponential moving average indicator designed for traders seeking high-probability setups with multiple confirmations. Unlike simple EMA crossover systems, this indicator combines trend alignment, momentum, volume analysis, and previous day confluence to generate reliable long and short signals with optimal risk-reward ratios.
✨ Key Features
1. Multi-Timeframe EMA Analysis
Configure 5 independent EMAs (default: 9, 21, 50, 100, 200)
Each EMA can pull data from ANY timeframe (5m, 15m, 1H, 4H, 1D, etc.)
Color-coded lines with customizable widths
End-of-line labels showing EMA period and timeframe (e.g., "EMA200 ")
Perfect for analyzing higher timeframe trends on lower timeframe charts
2. Advanced Signal Generation (Beyond Simple Crosses)
The system requires MULTIPLE confirmations before generating a signal:
LONG Signals Require:
✅ Price action trigger (EMA cross, bounce from key EMA, or pullback setup)
✅ Bullish EMA alignment (EMAs in proper ascending order)
✅ Volume spike confirmation (configurable threshold)
✅ RSI momentum confirmation (bullish but not overbought)
✅ Sufficient EMA separation (avoids choppy/whipsaw conditions)
✅ Price above previous day's low (confluence with support)
SHORT Signals Require:
✅ Price action trigger (EMA cross, rejection from key EMA, or pullback setup)
✅ Bearish EMA alignment (EMAs in proper descending order)
✅ Volume spike confirmation
✅ RSI momentum confirmation (bearish but not oversold)
✅ Sufficient EMA separation
✅ Price below previous day's high (confluence with resistance)
3. Real-Time Dashboard
Displays critical market conditions at a glance:
Overall trend direction (Bullish/Bearish/Neutral)
Price position relative to all EMAs
Volume status (spike or normal)
RSI momentum reading
EMA confluence strength
EMA separation quality
Current ATR value
Previous day high/low levels
Current signal status (LONG/SHORT/WAIT)
Risk-reward ratio
4. Clean Visual Design
Large, clear trade signal markers (green triangles for LONG, red triangles for SHORT)
No chart clutter - only essential information displayed
Customizable signal sizes
Professional color-coded dashboard
5. Built-In Risk Management
ATR-based calculations for stop loss placement
1:2 risk-reward ratio by default
All levels displayed in dashboard for easy reference
🎯 How to Use This Indicator
Step 1: Initial Setup
Add the indicator to your TradingView chart
Configure your preferred timeframes for each EMA:
EMA 9: Leave blank (uses chart timeframe) - Fast reaction to price
EMA 21: Leave blank or set to 15m - Key pivot level
EMA 50: Set to 1H - Intermediate trend
EMA 100: Set to 4H - Major trend filter
EMA 200: Set to 1D - Overall market bias
Adjust signal settings based on your trading style:
Conservative: Keep all confirmations enabled
Aggressive: Disable volume or momentum requirements
Scalping: Reduce min EMA separation to 0.2-0.3%
Step 2: Reading the Dashboard
Before taking any trade, check the dashboard:
Trend: Only take LONG signals in bullish trends, SHORT signals in bearish trends
Position: Confirm price is on the correct side of EMAs
Volume: Green spike = strong confirmation
RSI: Avoid extremes (>70 or <30)
Confluence: "Strong" = high probability setup
Separation: "Good" = trending market, avoid "Low" separation
Step 3: Trade Entry
For LONG Trades:
Wait for green triangle to appear below price
Verify dashboard shows:
Bullish or Neutral trend
Volume spike (preferred)
RSI between 50-70
Good separation
Enter at market or on next bar
Set stop loss at: Entry - (ATR × 2)
Set target at: Entry + (ATR × 4)
For SHORT Trades:
Wait for red triangle to appear above price
Verify dashboard shows:
Bearish or Neutral trend
Volume spike (preferred)
RSI between 30-50
Good separation
Enter at market or on next bar
Set stop loss at: Entry + (ATR × 2)
Set target at: Entry - (ATR × 4)
Step 4: Trade Management
Use the ATR values from dashboard for position sizing
Trail stops using the fastest EMA (EMA 9) as price moves in your favor
Exit partial position at 1:1 risk-reward, let remainder run to target
Exit immediately if dashboard trend changes against your position
💡 Best Practices
Timeframe Recommendations:
Scalping: 1m-5m chart with 5m, 15m, 1H, 4H, 1D EMAs
Day Trading: 5m-15m chart with 15m, 1H, 4H, 1D EMAs
Swing Trading: 1H-4H chart with 4H, 1D, 1W EMAs
Position Trading: 1D chart with 1D, 1W, 1M EMAs
Market Conditions:
Best in: Trending markets with clear direction
Avoid: Tight consolidation, low volume periods, major news events
Filter trades: Only take signals aligned with higher timeframe trend
Risk Management:
Never risk more than 1-2% per trade
Use ATR from dashboard to calculate position size
Respect the stop loss levels
Don't force trades when dashboard shows weak conditions
⚙️ Customization Options
EMA Settings (for each of 5 EMAs):
Length (period)
Timeframe (multi-timeframe capability)
Color
Line width
Show/hide toggle
Signal Settings:
Volume confirmation (on/off)
Volume spike threshold (1.0-3.0x)
Momentum confirmation (on/off)
RSI overbought/oversold levels
Minimum EMA separation percentage
ATR period and stop multiplier
Display Settings:
Show/hide EMA labels
Show/hide trade signals
Signal marker size (tiny/small/normal/large)
Show/hide dashboard
🔔 Alert Setup
The indicator includes 4 alert conditions:
LONG Signal - Fires when all long confirmations are met
SHORT Signal - Fires when all short confirmations are met
Bullish Setup - Early warning when trend aligns bullish with volume
Bearish Setup - Early warning when trend aligns bearish with volume
To set up alerts:
Right-click on chart → Add Alert
Select "MTF EMA Trading System"
Choose your desired alert condition
Configure notification method (popup, email, SMS, webhook)
📈 Performance Tips
Increase Win Rate:
Only trade in direction of higher timeframe trend
Wait for volume spike confirmation
Avoid trades during first 30 minutes and last 15 minutes of session
Skip trades when separation is "Low"
Reduce False Signals:
Increase minimum EMA separation to 0.7-1.0%
Enable all confirmation requirements
Only trade when confluence shows "Strong"
Combine with support/resistance levels
Optimize for Your Market:
Stocks: Use 9, 21, 50, 100, 200 EMAs
Forex: Consider 8, 13, 21, 55, 89 EMAs (Fibonacci)
Crypto: May need wider ATR multiplier (2.5-3.0x) for volatility
⚠️ Important Notes
This indicator is designed to reduce false signals by requiring multiple confirmations
No indicator is 100% accurate - always use proper risk management
Backtesting recommended before live trading
Market conditions change - adjust settings as needed
Works best in liquid markets with clear price action
🎓 Conclusion
The MTF EMA Trading System transforms simple moving average analysis into a sophisticated, multi-confirmation trading strategy. By combining trend alignment, momentum, volume, and confluence, it helps traders identify high-probability setups while filtering out noise and false signals. The clean interface and comprehensive dashboard make it suitable for both beginners and experienced traders across all markets and timeframes.

Clock&Flow – Market Pulse IndicatorClock&Flow – Market Pulse Indicator
1) General Purpose
The Market Pulse Indicator is designed to visualize the strength and direction of market flow in a clear, intuitive way.
Unlike common volume or momentum indicators, it blends three essential dimensions — price velocity, normalized volume, and volatility (ATR) — to highlight when market pressure is truly meaningful.
It helps identify genuine liquidity inflows/outflows, potential exhaustion zones, and moments of compression or expansion within the price structure.
2) Data Sources
All data is directly taken from the current chart’s feed on TradingView:
Price (close): to measure relative price change.
Volume: to detect the intensity of market participation (normalized to average).
ATR (Average True Range): to evaluate volatility relative to price levels.
No external data or off-platform sources are used.
3) Logic and Calculation Steps
Price Velocity: calculates the percentage change between the current close and the close N bars ago.
priceChange = (close - close ) / close
Normalized Volume: compares current volume to its moving average over the same period.
volNorm = volume / sma(volume, length)
Normalized Volatility: ATR divided by price to adjust for instrument scale.
atrNorm = atr(length) / close
Combination : multiplies the three components into one raw value that represents market pulse intensity.
rawPulse = priceChange * volNorm * (1 + atrNorm)
Smoothing: a moving average (smoothLen) is applied to create a cleaner and more readable oscillator line.
flowPulse = sma(rawPulse * multiplier, smoothLen)
4) Parameters (Default Settings)
length (20): analysis period for price change, volume, and ATR.
smoothLen (5): smoothing factor; higher values reduce noise.
multiplier (100): scales the output for readability; adjust to fit chart scale.
5) How to Read the Indicator
Market Pulse > 0 (green): net inflow of liquidity; buying pressure dominates.
Market Pulse < 0 (red): net outflow of liquidity; selling pressure dominates.
Near 0: neutral phase; market balance or consolidation.
Sudden peaks: strong bursts of flow — often coincide with news releases or session overlaps.
Confirmations: use as a second-level filter before entering trades or to confirm momentum behind a breakout.
6) Divergences
Divergences between price and Market Pulse are key signals of weakening flow strength:
Bullish divergence: price forms lower lows while Market Pulse forms higher lows → selling pressure is fading; potential reversal or bounce.
Bearish divergence: price forms higher highs while Market Pulse fails to confirm → buying momentum is losing strength; potential correction ahead.
For reliability, look for divergences on higher timeframes (H4, Daily).
On lower timeframes, treat them as early warnings.
7) Typical Use Cases
Breakout confirmation: price breaks resistance with a rising Market Pulse → confirms genuine participation.
False signal filter: price breaks a level but Market Pulse remains flat/negative → likely fake breakout.
Pullback entry: after a breakout, wait for a short retracement and a new positive pulse → safer entry point.
Exit signal: if you’re long and Market Pulse suddenly turns negative with strong volume → consider partial exit or tighter stops.
8) Recommended Timeframes
Intraday / Scalping: 5–30 min charts with length 10–14, smoothLen 3–5.
Swing trading: 1h–4h charts with length 20–50.
Position trading: Daily charts with larger length (50–100) for smoother data.
Always optimize parameters to the specific asset — there are no universal settings.
9) Limitations
This indicator is not a trading system — it’s a decision-support tool.
Results depend on the quality of the volume data available for the symbol.
Performance and sensitivity are influenced by length, smoothing, and multiplier values — always test before live trading.
Use alongside sound risk and money management.
10) Disclaimer
This script is provided for educational purposes only and does not constitute financial advice.
Trading and investing involve significant risk, including the potential loss of capital.
Always test indicators in simulation environments and make independent decisions based on your own analysis and risk tolerance.
Italiano
1) Scopo generale
Flow Pulse è un oscillatore pensato per visualizzare la forza e la direzione del flusso di mercato in modo immediato. Non è un semplice indicatore di volume né una copia di RSI/MACD: combina tre dimensioni fondamentali — variazione di prezzo, volume normalizzato e volatilità — per mettere in evidenza i momenti in cui la pressione dei partecipanti è realmente significativa.
È ideale per identificare: entrate guidate da flussi reali, potenziali esaurimenti, momenti di compressione/espansione del movimento e segnali di conferma per breakout o rimbalzi.
2) Dati utilizzati
L’indicatore usa esclusivamente dati disponibili sulla piattaforma TradingView del grafico corrente:
price (close) — per calcolare la variazione percentuale del prezzo;
volume per misurare l’intensità degli scambi (normalizzato su media);
ATR (Average True Range) — per normalizzare la volatilità rispetto al prezzo;
Tutti i feed (prezzo e volume) sono quelli forniti dall’exchange/fornitore dati collegato al simbolo sul grafico.
3) Logica e passaggi di calcolo
Velocità del prezzo: calcolo della variazione percentuale tra la chiusura corrente e la chiusura N barre fa:
priceChange = (close - close ) / close
— misura la direzione e magnitudine del movimento in termine relativo.
Volume normalizzato: rapporto tra il volume corrente e la media mobile semplice del volume su length barre:
volNorm = volume / sma(volume, length)
— evidenzia volumi anomali rispetto alla media.
Volatilità normalizzata (ATR): rapporto ATR/close per rendere la volatilità comparabile across price levels:
atrNorm = atr(length) / close
Combinazione: il prodotto di questi fattori (con un piccolo offset su ATR) genera un valore grezzo:
rawPulse = priceChange * volNorm * (1 + atrNorm)
— se priceChange e volNorm sono positivi e l’ATR è presente, il rawPulse sarà significativamente positivo.
Smoothing: media mobile semplice (SMA) applicata al rawPulse e moltiplicazione per un fattore scalare (multiplier) per portare il range su livelli leggibili:
flowPulse = sma(rawPulse * multiplier, smoothLen)
4) Parametri esposti (default consigliati)
length (periodo analisi) — default 20: influenza calcolo Δ% e media volumi; allunga la finestra storica.
smoothLen (smussamento) — default 5: smoothing del segnale per ridurre rumore.
multiplier — default 100: fattore di scala per rendere l’oscillatore più leggibile.
5) Interpretazione pratica dei valori
FlowPulse > 0 (verde): predominanza di flusso d’ingresso — pressione d’acquisto. Maggiore il valore, più forte la convinzione (volume + movimento + volatilità).
FlowPulse < 0 (rosso): predominanza di flusso in uscita — pressione di vendita.
Vicino a 0: assenza di flussi netti chiari; mercato piatto o bilanciato.
Picchi repentini: indicano accelerate di flusso — spesso coincidono con rotture, open/close session, news.
Sostegno al trade: usa FlowPulse come conferma prima di entrare su breakout o come avviso di attenzione su esaurimenti.
6) Divergenze (come leggerle)
Le divergenze tra prezzo e FlowPulse sono segnali importanti:
Divergenza rialzista (bullish divergence): prezzo fa nuovi minimi mentre FlowPulse non fa nuovi minimi (o forma minimo relativo più alto) → indica che la spinta di vendita non è supportata da volume/volatilità, possibile inversione/rimbalzo.
Divergenza ribassista (bearish divergence): prezzo fa nuovi massimi mentre FlowPulse non li conferma (o forma massimo relativo più basso) → la spinta d’acquisto è “debole”, possibile esaurimento e inversione.
Note pratiche: cercare divergenze su timeframe maggiori (H4, D) per maggiore attendibilità; sui timeframe minori prendere solo come early warning.
7) Esempi d’uso operativo
Conferma breakout: prezzo rompe resistenza + FlowPulse positivo e crescente → breakout più probabile e con volumi reali.
Filtro per falsi segnali: prezzo rompe ma FlowPulse è piatto/negativo → alto rischio di false breakout.
Entrata per pullback: dopo breakout, attendere un pullback con FlowPulse che torna positivo → ingresso più prudente.
Gestione delle uscite: se sei long e FlowPulse improvvisamente si inverte in negativo su volumi elevati → considerare riduzione posizione o stop.
8) Timeframe consigliati
Intraday / Scalping: M5–M30 con length ridotto (es. 10–14) e smoothLen piccolo.
Swing trading: H1–H4 con length 20–50.
Position trading: D1 con length maggiore per filtrare rumore.
Testa i parametri sul tuo asset e timeframe; nessun parametro è universale.
9) Limitazioni e avvertenze
L’indicatore non è un sistema di trading completo: è un tool di informazione e timing.
Dipende dalla qualità dei dati di volume del simbolo: su alcuni titoli/mercati (es. alcuni ETF, Forex su certi broker) il volume può essere parziale o non rappresentativo.
I valori di margine/multiplier e smoothing influenzano sensibilmente sensibilità e falsi segnali: backtest e ottimizzazione sono raccomandati.
Non usare il solo FlowPulse per entrare su leva elevata senza gestione del rischio12) Disclaimer da inserire
Disclaimer: Questo indicatore è fornito solo a scopo didattico e non costituisce consulenza finanziaria. L’uso comporta rischi: valuta sempre la gestione del rischio e testa su conto demo prima dell’applicazione in reale.

Close-Only Market StructureDYOR NFA
Function of the Close-Only Market Structure Script
The script is a custom indicator designed to display the market's structural trend based only on closing prices, ignoring price wicks (highs and lows) to focus on conviction.
pivotLengthInt Input: This user setting controls the sensitivity of the structure detection. It determines how many bars to look left and right to define a swing point (e.g., a setting of 5 means a bar's close must be the highest/lowest of the 5 preceding and 5 succeeding bars).
Swing Point Identification (SH/SL): It uses the ta.pivothigh() and ta.pivotlow() functions on the close price series to define Swing Highs (SH) and Swing Lows (SL).
Structure Tracking (structureType): It compares the most recent confirmed SH and SL against the immediately preceding ones (prevSH and prevSL) to classify the trend as one of the following four states:
HH (Higher High, Higher Low): Strong Uptrend
LL (Lower High, Lower Low): Strong Downtrend
HL/LH: Complex structure, consolidation, or reversal zones.
Structure Lines: It plots two continuous stepped lines (lastSH and lastSL) that hold the price of the most recent confirmed swing points, visually defining the current structure boundaries.
BOS Detection (Break of Structure): It identifies and plots a marker (BOS) when the current bar's close definitively breaks (closes above) the lastSH or closes below the lastSL, signaling a continuation of the trend or a major structural change.
Visual Confirmation:
Plots small SH/SL labels at the confirmed swing points.
Plots small HH/HL/LH/LL labels at the swing points to show the confirmed structural state.
Applies a light background color (green for bullish/ranging-up, red for bearish/ranging-down) for an at-a-glance view of the bias.
Alerts: It provides conditions for setting up notifications when a Bullish BOS or Bearish BOS occurs.
🚀 How to Use the Script
Open TradingView: Go to the chart where you want to apply the indicator.
Open Pine Editor: Click the Pine Editor tab at the bottom of the screen.
Paste and Save:
Copy the final, corrected Pine Script code.
Delete any existing code in the editor and paste the new code.
Click the Save button (or name the script) and then click Add to Chart.
Adjust Settings:
On the chart, hover over the indicator name ("Close-MS v6") and click the Gear Icon (Settings).
Pivot Lookback (L&R): Change this value to adjust sensitivity:
Smaller number (e.g., 3): More swings detected, structure changes faster, more noise.
Larger number (e.g., 10): Fewer swings detected, structure is more significant, less noise (recommended for higher timeframes).
Interpret the Chart:
The Red Stepped Line shows your current resistance (SH).
The Green Stepped Line shows your current support (SL).
Green Background: General bullish bias (making Higher Highs/Lows).
Red Background: General bearish bias (making Lower Highs/Lows).
BOS Triangle: Signals that the price has closed and validated a break of the previous structural high or low.
Set Alerts (Optional):
Click the Alert button (bell icon) on the TradingView toolbar.
Set the Condition to the indicator ("Close-MS v6").
Select the specific Alert Condition you want to monitor (e.g., "Bullish BOS" or "Bearish BOS").

4-Hour Range Scalping [v6.3]User Guide: 4-Hour Range Scalping Strategy
Hello! Here is the guide for the Pine Script strategy. Please read it carefully to get the best results.
📈 This script automates the "4-Hour Range Scalping Strategy" from the video.
The main idea is that the first four hours of a major trading day (like New York) set up a "trap zone." The strategy waits for the price to break out of this zone and then fail, giving us a signal that the breakout was false and the price is likely to reverse.
Here’s the simple logic:
Define the Range: It precisely calculates the highest high and lowest low during the first four hours of the selected trading session (e.g., 00:00 to 04:00 New York Time).
Wait for a Breakout: It then monitors the 5-minute chart for a price breakout where a candle fully closes outside of this established range.
Identify the Reversal: The trade trigger occurs when the price fails to continue its breakout and a subsequent 5-minute candle closes back inside the range. This signals a potential reversal or "failed breakout."
Execute the Trade:
]A Short (Sell) trade is triggered after a failed breakout above the range high.
A Long (Buy) trade is triggered after a failed breakout below the range low.
Manage the Risk: The Stop Loss is automatically placed at the peak (for shorts) or trough (for longs) of the breakout move, and the Take Profit is set to a default 2:1 Risk/Reward Ratio.
How to Use the Script (Step-by-Step) ⚙️
Follow these instructions to get it running perfectly.
1. Set Your Chart Timeframe This is the most important step. The strategy is designed to run on a 5-minute (5m) chart. Open your TradingView chart and make sure the timeframe is set to "5m".
2. Add the Script to Your Chart Open the Pine Editor tab at the bottom of TradingView, paste the entire script, and click the "Add to chart" button.
3. Configure the Settings On your chart, find the strategy's name (e.g., "4-Hour Range Scalping ") and click the gear icon ⚙️ to open its settings.
Trading Session: Choose the session for the range. New York is the default and the one from the video.
Risk/Reward Ratio: The default is 2.0, meaning your potential profit is twice your potential loss. You can adjust this to test other targets.
Backtesting Period: To see how the strategy performed on all historical data, go to the "Strategy Tester" panel, click its own gear icon ⚙️, and uncheck the boxes for "Start Date" and "End Date."
4. Understand the Visuals on Your Chart
Blue Background Area: This is the 4-hour calculation window. The script is identifying the day's high and low during this time. No trades will ever happen here.
Red Line (Range High): The highest price of the 4-hour window. This is the upper boundary of the "trap zone."
Green Line (Range Low): The lowest price of the 4-hour window. This is the lower boundary.
Green Triangle (▲): Shows where a Long (Buy) trade was entered.
Red Triangle (▼): Shows where a Short (Sell) trade was entered.
A Very Important Note on Timezones 🕒
This is critical for you in the Philippines (PHT).
The script is based on the New York session, which is 12 hours behind you. Your TradingView chart will still show your local time, but the script works on NY time in the background.
The New York "day" begins at 12:00 PM (Noon) your time.
The script's blue calculation window will be from 12:00 PM to 4:00 PM your local time.
The red and green range lines will appear on your chart only after 4:00 PM your time.
So, if you look at your chart in the morning or early afternoon, you will not see today's range yet. This is normal! The script is just waiting for the New York session to start.
How to Set Up Trade Alerts 🔔
You can have TradingView send you a notification whenever the script enters a trade.
Click the "Alert" button (looks like a clock) in the right-hand toolbar of TradingView.
In the "Condition" dropdown, select the name of the script (e.g., "4-Hour Range Scalping...").
You will then see two options: "Long Signal" and "Short Signal".
Select one (e.g., "Long Signal") and configure how you want to be notified (e.g., "Notify on app").
Click "Create". Repeat the process to create an alert for the other signal.
⚠️ Important Disclosure
For Educational and Research Purposes Only.
This script and all accompanying information are provided for educational and research purposes only. The strategy demonstrated is a technical concept and should not be misconstrued as financial, investment, legal, or tax advice.
Trading financial markets involves substantial risk and is not suitable for every investor. There is a possibility that you could sustain a loss of some or all of your initial investment. Therefore, you should not invest money that you cannot afford to lose.
Past performance is not indicative of future results. The backtesting results shown by this script are historical and do not guarantee future performance. Market conditions are constantly changing.
By using this script, you acknowledge that you are solely responsible for any and all trading decisions you make. You should conduct your own thorough research and, if necessary, seek advice from an independent financial advisor before making any investment decisions. The creators of this script assume no liability for any of your trading results.

Bollinger Band Screener [Pineify]Multi-Symbol Bollinger Band Screener Pineify – Advanced Multi-Timeframe Market Analysis
Unlock the power of rapid, multi-asset scanning with this original TradingView Pine Script. Expose trends, volatility, and reversals across your favorite tickers—all in a single, customizable dashboard.
Key Features
Screens up to 8 symbols simultaneously with individual controls.
Covers 4 distinct timeframes per symbol for robust, multi-timeframe analysis.
Integrates advanced Bollinger Band logic, adaptable with 11+ moving average types (SMA, EMA, RMA, HMA, WMA, VWMA, TMA, VAR, WWMA, ZLEMA, and TSF).
Visualizes precise state changes: Open/Parallel Uptrends & Downtrends, Consolidation, Breakouts, and more.
Highly interactive table view for instant signal interpretation and actionable alerts.
Flexible to any market: crypto, stocks, forex, indices, and commodities.
How It Works
For each chosen symbol and timeframe, the script calculates Bollinger Bands using your specified source, length, standard deviation, and moving average method.
Real-time state recognition assigns one of several states (Open Rising, Open Falling, Parallel Rising, Parallel Falling), painting the table with unique color codes.
State detection is rigorously defined: e.g., “Open Rising” is set when both bands and the basis rise, indicating strong up momentum.
All bands, signals, and strategies dynamically update as new bars print or user inputs change.
Trading Ideas and Insights
Identify volatility expansions and compressions instantly, spotting breakouts and breakdowns before they play out.
Spot multi-timeframe confluences—when trends align across several TFs, conviction increases for potential trades.
Trade reversals or continuations based on unique Bollinger Band patterns, such as squeeze-break or persistent parallel moves.
Harness this tool for scalping, swing trading, or systematic portfolio screens—your logic, your edge!
How Multiple Indicators Work Together
This screener’s core strength is its integration of multiple moving average types into Bollinger Band construction, not just standard SMA. Each average adapts the bands’ responsiveness to trend and noise, so traders can select the underlying logic that matches their market environment (e.g., HMA for fast moves or ZLEMA for smoothed lag). Overlaying 4 timeframes per symbol ensures trends, reversals, and volatility shifts never slip past your radar. When all MAs and bands synchronize across symbols and TFs, it becomes easy to separate real opportunity from market noise.
Unique Aspects
Perhaps the most flexible Bollinger Band screener for TradingView—choose from over 10 moving average methods.
Powerful multi-timeframe and multi-asset design, rare among Pine scripts.
Immediate visual clarity with color-coded table cells indicating band state—no need for guesswork or chart clutter.
Custom configuration for each asset and time slice to suit any trading style.
How to Use
Add the script to your TradingView chart.
Use the user-friendly input settings to specify up to 8 symbols and 4 timeframes each.
Customize the Bollinger Band parameters: source (price type), band length, standard deviation, and type of moving average.
Interpret the dashboard: Color codes and “state” abbreviations show you instantly which symbols and timeframes are trending, consolidating, or breaking out.
Take trades according to your strategy, using the screener as a confirmation or primary scan tool.
Customization
Fully customize: symbols, timeframes, source, band length, standard deviation multiplier, and moving average type.
Supports intricate watchlists—anything TradingView allows, this script tracks.
Adapt for cryptos, equities, forex, or derivatives by changing symbol inputs.
Conclusion
The Multi-Symbol Bollinger Band Screener “Pineify” is a comprehensive, SEO-optimized Pine Script tool to supercharge your market scanning, trend spotting, and decision-making on TradingView. Whether you trade crypto, stocks, or forex—its fast, intuitive, multi-timeframe dashboard gives you the informational edge to stay ahead of the market.
Try it now to streamline your trading workflow and see all the bands, all the trends, all the time!

Tunç ŞatıroğluTunç Şatıroğlu's Technical Analysis Suite
Description:
This comprehensive Pine Script indicator, inspired by the technical analysis teachings of Tunç Şatıroğlu, integrates six powerful TradingView indicators into a single, user-friendly suite for robust trend, momentum, and divergence analysis. Each component has been carefully selected and enhanced by beytun to improve functionality, performance, and visual clarity, aligning with Şatıroğlu's approach to technical analysis. The default configuration is meticulously set to match the exact settings of the individual indicators as used by Tunç Şatıroğlu in his training, ensuring authenticity and ease of use for followers of his methodology. Whether you're a beginner or an experienced trader, this suite provides a versatile toolkit for analyzing markets across multiple timeframes.
Included Indicators:
1. WaveTrend with Crosses (by LazyBear, modified): A momentum oscillator that identifies overbought/oversold conditions and trend reversals with clear buy/sell signals via crosses and bar color highlights.
2. Kaufman Adaptive Moving Average (KAMA) (by HPotter, modified): A dynamic moving average that adapts to market volatility, offering a smoother trend-following signal.
3. SuperTrend (by Alex Orekhov, modified): A trend-following indicator that plots dynamic support/resistance levels with buy/sell signals and optional wicks for enhanced accuracy.
4. Nadaraya-Watson Envelope (by LuxAlgo, modified): A non-linear envelope that highlights potential reversals with customizable repainting options for smoother outputs.
5. Divergence for Many Indicators v4 (by LonesomeTheBlue, modified): Detects regular and hidden divergences across multiple indicators (MACD, RSI, Stochastic, CCI, Momentum, OBV, VWMA, CMF, MFI, and more) for early reversal signals.
6. Ichimoku Cloud (TradingView built-in, modified): A multi-faceted indicator for trend direction, support/resistance, and momentum, with enhanced visuals for the Kumo Cloud.
Key Features:
- Authentic Default Settings : Pre-configured to mirror the exact parameters used by Tunç Şatıroğlu for each indicator, ensuring alignment with his proven technical analysis approach.
- Customizable Settings : Enable/disable individual indicators and fine-tune parameters to suit your trading style while retaining the option to revert to Şatıroğlu’s defaults.
- Enhanced User Experience : Modifications improve visual clarity, performance, and usability, with options like repainting smoothing for Nadaraya-Watson and adjustable Ichimoku projection periods.
- Multi-Timeframe Analysis : Combines trend-following, momentum, and divergence tools for a holistic view of market dynamics.
- Alert Conditions : Built-in alerts for SuperTrend direction changes, buy/sell signals, and divergence detections to keep you informed.
- Visual Clarity : Overlays (KAMA, SuperTrend, Nadaraya-Watson, Ichimoku) and pane-based indicators (WaveTrend, Divergences) are clearly distinguished, with customizable colors and styles.
Notes:
- The Nadaraya-Watson Envelope and Ichimoku Cloud may repaint in their default modes. Use the "Repainting Smoothing" option for Nadaraya-Watson or adjust Ichimoku settings to mitigate repainting if preferred.
- Published under the MIT License, with components licensed under GPL-3.0 (SuperTrend), CC BY-NC-SA 4.0 (Nadaraya-Watson), MPL 2.0 (Divergence), and TradingView's terms (Ichimoku Cloud).
Usage:
Add this indicator to your TradingView chart to leverage Tunç Şatıroğlu’s exact indicator configurations out of the box. Customize settings as needed to align with your strategy, and use the combined signals to identify trends, reversals, and divergences. Ideal for traders following Şatıroğlu’s methodologies or anyone seeking a powerful, all-in-one technical analysis tool.
Credits:
Original authors: LazyBear, HPotter, Alex Orekhov, LuxAlgo, LonesomeTheBlue, and TradingView.
Modifications and integration by beytun .
License:
Published under the MIT License, incorporating code under GPL-3.0, CC BY-NC-SA 4.0, MPL 2.0, and TradingView’s terms where applicable.

Multiplied and Divided Moving Average ### Multiplied and Divided Moving Average Indicator
**Description**:
The "Multiplied and Divided Moving Average" indicator is a customizable tool for TradingView users, designed to create dynamic bands around a user-selected moving average (MA). It calculates a moving average (SMA, EMA, WMA, VWMA, or RMA) and generates a user-defined number of lines above and below it by multiplying and dividing the MA by linearly spaced factors. These bands serve as potential support and resistance levels, aiding in trend identification, mean reversion strategies, or breakout detection. Optional Buy/Sell labels appear when the price crosses below the divided MAs (Buy) or above the multiplied MAs (Sell), providing clear visual cues for trading opportunities.
**Key Features**:
- **Flexible MA Types**: Choose from Simple (SMA), Exponential (EMA), Weighted (WMA), Volume-Weighted (VWMA), or Running (RMA) moving averages.
- **Customizable Bands**: Set the number of lines (0–10) above and below the MA, allowing tailored analysis for any market or timeframe.
- **Dynamic Factors**: Bands are created using factors that scale linearly from 1 to a user-defined maximum (default: 5.0), creating intuitive overbought/oversold zones.
- **Buy/Sell Signals**: Optional labels highlight potential entry (Buy) and exit (Sell) points when the price crosses the bands.
- **Clear Visuals**: The main MA is plotted in blue, with green (multiplied) and red (divided) lines using graduated transparency for easy differentiation.
**Inputs**:
- **MA Type**: Select the moving average type (default: SMA).
- **MA Length**: Set the MA period (default: 14).
- **Number of Lines Above/Below**: Choose how many bands to plot above and below the MA (default: 4, range: 0–10).
- **Max Factor**: Define the largest multiplier/divisor for the outermost bands (default: 5.0).
- **Source**: Select the price data for the MA (default: close).
- **Show Buy/Sell Labels**: Enable or disable Buy/Sell labels (default: true).
**How It Works**:
1. Calculates the chosen moving average based on user inputs.
2. Creates up to 10 lines above the MA (e.g., MA × 2, ×3, ×4, ×5 for `numLines=4`, `maxFactor=5`) and 10 below (e.g., MA ÷ 2, ÷3, ÷4, ÷5).
3. Plots the main MA in blue, multiplied lines in green, and divided lines in red, with transparency increasing for outer bands.
4. If enabled, displays "Buy" labels when the price crosses below any divided MA and "Sell" labels when it crosses above any multiplied MA, positioned at the outermost band.
**Use Cases**:
- **Trend Analysis**: Use the bands as dynamic support/resistance to confirm trend direction or reversals.
- **Mean Reversion**: Identify overbought (near multiplied MAs) or oversold (near divided MAs) conditions.
- **Breakout Trading**: Monitor price crossovers of the outermost bands for potential breakout signals.
- **Signal Confirmation**: Use Buy/Sell labels for swing trading or to complement other indicators.
**How to Use**:
1. Copy the script into TradingView’s Pine Editor.
2. Compile and apply it to your chart (e.g., stocks, forex, crypto).
3. Adjust inputs like `numLines`, `maxFactor`, or `maType` to fit your strategy.
4. Enable `Show Buy/Sell Labels` to visualize trading signals.
5. Test on various timeframes (e.g., 1H, 4H, 1D) and assets to optimize settings.
**Example Settings**:
- **Swing Trading**: Use `numLines=3`, `maxFactor=4`, `maType=EMA`, `maLength=20` on a 4-hour chart.
- **Intraday**: Try `numLines=2`, `maxFactor=3`, `maType=SMA`, `maLength=10` on a 15-minute chart.
**Notes**:
- **Performance**: Supports up to 20 bands (10 above, 10 below), staying within TradingView’s 64-plot limit.
- **False Signals**: In choppy markets, frequent crossovers may occur. Combine with trend filters (e.g., ADX, higher-timeframe MA) to reduce noise.
- **Enhancements**: Add alerts via TradingView’s alert system for Buy/Sell signals, or experiment with different `maxFactor` values for volatility.
**Limitations**:
- Bands are reactive, as they’re based on a moving average, so confirm signals with other indicators.
- High `numLines` values may clutter the chart; use 2–4 for clarity.
- Signals may lag in fast-moving markets due to the MA’s smoothing effect.
This indicator is perfect for traders seeking a customizable, visually clear tool to enhance technical analysis on TradingView. For support, feature requests (e.g., alerts, custom colors), or community discussion, visit TradingView’s forums or contact the script author.

Contract Interest Turnover T3 [T69]Overview
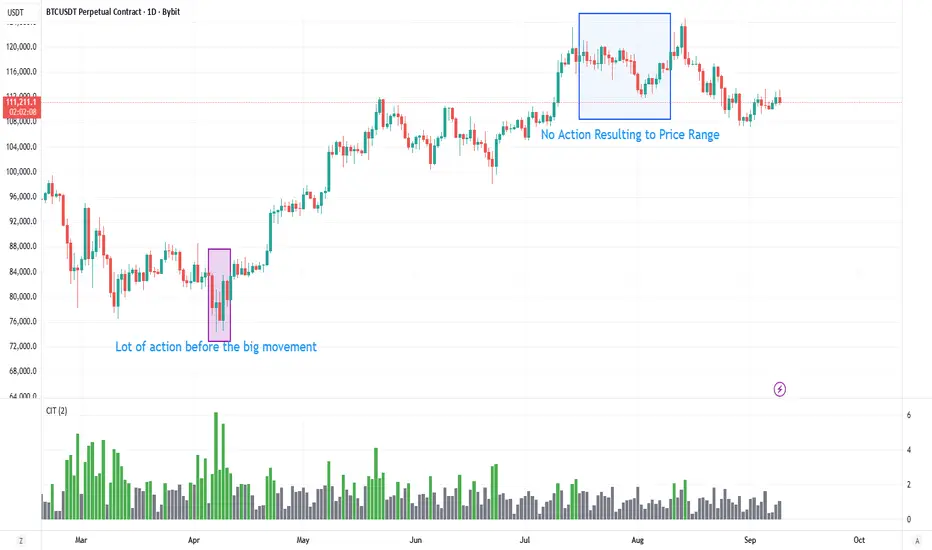
--------
Contract Interest Turnover (CIT) estimates how “churny” a crypto derivatives market is by comparing the amount traded in a bar to the base stock of outstanding contracts (open interest). It normalizes both Volume and Open Interest (OI) by Price (Close), then plots a Turnover Rate = (Volume/Close) ÷ (OI/Close) as colored columns. Higher values = faster contract recycling (strong momentum / hype potential).
Features
--------
- Auto-fetch OI: Pulls OI via request.security(_OI, …) when the exchange/symbol exposes an OI stream on TradingView.
- Price-normalized comparison: Converts both Volume and OI into comparable notional terms by dividing each by Close.
- Turnover columns with threshold: Color the columns green once Turnover ≥ your set threshold; gray otherwise.
- Status-line readouts: Displays normalized Volume and OI values for quick sanity checks.
- Crypto-aware timeframe: Uses chart TF for crypto; forces daily OI when not crypto to avoid noisy intraday pulls.
How to Use
----------
1. Add the script on a perpetual/futures symbol that has OI on TradingView (e.g., BTC perps where an _OI feed exists).
2. Watch the Turnover Rate bars: spikes above your threshold flag sessions where contracts are actively flipping.
3. Interpret spikes as a signal of movement or activity — it does not specify price direction, only that the market is engaged and contracts are being traded more intensely than usual.
Configuration
-------------
- Interest Turnover Threshold (default 1.0): colors columns green when Turnover ≥ threshold. Tune per market’s typical churn profile.
Under the Hood (Formulas & Logic)
---------------------------------
- Fetch OI
oiClose ← request.security(ticker.standard(syminfo.tickerid) + "_OI", timeframe, close) with ignore_invalid_symbol = true.
If none is found, the script throws a clear runtime error.
- Normalize to price
vol_norm = volume / close
oi_norm = oiClose / close
This converts both to a common notional basis so their ratio is meaningful even as price changes.
- Turnover Rate
turnover = vol_norm / oi_norm
Interpretation: fraction/multiples of the outstanding contract base traded in the bar. Color = green if turnover ≥ threshold.
Why Open Interest ≈ “Float” Proxy
---------------------------------
In stocks, float ≈ shares the public can trade. In derivatives, there are no “shares,” so Open Interest acts as the live stock of active contracts. It’s the best proxy for “what’s available in play” because it counts open positions that persist across bars. Using Volume ÷ OI mirrors stock float-turnover logic: how fast the tradable base is being recycled each period.
Why Normalize by Price
----------------------
Derivatives volume and OI may be reported in contracts, not notional value. One contract’s economic weight changes with price (especially on inverse contracts). Dividing both Volume and OI by Close:
- Puts them on a comparable notional footing.
- Prevents false spikes purely from price moves.
- Makes Turnover comparable across time even as price trends.
Advanced Tips
-------------
- Calibrate threshold: Start from the 80th–90th percentile of the last 60–90 bars of Turnover; set the threshold a touch below that to surface early heat.
- Add OI-delta: Layer an OI change histogram (current − prior) to separate new positioning from pure churn.
- Linear vs inverse: For linear (USDT-margined) contracts, the normalization still works and keeps visuals consistent; for inverse, it’s essential.
Limitations
-----------
- Data availability: Works only if your symbol exposes an _OI feed on TradingView; otherwise it errors out.
- Exchange conventions: Volume units differ by venue (contracts, coin, notional). Normalization mitigates, but cross-symbol comparisons still need caution.
- Intrabar gaps: OI is typically end-of-bar; rapid intrabar shifts won’t appear until the bar closes.
Notes
-----
- Designed primarily for crypto derivatives. For non-crypto, the script blanks OI to avoid misleading plots and uses a daily TF when needed.
Credit
------
- Concept & data: Built for TradingView data feeds.
- Acknowledgment: Credit to TradingView default indicator as requested.
- Source: This write-up reflects the logic present in your uploaded script.
Disclaimer
----------
Markets move; indicators simplify. Use with position sizing, hard stops, and catalyst awareness. The Turnover Rate flags activity, not direction.
Nifty50 Swing Trading Super Indicator# 🚀 Nifty50 Swing Trading Super Indicator - Complete Guide
**Created by:** Gaurav
**Date:** August 8, 2025
**Version:** 1.0 - Optimized for Indian Markets
---
## 📋 Table of Contents
1. (#quick-start-guide)
2. (#indicator-overview)
3. (#installation-instructions)
4. (#parameter-settings)
5. (#signal-interpretation)
6. (#trading-strategy)
7. (#risk-management)
8. (#optimization-tips)
9. (#troubleshooting)
---
## 🎯 Quick Start Guide
### What You Get
✅ **2 Complete Pine Script Indicators:**
- `swing_trading_super_indicator.pine` - Universal version for all markets
- `nifty_optimized_super_indicator.pine` - Specifically optimized for Nifty50 & Indian stocks
✅ **Key Features:**
- Multi-component signal confirmation system
- Optimized for daily and 3-hour timeframes
- Built-in risk management with dynamic stops and targets
- Real-time signal strength monitoring
- Gap analysis for Indian market characteristics
### Immediate Setup
1. Copy the Pine Script code from `nifty_optimized_super_indicator.pine`
2. Paste into TradingView Pine Editor
3. Add to chart on daily or 3-hour timeframe
4. Look for 🚀BUY and 🔻SELL signals
5. Use the information table for signal confirmation
---
## 🔍 Indicator Overview
### Core Components Integration
**🎯 Range Filter (35% Weight)**
- Primary trend identification using adaptive volatility filtering
- Optimized sampling period: 21 bars for Indian market volatility
- Enhanced range multiplier: 3.0 to handle market gaps
- Provides trend direction and strength measurement
**⚡ PMAX (30% Weight)**
- Volatility-adjusted trend confirmation using ATR-based calculations
- Dynamic multiplier adjustment based on market volatility
- 14-period ATR with 2.5 multiplier for swing trading sensitivity
- Offers trailing stop functionality
**🏗️ Support/Resistance (20% Weight)**
- Dynamic level identification using pivot point analysis
- Tighter channel width (3%) for precise Indian market levels
- Enhanced strength calculation with historical interaction weighting
- Provides entry/exit timing and breakout signals
**📊 EMA Alignment (15% Weight)**
- Multi-timeframe moving average confirmation
- Key EMAs: 9, 21, 50, 200 (popular in Indian markets)
- Hierarchical alignment scoring for trend strength
- Additional trend validation layer
### Advanced Features
**🌅 Gap Analysis**
- Automatic detection of significant price gaps (>2%)
- Gap strength measurement and impact on signals
- Specific optimization for Indian market overnight gaps
- Visual gap markers on chart
**⏰ Multi-Timeframe Integration**
- Higher timeframe bias from daily/weekly data
- Configurable daily bias weight (default 70%)
- 3-hour confirmation for precise entry timing
- Prevents counter-trend trades against major timeframe
**🛡️ Risk Management**
- Dynamic stop-loss calculation using multiple methods
- Automatic profit target identification
- Position sizing guidance based on signal strength
- Anti-whipsaw logic to prevent false signals
---
## 📥 Installation Instructions
### Step 1: Access TradingView
1. Open TradingView.com
2. Navigate to Pine Editor (bottom panel)
3. Create a new indicator
### Step 2: Copy the Code
**For Nifty50 & Indian Stocks (Recommended):**
```pinescript
// Copy entire content from nifty_optimized_super_indicator.pine
```
**For Universal Use:**
```pinescript
// Copy entire content from swing_trading_super_indicator.pine
```
### Step 3: Configure and Apply
1. Click "Add to Chart"
2. Select daily or 3-hour timeframe
3. Adjust parameters if needed (defaults are optimized)
4. Enable alerts for signal notifications
### Step 4: Verify Installation
- Check that all components are visible
- Confirm information table appears in top-right
- Test with known trending stocks for signal validation
---
## ⚙️ Parameter Settings
### 🎯 Range Filter Settings
```
Sampling Period: 21 (optimized for Indian market volatility)
Range Multiplier: 3.0 (handles overnight gaps effectively)
Source: Close (most reliable for swing trading)
```
### ⚡ PMAX Settings
```
ATR Length: 14 (standard for daily/3H timeframes)
ATR Multiplier: 2.5 (balanced for swing trading sensitivity)
Moving Average Type: EMA (responsive to price changes)
MA Length: 14 (matches ATR period for consistency)
```
### 🏗️ Support/Resistance Settings
```
Pivot Period: 8 (shorter for Indian market dynamics)
Channel Width: 3% (tighter for precise levels)
Minimum Strength: 3 (higher quality levels only)
Maximum Levels: 4 (focus on strongest levels)
Lookback Period: 150 (sufficient historical data)
```
### 🚀 Super Indicator Settings
```
Signal Sensitivity: 0.65 (balanced for swing trading)
Trend Strength Requirement: 0.75 (high quality signals)
Gap Threshold: 2.0% (significant gap detection)
Daily Bias Weight: 0.7 (strong higher timeframe influence)
```
### 🎨 Display Options
```
Show Range Filter: ✅ (trend visualization)
Show PMAX: ✅ (trailing stops)
Show S/R Levels: ✅ (key price levels)
Show Key EMAs: ✅ (trend confirmation)
Show Signals: ✅ (buy/sell alerts)
Show Trend Background: ✅ (visual trend state)
Show Gap Markers: ✅ (gap identification)
```
---
## 📊 Signal Interpretation
### 🚀 BUY Signals
**Requirements for BUY Signal:**
- Price above Range Filter with upward trend
- PMAX showing bullish direction (MA > PMAX line)
- Support/resistance breakout or favorable positioning
- EMA alignment supporting upward movement
- Higher timeframe bias confirmation
- Overall signal strength > 75%
**Signal Strength Indicators:**
- **90-100%:** Extremely strong - Maximum position size
- **80-89%:** Very strong - Large position size
- **75-79%:** Strong - Standard position size
- **65-74%:** Moderate - Reduced position size
- **<65%:** Weak - Wait for better opportunity
### 🔻 SELL Signals
**Requirements for SELL Signal:**
- Price below Range Filter with downward trend
- PMAX showing bearish direction (MA < PMAX line)
- Resistance breakdown or unfavorable positioning
- EMA alignment supporting downward movement
- Higher timeframe bias confirmation
- Overall signal strength > 75%
### ⚖️ NEUTRAL Signals
**Characteristics:**
- Conflicting signals between components
- Low overall signal strength (<65%)
- Range-bound market conditions
- Wait for clearer directional bias
### 📈 Information Table Guide
**Component Status:**
- **BULL/BEAR:** Current signal direction
- **Strength %:** Component contribution strength
- **Status:** Additional context (STRONG/WEAK/ACTIVE/etc.)
**Overall Signal:**
- **🚀 STRONG BUY:** All systems aligned bullish
- **🔻 STRONG SELL:** All systems aligned bearish
- **⚖️ NEUTRAL:** Mixed or weak signals
---
## 💼 Trading Strategy
### Daily Timeframe Strategy
**Setup:**
1. Apply indicator to daily chart of Nifty50 or Indian stocks
2. Wait for 🚀BUY or 🔻SELL signal with >75% strength
3. Confirm higher timeframe bias alignment
4. Check for significant support/resistance levels
**Entry:**
- Enter on signal bar close or next bar open
- Use 3-hour chart for precise entry timing
- Avoid entries during major news events
- Consider gap analysis for overnight positions
**Position Sizing:**
- **>90% Strength:** 3-4% of portfolio
- **80-89% Strength:** 2-3% of portfolio
- **75-79% Strength:** 1-2% of portfolio
- **<75% Strength:** Avoid or minimal size
### 3-Hour Timeframe Strategy
**Setup:**
1. Confirm daily timeframe bias first
2. Apply indicator to 3-hour chart
3. Look for signals aligned with daily trend
4. Use for entry/exit timing optimization
**Entry Refinement:**
- Wait for 3H signal confirmation
- Enter on pullbacks to key levels
- Use tighter stops for better risk/reward
- Monitor intraday support/resistance
### Risk Management Rules
**Stop Loss Placement:**
1. **Primary:** Use indicator's dynamic stop level
2. **Secondary:** Below/above nearest support/resistance
3. **Maximum:** 2-3% of portfolio per trade
4. **Trailing:** Move stops with PMAX line
**Profit Taking:**
1. **Target 1:** First resistance/support level (50% position)
2. **Target 2:** Second resistance/support level (30% position)
3. **Runner:** Trail remaining 20% with PMAX
**Position Management:**
- Review positions at daily close
- Adjust stops based on new signals
- Exit if trend changes to opposite direction
- Reduce size during high volatility periods
---
## 🎯 Optimization Tips
### For Nifty50 Trading
- Use daily timeframe for primary signals
- Monitor sector rotation impact
- Consider index futures for better liquidity
- Watch for RBI policy and global cues impact
### For Individual Stocks
- Verify stock follows Nifty correlation
- Check sector-specific news and events
- Ensure adequate liquidity for position size
- Monitor earnings calendar for volatility
### Market Condition Adaptations
**Trending Markets:**
- Increase position sizes for strong signals
- Use wider stops to avoid whipsaws
- Focus on trend continuation signals
- Reduce counter-trend trading
**Range-Bound Markets:**
- Reduce position sizes
- Use tighter stops and quicker profits
- Focus on support/resistance bounces
- Increase signal strength requirements
**High Volatility Periods:**
- Reduce overall exposure
- Use smaller position sizes
- Increase stop-loss distances
- Wait for clearer signals
### Performance Monitoring
- Track win rate and average profit/loss
- Monitor signal quality over time
- Adjust parameters based on market changes
- Keep trading journal for pattern recognition
---
## 🔧 Troubleshooting
### Common Issues
**Q: Signals appear too frequently**
A: Increase "Trend Strength Requirement" to 0.8-0.9
**Q: Missing obvious trends**
A: Decrease "Signal Sensitivity" to 0.5-0.6
**Q: Too many false signals**
A: Enable "3H Confirmation" and increase strength requirements
**Q: Indicator not loading**
A: Check Pine Script version compatibility (requires v5)
### Parameter Adjustments
**For More Sensitive Signals:**
- Decrease Signal Sensitivity to 0.5-0.6
- Decrease Trend Strength Requirement to 0.6-0.7
- Increase Range Filter multiplier to 3.5-4.0
**For More Conservative Signals:**
- Increase Signal Sensitivity to 0.7-0.8
- Increase Trend Strength Requirement to 0.8-0.9
- Enable all confirmation features
### Performance Issues
- Reduce lookback periods if chart loads slowly
- Disable some visual elements for better performance
- Use on liquid stocks/indices for best results
---
## 📞 Support & Updates
This super indicator combines the best of Range Filter, PMAX, and Support/Resistance analysis specifically optimized for Indian market swing trading. The multi-component approach significantly improves signal quality while the built-in risk management features help protect capital.
**Remember:** No indicator is 100% accurate. Always combine with proper risk management, market analysis, and your trading experience for best results.
**Happy Trading! 🚀**

MSTY-WNTR Rebalancing SignalMSTY-WNTR Rebalancing Signal
## Overview
The **MSTY-WNTR Rebalancing Signal** is a custom TradingView indicator designed to help investors dynamically allocate between two YieldMax ETFs: **MSTY** (YieldMax MSTR Option Income Strategy ETF) and **WNTR** (YieldMax Short MSTR Option Income Strategy ETF). These ETFs are tied to MicroStrategy (MSTR) stock, which is heavily influenced by Bitcoin's price due to MSTR's significant Bitcoin holdings.
MSTY benefits from upward movements in MSTR (and thus Bitcoin) through a covered call strategy that generates income but caps upside potential. WNTR, on the other hand, provides inverse exposure, profiting from MSTR declines but losing in rallies. This indicator uses Bitcoin's momentum and MSTR's relative strength to signal when to hold MSTY (bullish phases), WNTR (bearish phases), or stay neutral, aiming to optimize returns by switching allocations at key turning points.
Inspired by strategies discussed in crypto communities (e.g., X posts analyzing MSTR-linked ETFs), this indicator promotes an active rebalancing approach over a "set and forget" buy-and-hold strategy. In simulated backtests over the past 12 months (as of August 4, 2025), the optimized version has shown potential to outperform holding 100% MSTY or 100% WNTR alone, with an illustrative APY of ~125% vs. ~6% for MSTY and ~-15% for WNTR in one scenario.
**Important Disclaimer**: This is not financial advice. Past performance does not guarantee future results. Always consult a financial advisor. Trading involves risk, and you could lose money. The indicator is for educational and informational purposes only.
## Key Features
- **Momentum-Based Signals**: Uses a Simple Moving Average (SMA) on Bitcoin's price to detect bullish (price > SMA) or bearish (price < SMA) trends.
- **RSI Confirmation**: Incorporates MSTR's Relative Strength Index (RSI) to filter signals, avoiding overbought conditions for MSTY and oversold for WNTR.
- **Visual Cues**:
- Green upward triangle for "Hold MSTY".
- Red downward triangle for "Hold WNTR".
- Yellow cross for "Switch" signals.
- Background color: Green for MSTY, red for WNTR.
- **Information Panel**: A table in the top-right corner displays real-time data: BTC Price, SMA value, MSTR RSI, and current Allocation (MSTY, WNTR, or Neutral).
- **Alerts**: Configurable alerts for holding MSTY, holding WNTR, or switching.
- **Optimized Parameters**: Defaults are tuned (SMA: 10 days, RSI: 15 periods, Overbought: 80, Oversold: 20) based on simulations to reduce whipsaws and capture trends effectively.
## How It Works
The indicator's logic is straightforward yet effective for volatile assets like Bitcoin and MSTR:
1. **Primary Trigger (Bitcoin Momentum)**:
- Calculate the SMA of Bitcoin's closing price (default: 10-day).
- Bullish: Current BTC price > SMA → Potential MSTY hold.
- Bearish: Current BTC price < SMA → Potential WNTR hold.
2. **Secondary Filter (MSTR RSI Confirmation)**:
- Compute RSI on MSTR stock (default: 15-period).
- For bullish signals: If RSI > Overbought (80), signal Neutral (avoid overextended rallies).
- For bearish signals: If RSI < Oversold (20), signal Neutral (avoid capitulation bottoms).
3. **Allocation Rules**:
- Hold 100% MSTY if bullish and not overbought.
- Hold 100% WNTR if bearish and not oversold.
- Neutral otherwise (e.g., during choppy or extreme markets) – consider holding cash or avoiding trades.
4. **Rebalancing**:
- Switch signals trigger when the hold changes (e.g., from MSTY to WNTR).
- Recommended frequency: Weekly reviews or on 5% BTC moves to minimize trading costs (aim for 4-6 trades/year).
This approach leverages Bitcoin's influence on MSTR while mitigating the risks of MSTY's covered call drag during downtrends and WNTR's losses in uptrends.
## Setup and Usage
1. **Chart Requirements**:
- Apply this indicator to a Bitcoin chart (e.g., BTCUSD on Binance or Coinbase, daily timeframe recommended).
- Ensure MSTR stock data is accessible (TradingView supports it natively).
2. **Adding to TradingView**:
- Open the Pine Editor.
- Paste the script code.
- Save and add to your chart.
- Customize inputs if needed (e.g., adjust SMA/RSI lengths for different timeframes).
3. **Interpretation**:
- **Green Background/Triangle**: Allocate 100% to MSTY – Bitcoin is in an uptrend, MSTR not overbought.
- **Red Background/Triangle**: Allocate 100% to WNTR – Bitcoin in downtrend, MSTR not oversold.
- **Yellow Switch Cross**: Rebalance your portfolio immediately.
- **Neutral (No Signal)**: Panel shows "Neutral" – Hold cash or previous position; reassess weekly.
- Monitor the panel for key metrics to validate signals manually.
4. **Backtesting and Strategy Integration**:
- Convert to a strategy script by changing `indicator()` to `strategy()` and adding entry/exit logic for automated testing.
- In simulations (e.g., using Python or TradingView's backtester), it has outperformed buy-and-hold in volatile markets by ~100-200% relative APY, but results vary.
- Factor in fees: ETF expense ratios (~0.99%), trading commissions (~$0.40/trade), and slippage.
5. **Risk Management**:
- Use with a diversified portfolio; never allocate more than you can afford to lose.
- Add stop-losses (e.g., 10% trailing) to protect against extreme moves.
- Rebalance sparingly to avoid over-trading in sideways markets.
- Dividends: Reinvest MSTY/WNTR payouts into the current hold for compounding.
## Performance Insights (Simulated as of August 4, 2025)
Based on synthetic backtests modeling the last 12 months:
- **Optimized Strategy APY**: ~125% (by timing switches effectively).
- **Hold 100% MSTY APY**: ~6% (gains from BTC rallies offset by downtrends).
- **Hold 100% WNTR APY**: ~-15% (losses in bull phases outweigh bear gains).
In one scenario with stronger volatility, the strategy achieved ~4533% APY vs. 10% for MSTY and -34% for WNTR, highlighting its potential in dynamic markets. However, these are illustrative; real results depend on actual BTC/MSTR movements. Test thoroughly on historical data.
## Limitations and Considerations
- **Data Dependency**: Relies on accurate BTC and MSTR data; delays or gaps can affect signals.
- **Market Risks**: Bitcoin's volatility can lead to false signals (whipsaws); the RSI filter helps but isn't perfect.
- **No Guarantees**: This indicator doesn't predict the future. MSTR's correlation to BTC may change (e.g., due to regulatory events).
- **Not for All Users**: Best for intermediate/advanced traders familiar with ETFs and crypto. Beginners should paper trade first.
- **Updates**: As of August 4, 2025, this is version 1.0. Future updates may include volume filters or EMA options.
If you find this indicator useful, consider leaving a like or comment on TradingView. Feedback welcome for improvements!

CandelaCharts - HTF Sweeps📝 Overview
This indicator lets you overlay a higher timeframe (HTF) onto your current chart, giving you a clearer view of broader market movements without switching timeframes.
This indicator also detects liquidity sweeps and plots them on both the higher timeframe (HTF) and the current lower timeframe (LTF), helping traders clearly spot potential reversal points. It adds LTF dividers for better structure clarity, making it easier to align with HTF shifts and refine entry timing with greater precision.
📦 Features
This indicator identifies price sweeps and their invalidations, helping traders spot potential liquidity grabs and failed breakout attempts.
Overlay a configurable higher timeframe (HTF) on the current chart
Detects and plots liquidity sweeps on both HTF and LTF
Adds lower timeframe (LTF) dividers for improved structure clarity
Ideal for ICT-style top-down analysis and precision entries without switching charts
⚙️ Settings
Customize the indicator to suit your strategy. Alert options are also available, so you can stay informed when key market events are triggered.
Timeframes: Select the higher timeframe (HTF) to overlay on your current chart.
HTF Coloring: Customize the color scheme for HTF candles.
HTF Offset: Space of HTF Candles and current chart.
HTF Size: Adjust the size of HTF candles.
HTF Labels: Toggle labels for HTF.
LTF H/L Line: Show or hide high/low lines from the lower timeframe.
LTF O/C Line: Display open/close lines from the lower timeframe.
Sweep: Enable detection and plotting of liquidity sweeps.
I-sweep: Toggle invalidated sweep detection.
Alerts: Enable Sweep Formation or Invalidation alerts
⚡️ Showcase
See the indicator applied in live market scenarios, illustrating how sweep detections and invalidations unfold on various charts.
HTF Candles
HTF Sweeps
LTF Sweeps
Invalidated Sweeps
🚨 Alerts
This indicator includes built-in alert functionality to keep you informed of key market events in real time. It supports the following customizable alerts on TradingView:
Sweep Detection: Notifies you when a price sweep is detected—either a liquidity sweep above recent highs or below recent lows. This can be a strong signal of potential reversals or liquidity grabs by larger market participants.
Sweep Invalidation: Alerts you when a previously detected sweep becomes invalidated due to price action moving beyond a defined threshold. This helps traders stay adaptive and avoid acting on outdated signals.
These alerts are fully integrated with TradingView’s native alert system, so you can receive notifications via app, email, or pop-up—ensuring you're always up to date, even when you're away from the chart.
⚠️ Disclaimer
Trading involves significant risk, and many participants may incur losses. The content on this site is not intended as financial advice and should not be interpreted as such. Decisions to buy, sell, hold, or trade securities, commodities, or other financial instruments carry inherent risks and are best made with guidance from qualified financial professionals. Past performance is not indicative of future results.

Ticker Pulse Meter BasicPairs nicely with the Contrarian 100 MA located here:
and the Enhanced Stock Ticker with 50MA vs 200MA located here:
Description
The Ticker Pulse Meter Basic is a dynamic Pine Script v6 indicator designed to provide traders with a visual representation of a stock’s price position relative to its short-term and long-term ranges, enabling clear entry and exit signals for long-only trading strategies. By calculating three normalized metrics—Percent Above Long & Above Short, Percent Above Long & Below Short, and Percent Below Long & Below Short—this indicator offers a unique "pulse" of market sentiment, plotted as stacked area charts in a separate pane. With customizable lookback periods, thresholds, and signal plotting options, it empowers traders to identify optimal entry points and profit-taking levels. The indicator leverages Pine Script’s force_overlay feature to plot signals on either the main price chart or the indicator pane, making it versatile for various trading styles.
Key Features
Pulse Meter Metrics:
Computes three percentages based on short-term (default: 50 bars) and long-term (default: 200 bars) lookback periods:
Percent Above Long & Above Short: Measures price strength when above both short and long ranges (green area).
Percent Above Long & Below Short: Indicates mixed momentum (orange area).
Percent Below Long & Below Short: Signals weakness when below both ranges (red area).
Flexible Signal Plotting:
Toggle between plotting entry (blue dots) and exit (white dots) signals on the main price chart (location.abovebar/belowbar) or in the indicator pane (location.top/bottom) using the Plot Signals on Main Chart option.
Entry/Exit Logic:
Long Entry: Triggered when Percent Above Long & Above Short crosses above the high threshold (default: 20%) and Percent Below Long & Below Short is below the low threshold (default: 40%).
Long Exit: Triggered when Percent Above Long & Above Short crosses above the profit-taking level (default: 95%).
Visual Enhancements:
Plots stacked area charts with semi-transparent colors (green, orange, red) for intuitive trend analysis.
Displays threshold lines for entry (high/low) and profit-taking levels.
Includes a ticker and timeframe table in the top-right corner for quick reference.
Alert Conditions: Supports alerts for long entry and exit signals, integrable with TradingView’s alert system for automated trading.
Technical Innovation: Combines normalized price metrics with Pine Script v6’s force_overlay for seamless signal integration on the price chart or indicator pane.
Technical Details
Calculation Logic:
Uses confirmed bars (barstate.isconfirmed) to calculate metrics, ensuring reliability.
Short-term percentage: (close - lowest(low, lookback_short)) / (highest(high, lookback_short) - lowest(low, lookback_short)).
Long-term percentage: (close - lowest(low, lookback_long)) / (highest(high, lookback_long) - lowest(low, lookback_long)).
Derived metrics:
pct_above_long_above_short = (pct_above_long * pct_above_short) * 100.
pct_above_long_below_short = (pct_above_long * (1 - pct_above_short)) * 100.
pct_below_long_below_short = ((1 - pct_above_long) * (1 - pct_above_short)) * 100.
Signal Plotting:
Entry signals (long_entry) use ta.crossover to detect when pct_above_long_above_short crosses above entryThresholdhigh and pct_below_long_below_short is below entryThresholdlow.
Exit signals (long_exit) use ta.crossover for pct_above_long_above_short crossing above profitTake.
Signals are plotted as tiny circles with force_overlay=true for main chart or standard plotting for the indicator pane.
Performance Considerations: Optimized for efficiency by calculating metrics only on confirmed bars and using lightweight plotting functions.
How to Use
Add to Chart:
Copy the script into TradingView’s Pine Editor and apply it to your chart.
Configure Settings:
Short Lookback Period: Adjust the short-term lookback (default: 50 bars) for sensitivity.
Long Lookback Period: Set the long-term lookback (default: 200 bars) for broader context.
Entry Thresholds: Modify high (default: 20%) and low (default: 40%) thresholds for entry conditions.
Profit Take Level: Set the exit threshold (default: 95%) for profit-taking.
Plot Signals on Main Chart: Check to display signals on the price chart; uncheck for the indicator pane.
Interpret Signals:
Long Entry: Blue dots indicate a strong bullish setup when price is high relative to both lookback ranges and weakness is low.
Long Exit: White dots signal profit-taking when strength reaches overbought levels.
Use the stacked area charts to assess trend strength and momentum.
Set Alerts:
Create alerts for Long Entry and Long Exit conditions using TradingView’s alert system.
Customize Visuals:
Adjust colors and thresholds via TradingView’s settings for better visibility.
The ticker table displays the symbol and timeframe in the top-right corner.
Example Use Cases
Swing Trading: Use entry signals to capture short-term bullish moves within a broader uptrend, exiting at profit-taking levels.
Trend Confirmation: Monitor the green area (Percent Above Long & Above Short) for sustained bullish momentum.
Market Sentiment Analysis: Use the stacked areas to gauge bullish vs. bearish sentiment across timeframes.
Notes
Testing: Backtest the indicator on your chosen market and timeframe to validate its effectiveness.
Compatibility: Built for Pine Script v6 and tested on TradingView as of June 20, 2025.
Limitations: Signals are long-only; adapt the script for short strategies if needed.
Enhancements: Consider adding a histogram for the difference between metrics or additional thresholds for nuanced trading.
Acknowledgments
Inspired by public Pine Script examples and designed to simplify complex market dynamics into a clear, actionable tool. For licensing or support, contact Chuck Schultz (@chuckaschultz) on TradingView. Share feedback in the comments, and happy trading!

Abusuhil Bullish Candles (Label + Table)Abusuhil Bullish Candles is a pattern recognition indicator designed to identify key bullish reversal candlestick formations including Hammer, Bullish Engulfing, Morning Star, Piercing Line, Three White Soldiers, and Three Inside Up.
The script includes optional filters such as Stochastic and Volume Confirmation, providing more precise signal detection.
Each pattern and filter is fully customizable via settings. Alerts are also included to support active trading workflows.
This script was written originally and does not copy open-source indicators. It's ideal for traders seeking visual clarity on bullish opportunities with professional-grade logic.
مؤشر الشموع الصعودية هو مؤشر احترافي يكتشف أبرز نماذج الانعكاس الصعودي في الشموع اليابانية مثل: Hammer، Bullish Engulfing، Morning Star، Piercing Line، Three White Soldiers، و Three Inside Up.
يوفر المؤشر فلاتر إضافية مثل فلتر Stochastic وفلتر الفوليوم لتعزيز دقة الإشارات. جميع الإعدادات قابلة للتعديل بما يتناسب مع احتياج كل متداول.
يحتوي المؤشر أيضًا على تنبيهات تلقائية لدعم استراتيجيات التداول اللحظي. تمت برمجة المؤشر من الصفر ويعتمد على منطق خاص غير منسوخ من سكربتات مفتوحة المصدر.
--------------------------------------------------------------------------------------------------------------------
🇸🇦 التحديثات – النسخة الجديدة (Abusuhil Bullish Candles)
✅ تم تغيير الملصقات بشكل أوضح: باستخدام دوائر ملونة أسفل الشموع بدلًا من المربعات لتفادي التراكب.
🟦 إضافة جدول تفاعلي على الشارت يعرض أسماء النماذج وألوانها المخصصة.
🎨 إمكانية تغيير ألوان كل نموذج من الإعدادات حسب رغبة المستخدم.
🧩 تفعيل/تعطيل كل نموذج على حدة من خلال إعدادات منفصلة.
🔔 إضافة تنبيه احترافي واحد يتم تفعيله عند تحقق أي نموذج نشط من النماذج المحددة.
📋 توافق كامل مع سياسة TradingView:
لا يحتوي على أكواد منسوخة أو مبنية على مؤشرات داخلية.
لا تكرار للوظائف أو العناوين.
وصف واضح مع تحكم كامل للمستخدم.
🇬🇧 Updates – Latest Version (Abusuhil Bullish Candles)
✅ Clearer Signal Labels: Now uses colored circles under candles instead of labels to avoid overlapping.
🟦 Interactive Table showing pattern names and user-defined colors.
🎨 Customizable colors for each candlestick pattern from the settings menu.
🧩 Toggle each pattern independently using dedicated checkboxes.
🔔 Single professional alert condition that triggers only when any enabled pattern is detected.
📋 Fully compliant with TradingView's publishing policy:
No reused or built-in indicator code.
No duplicated logic or misleading titles.
Clean and modular design with full user customization.

Tight Range Display with Background🌟 Tight Range Transparency Display with Background
What Is This Indicator?
Hey traders! Ever wanted a simple way to spot those quiet, low-volatility moments in the market that often signal a big move is coming? The Tight Range Transparency Display with Background does exactly that! This indicator highlights periods where the price is moving in a tight range—think of it as the calm before the storm. It paints the chart background blue to show these zones, with the shade getting darker the tighter the range becomes. It’s like having a visual cue to say, “Hey, something might be brewing here!”
Why You’ll Love It
Spot Key Moments Easily: The blue background makes it super easy to see when the market is in a tight range, which often happens before breakouts or big trends.
Customizable Settings: You can tweak the range thresholds to match your trading style—whether you’re looking for super tight zones or slightly broader ones.
Visual Clarity: The background gets darker when the range is tighter, giving you a quick sense of how compressed the price action is.
Perfect for Any Market: Works on stocks, forex, crypto, or any chart you trade, across any timeframe.
How to Use It
Add It to Your Chart:
Just copy this script into TradingView’s Pine Editor and hit "Add to Chart." It’ll overlay right on your price chart.
Tweak the Settings:
Open the indicator settings and use the dropdown menus to pick your preferred "Tight Range %" and "Wide Range %." For example, set a Tight Range % of 2.0% to catch smaller ranges, or go higher like 10.0% for broader ones.
You can also adjust the ATR Period (default is 5) to make the indicator more or less sensitive to recent price swings.
Watch for the Blue Background:
When the price enters a tight range, the chart background turns blue. The darker the blue, the tighter the range—meaning a potential breakout could be closer!
Trade Smarter:
Use these tight range zones to prepare for potential breakouts. For example, if you see a dark blue background, it might be a good time to watch for a big price move.
Pair this with other tools like support/resistance levels or volume spikes to confirm your trades.
Who Is This For?
Swing Traders: Perfect for spotting consolidation zones before a big swing.
Breakout Traders: Tight ranges often lead to breakouts—use this to time your entries.
Smart Money Followers: If you’re into smart money concepts, tight ranges can signal accumulation or distribution phases.
Beginners & Pros Alike: It’s easy to use for new traders but powerful enough for seasoned pros.
Real-World Example
Imagine you’re trading a stock on a 1-hour chart. You notice the background turns blue, and it’s getting darker over a few bars. This tells you the price range is tightening—maybe the stock is consolidating after a big move. You check your other indicators, see a volume spike, and spot a breakout above resistance. Boom! You catch the next big trend, all because this indicator helped you focus on the right moment.
Tips for Best Results
Try Different Timeframes: Tight ranges on a 15-minute chart might signal short-term moves, while a daily chart could highlight bigger trends.
Adjust for Your Market: For volatile markets like crypto, you might want a higher Tight Range % (e.g., 10.0%). For calmer markets like forex, try a lower setting (e.g., 2.0%).
Combine with Other Tools: Use this alongside trendlines, moving averages, or volume indicators to confirm your setups.
Why I Made This
I created this indicator because I wanted a simple, visual way to spot those critical low-volatility zones without cluttering my chart. The dynamic background color makes it intuitive to see when the market is “coiling up” for a potential move. I hope it helps you find better trading opportunities just like it does for me!
Let’s Connect
If you find this indicator helpful, I’d love to hear about it! Drop a comment or a rating to let me know how it’s working for you. Got ideas to make it even better? Feel free to message me on TradingView—I’m always open to suggestions.
Published On
Date: May 22, 2025
Happy trading, and may your charts always be in your favor! 🚀
How to Publish on TradingView
Open Pine Editor:
On TradingView, open a chart and go to the Pine Editor tab at the bottom.
Paste the Code:
Copy the script you provided and paste it into the Pine Editor.
Compile:
Click "Add to Chart" to ensure it compiles without errors.
Publish:
Click the "Publish Script" button (paper plane icon) in the Pine Editor.
Select "Publish New Script."
Add the Description:
Title: "Tight Range Transparency Display with Background"
Description: Copy the content above into the description field.
Visibility: Choose "Public" to share with everyone (or "Invite-Only" for restricted access).
Tags: Add tags like "tight range", "breakout", "smart money", "volatility", "swing trading".
Screenshot: Add a screenshot of the indicator on a chart, showing the blue background during a tight range.
Submit:
Click "Publish" to submit. TradingView will review it and make it live if it meets their guidelines.
Additional Notes
Screenshot Tip: Use a chart where the blue background is clearly visible (e.g., during a consolidation period) to make the indicator’s effect stand out.
Engage with Users: After publishing, respond to comments and feedback to build a positive reputation on TradingView.
This content is designed to be approachable and engaging, helping traders understand the value of your indicator and encouraging them to try it out.

VWAP Breakout Strategy + EMAs + Clean Cycle/TP/SL PlotsHere’s a quick user-guide to get you up and running with your “VWAP Breakout Strategy + EMAs + Clean Cycle/TP/SL Plots” script in TradingView:
⸻
1. Installing the Script
1. Open TradingView, go to Pine Editor (bottom panel).
2. Paste in your full Pine-v6 code and hit Add to chart.
3. Save it (“Save as…”): give it a memorable name (e.g. “VWAP Breakout+EMAs”).
⸻
2. Configuring Your Inputs
Once it’s on the chart, click the ⚙️ Settings icon to tune:
Setting Default What it does
ATR Length 14 Period for average true range (volatility measure)
ATR Multiplier for Stop 1.5 How many ATRs away your stop-loss sits
TP1 / TP2 Multipliers (ATR) 1.0 / 2.0 Distance of TP1 and TP2 in ATR multiples
Show VWAP / EMAs On Toggles the blue VWAP line & EMAs (100/34/5)
Full Cycle Range Points 200 Height of the shaded “cycle zone”
Pivot Lookback 5 How many bars back to detect a pivot low
Round Number Step 500 Spacing of your dotted horizontal lines
Show TP/SL Labels On Toggles all the “ENTRY”, “TP1”, “TP2”, “STOP” tags
Feel free to adjust ATR multipliers and cycle-zone size based on the instrument’s typical range.
⸻
3. Reading the Signals
• Long Entry:
• Trigger: price crosses above VWAP
• You’ll see a green “Buy” tag at the low of the signal bar, plus an “ENTRY (Long)” label at the close.
• Stop is plotted as a red dashed line below (ATR × 1.5), and TP1/TP2 as teal and purple lines above.
• Short Entry:
• Trigger: price crosses below VWAP
• A red “Sell” tag appears at the high, with “ENTRY (Short)” at the close.
• Stop is the green line above; TP1/TP2 are dashed teal/purple lines below.
⸻
4. Full Cycle Zone
Whenever a new pivot low is detected (using your Pivot Lookback), the script deletes the old box and draws a shaded yellow rectangle from that low up by “Full Cycle Range Points.”
• Use this to visualize the “maximum expected swing” from your pivot.
• You can quickly see whether price is still traveling within a normal cycle or has overstretched.
⸻
5. Round-Number Levels
With Show Round Number Levels enabled, you’ll always get horizontal dotted lines at the nearest multiples of your “Round Number Step” (e.g. every 500 points).
• These often act as psychological support/resistance.
• Handy to see confluence with VWAP or cycle-zone edges.
⸻
6. Tips & Best-Practices
• Timeframes: Apply on any intraday chart (5 min, 15 min, H1…), but match your ATR length & cycle-points to the timeframe’s typical range.
• Backtest first: Use the Strategy Tester tab to review performance, tweak ATR multipliers or cycle size, then optimize.
• Combine with context: Don’t trade VWAP breakouts blindly—look for confluence (e.g. support/resistance zones, higher-timeframe trend).
• Label clutter: If too many labels build up, you can toggle Show TP/SL Labels off and rely just on the lines.
⸻
That’s it! Once you’ve added it to your chart and dialed in the inputs, your entries, exits, cycle ranges, and key levels will all be plotted automatically. Feel free to experiment with the ATR multipliers and cycle-zone size until it fits your instrument’s personality. Happy trading!

Candle Height & Trend Probability DashboardDescription and Guide
Description:
This Pine Script for TradingView displays a dashboard that calculates the probability of price increases or decreases based on past price movements. It analyzes the last 30 candles (by default) and shows the probabilities for different timeframes (from 1 minute to 1 week). Additionally, it checks volatility using the ATR indicator.
Script Features:
Calculates probabilities of an upward (Up %) or downward (Down %) price move based on past candles.
Displays a dashboard showing probabilities for multiple timeframes.
Color-coded probability display:
Green if the upward probability exceeds a set threshold.
Red if the downward probability exceeds the threshold.
Yellow if neither threshold is exceeded.
Considers volatility using the ATR indicator.
Triggers alerts when probabilities exceed specific values.
How to Use:
Insert the script into TradingView: Copy and paste the script into the Pine Script editor.
Adjust parameters:
lookback: Number of past candles used for calculation (default: 30).
alertThresholdUp & alertThresholdDown: Thresholds for probabilities (default: 51%).
volatilityLength & volatilityThreshold: ATR volatility settings.
dashboardPosition: Choose where the dashboard appears on the chart.
Enable visualization: The dashboard will be displayed over the chart.
Set alerts: The script triggers notifications when probabilities exceed set thresholds.

Dynamic Support and Resistance ### Indicator: Dynamic Support and Resistance
#### Overview:
The *Dynamic Support and Resistance* indicator is a powerful tool designed to help traders identify key price levels on a chart. It dynamically calculates support and resistance levels based on pivot points and the Average True Range (ATR). The indicator also highlights broken support and resistance zones, providing visual cues for potential trend reversals or continuations.
---
### Key Features:
1. *Dynamic Support and Resistance Levels*:
- The indicator identifies support and resistance levels using pivot highs and lows within a user-defined range.
- These levels are adjusted using the ATR to account for market volatility, making them more responsive to changing market conditions.
2. *Support and Resistance Zones*:
- The indicator draws boxes around the support and resistance levels, with customizable colors and widths.
- The width of the zones is determined by the ATR and a user-defined multiplier, allowing traders to adjust the sensitivity of the zones.
3. *Broken Zones*:
- When price breaks through a support or resistance zone, the zone is highlighted with a distinct color to indicate a potential shift in market sentiment.
- Traders can limit the number of broken zones displayed on the chart to avoid clutter.
4. *Customizable Inputs*:
- *Range Candle Count*: Defines the number of candles analyzed to determine pivot points. Increasing this value will result in fewer but more significant levels, while decreasing it will produce more levels that are sensitive to shorter-term price movements.
- *ATR Period*: Controls the sensitivity of the ATR calculation. A shorter period makes the ATR more responsive to recent price changes, while a longer period smooths it out.
- *Box Width Multiplier*: Adjusts the width of the support and resistance zones. A higher multiplier creates wider zones, which may be useful in more volatile markets.
- *Max Broken Zones*: Limits the number of broken zones displayed on the chart. This helps keep the chart clean and focused on the most recent breaks.
---
### How It Works:
1. *Pivot Points*:
- The indicator identifies pivot highs and lows within the specified range. These pivots serve as the basis for calculating support and resistance levels.
2. *ATR Adjustment*:
- The ATR is used to adjust the support and resistance levels, making them more dynamic and responsive to market volatility.
3. *Zone Creation*:
- Support and resistance zones are drawn as boxes around the pivot levels. The width of these zones is determined by the ATR and the box width multiplier.
4. *Zone Breaks*:
- When price breaks through a zone, the zone is highlighted with a distinct color, and the broken zone is added to an array. If the number of broken zones exceeds the user-defined limit, the oldest broken zone is removed from the chart.
---
### How to Use:
1. *Trend Identification*:
- Use the support and resistance levels to identify key price levels where the market may reverse or consolidate.
- Broken zones can signal potential trend reversals or continuations.
2. *Entry and Exit Points*:
- Traders can use the support and resistance zones as potential entry or exit points. For example, buying near support or selling near resistance.
- Broken zones can be used as confirmation for breakout strategies.
3. *Risk Management*:
- The width of the zones can help traders set stop-loss levels. For example, placing a stop-loss just outside a support or resistance zone.
4. *Customization*:
- Adjust the input parameters to suit your trading style and the specific market conditions. For example, increase the range candle count for longer-term analysis or decrease it for shorter-term trading.
---
### Who Should Use This Indicator?
- *Swing Traders*: Can use the indicator to identify key levels for potential reversals or breakouts.
- *Day Traders*: Can benefit from the dynamic levels and zones, especially in volatile markets.
- *Position Traders*: Can use the indicator to identify long-term support and resistance levels.
- *Breakout Traders*: Can use the broken zones to confirm breakouts and plan their trades accordingly.
---
### Input Parameters and Their Effects:
1. *Range Candle Count*:
- *Increase*: Produces fewer but more significant levels, suitable for longer-term analysis.
- *Decrease*: Produces more levels, sensitive to shorter-term price movements.
2. *ATR Period*:
- *Increase*: Smoothens the ATR, making the levels less sensitive to recent price changes.
- *Decrease*: Makes the ATR more responsive to recent price changes, resulting in more dynamic levels.
3. *Box Width Multiplier*:
- *Increase*: Creates wider zones, suitable for more volatile markets.
- *Decrease*: Creates narrower zones, suitable for less volatile markets.
4. *Max Broken Zones*:
- *Increase*: Displays more broken zones on the chart, providing more historical context.
- *Decrease*: Keeps the chart clean by displaying only the most recent broken zones.
---
### Conclusion:
The *Dynamic Support and Resistance* indicator is a versatile tool that can be adapted to various trading styles and market conditions. By dynamically adjusting to market volatility and highlighting key price levels, it provides traders with valuable insights into potential support and resistance areas. Whether you're a swing trader, day trader, or position trader, this indicator can help you make more informed trading decisions.
---
### Publishing on TradingView:
- *Title*: Dynamic Support and Resistance
- *Description*: A dynamic support and resistance indicator that uses pivot points and ATR to identify key price levels. Includes customizable support/resistance zones and highlights broken zones for breakout trading.
- *Tags*: support, resistance, ATR, pivot points, breakout, trading, indicator
- *Access*: Public or Invite-only, depending on your preference.
This indicator is ready to be published on TradingView, and the detailed description above will help users understand its functionality and how to use it effectively.

Trend Detection
#### *Description:*
This *Trend Detection* indicator is designed to help traders identify and confirm trends in the market using a combination of moving averages, volume analysis, and MACD filters. It provides clear visual signals for uptrends and downtrends, along with customizable settings to adapt to different trading styles and timeframes. The indicator is suitable for both beginners and advanced traders who want to improve their trend-following strategies.
---
#### *Key Features:*
1. *Trend Detection:*
- Uses *Moving Averages (MA)* to determine the overall trend direction.
- Supports multiple MA types: *SMA (Simple), **EMA (Exponential), **WMA (Weighted), and **HMA (Hull)*.
2. *Advanced Filters:*
- *MACD Filter:* Confirms trends using MACD crossovers.
- *Volume Filter:* Ensures trends are supported by above-average volume.
- *Multi-Timeframe Filter:* Validates trends using a higher timeframe (e.g., Daily or Weekly).
3. *Visual Signals:*
- Plots a *trend line* on the chart to indicate the current trend direction.
- Fills the background with *green* for uptrends and *red* for downtrends.
4. *Customizable Settings:*
- Adjust the *MA lengths, **MACD parameters, and **confirmation thresholds* to suit your trading strategy.
- Control the transparency of the background fill for better chart readability.
5. *Alerts:*
- Generates *buy/sell signals* when a trend is confirmed.
- Alerts can be set to trigger at the close of a candle for precise entry/exit points.
---
#### *How to Use:*
1. *Adding the Indicator:*
- Copy and paste the Pine Script code into the TradingView Pine Script editor.
- Add the indicator to your chart.
2. *Configuring the Settings:*
- *Trend Settings:*
- Choose the *MA type* (e.g., EMA for faster response, HMA for smoother trends).
- Set the *Trend MA Period* (e.g., 200 for long-term trends) and *Filter MA Period* (e.g., 100 for medium-term trends).
- *Advanced Filters:*
- Enable/disable the *MACD Filter* and adjust its parameters (Fast, Slow, Signal).
- Enable/disable the *Volume Filter* to ensure trends are supported by volume.
- *Multi-Timeframe Filter:*
- Enable this filter to validate trends using a higher timeframe (e.g., Daily or Weekly).
3. *Interpreting the Signals:*
- *Uptrend:* The trend line turns *green*, and the background is filled with a transparent green color.
- *Downtrend:* The trend line turns *red*, and the background is filled with a transparent red color.
- *Alerts:* Buy/sell signals are generated when the trend is confirmed.
4. *Using Alerts:*
- Set up alerts for *Buy Signal* (bullish reversal) and *Sell Signal* (bearish reversal).
- Alerts can be configured to trigger at the close of a candle for precise execution.
---
#### *Settings and Their Effects:*
1. *MA Type:*
- *SMA:* Smooth but lagging. Best for long-term trends.
- *EMA:* Faster response to price changes. Suitable for medium-term trends.
- *WMA:* Gives more weight to recent prices. Useful for short-term trends.
- *HMA:* Combines speed and smoothness. Ideal for all timeframes.
2. *Trend MA Period:*
- A longer period (e.g., 200) identifies long-term trends but may lag.
- A shorter period (e.g., 50) reacts faster but may produce false signals.
3. *Filter MA Period:*
- Acts as a secondary filter to confirm the trend.
- A shorter period (e.g., 50) provides tighter confirmation but may increase noise.
4. *MACD Filter:*
- Ensures trends are confirmed by MACD crossovers.
- Adjust the *Fast, **Slow, and **Signal* lengths to match your trading style.
5. *Volume Filter:*
- Ensures trends are supported by above-average volume.
- Reduces false signals during low-volume periods.
6. *Multi-Timeframe Filter:*
- Validates trends using a higher timeframe (e.g., Daily or Weekly).
- Increases reliability but may delay signals.
7. *Confirmation Value:*
- Sets the minimum percentage deviation from the trend MA required to confirm a trend.
- A higher value (e.g., 2.0%) reduces false signals but may delay trend detection.
8. *Confirmation Bars:*
- Sets the number of bars required to confirm a trend.
- A higher value (e.g., 5 bars) ensures sustained trends but may delay signals.
---
#### *Who Should Use This Indicator?*
1. *Trend Followers:*
- Traders who focus on identifying and riding long-term trends.
- Suitable for *swing traders* and *position traders*.
2. *Day Traders:*
- Can use shorter MA periods and faster filters (e.g., EMA, HMA) for intraday trends.
3. *Volume-Based Traders:*
- Traders who rely on volume confirmation to validate trends.
4. *Multi-Timeframe Traders:*
- Traders who use higher timeframes to confirm trends on lower timeframes.
5. *Beginners:*
- Easy-to-understand visual signals and alerts make it beginner-friendly.
6. *Advanced Traders:*
- Customizable settings allow for fine-tuning to match specific strategies.
---
#### *Example Use Cases:*
1. *Long-Term Investing:*
- Use a *200-period SMA* with a *Daily* higher timeframe filter to identify long-term trends.
- Enable the *Volume Filter* to ensure trends are supported by strong volume.
2. *Swing Trading:*
- Use a *50-period EMA* with a *4-hour* higher timeframe filter for medium-term trends.
- Enable the *MACD Filter* to confirm trend reversals.
3. *Day Trading:*
- Use a *20-period HMA* with a *1-hour* higher timeframe filter for short-term trends.
- Disable the *Volume Filter* for faster signals.
---
#### *Conclusion:*
The *Trend Detection* indicator is a versatile tool for traders of all levels. Its customizable settings and advanced filters make it suitable for various trading styles and timeframes. By combining moving averages, volume analysis, and MACD filters, it provides reliable trend signals with minimal lag. Whether you're a beginner or an advanced trader, this indicator can help you make better trading decisions by identifying and confirming trends in the market.
---
#### *Publishing on TradingView:*
- *Title:* Trend Detection with Advanced Filters
- *Description:* A powerful trend detection tool using moving averages, volume analysis, and MACD filters. Suitable for all trading styles and timeframes.
- *Tags:* Trend, Moving Averages, MACD, Volume, Multi-Timeframe
- *Category:* Trend-Following
- *Access:* Public or Private (depending on your preference).
---
Let me know if you need further assistance or additional features!
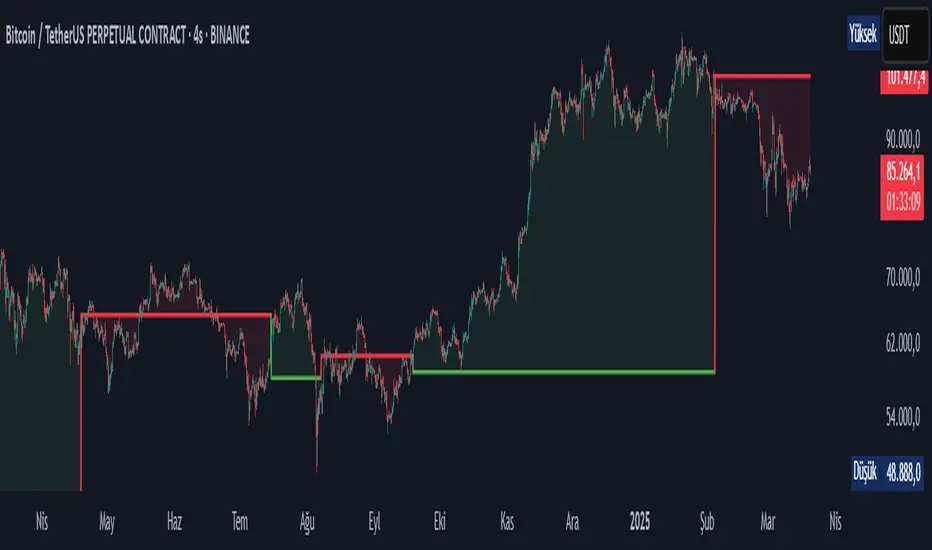
Ben Adaji Time Zone CheckerIf you are trading from Nigeria, you need to set your TradingView timezone to West Africa Time (WAT, UTC+1). This ensures that your charts, market sessions, and time-based indicators align correctly with your local time.
To set this up on TradingView:
Click on the gear icon (Chart Settings).
Navigate to the Time Zone section.
Select UTC+1:00 West Africa Time (WAT) from the list.
This adjustment helps you track market movements accurately in sync with your local trading hours.
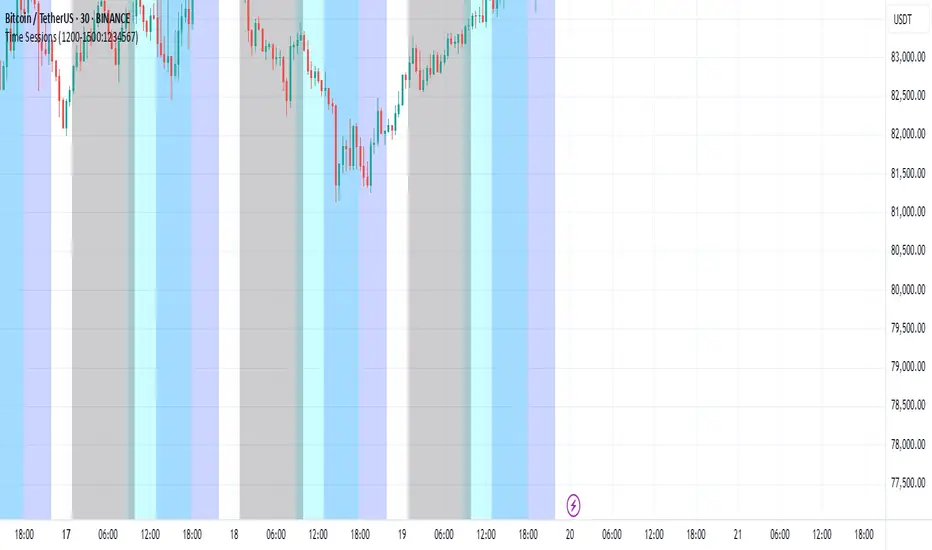
Custom Time Alert with Vertical Line📌 Detailed Explanation of the Custom Time Alert with Vertical Line in Pine Script v5
This script is a time-based alert system designed for TradingView. It allows traders to set a specific hour and minute for alerts and provides visual indicators on the chart, including a marker when the alert triggers and a vertical line at the alert time.
🔹 Main Features
Custom Alert Time → Users can specify the exact hour and minute for an alert.
Time Zone Offset Support → Users can manually adjust their local UTC offset to ensure alerts trigger at the correct time.
Real-Time Alert Condition → When the market reaches the set time, an alert notification is triggered.
Chart Visualization → A red marker appears when the alert is activated, and a blue vertical line is drawn at the alert time.
Automated Calculation → The script adjusts the alert time based on the user’s time zone settings.
🛠️ How It Works
User Input for Alert Time
The script allows users to enter their desired alert hour (0-23) and minute (0-59).
This ensures the alert triggers at the exact specified time.
Time Zone Offset Handling
Users enter their UTC offset (e.g., New York is -5, Tokyo is +9).
This ensures alerts work correctly regardless of the user’s location.
Time Calculation
The script adjusts the TradingView time by adding the time zone offset in milliseconds.
This converts the UTC-based TradingView time into the user’s local time.
Checking for a Time Match
The script constantly checks if the current hour and minute match the user-defined alert time.
If they match, the script activates an alert.
Triggering Alerts
The script uses TradingView’s alertcondition() function to create an alert.
When the time matches, TradingView sends a notification (e.g., pop-up, sound, or mobile alert).
Chart Markers for Visual Alerts
A red marker is displayed on the chart when the alert triggers.
A blue vertical line is drawn at the exact alert time.
📌 Example Use Cases
📈 1. Forex Traders Monitoring Market Opens
A forex trader who trades the London session wants an alert when the market opens at 8:00 AM UTC.
The trader sets:
Alert Hour = 8
Alert Minute = 0
Time Zone Offset = 0 (for UTC)
When the market reaches 8:00 AM UTC, the script triggers an alert.
📈 2. Stock Market Open Alerts
A trader in New York (EST) wants an alert at 9:30 AM Eastern Time (New York Stock Exchange open).
New York’s UTC offset is -5.
The trader sets:
Alert Hour = 9
Alert Minute = 30
Time Zone Offset = -5
The script ensures the alert triggers at 9:30 AM EST.
📈 3. Crypto Trader Watching a Specific Time
A crypto trader wants an alert for a specific strategy at 3:00 PM in Tokyo (UTC+9).
Tokyo’s UTC offset is +9.
The trader sets:
Alert Hour = 15
Alert Minute = 0
Time Zone Offset = +9
The script ensures the alert triggers exactly at 3:00 PM Tokyo time.