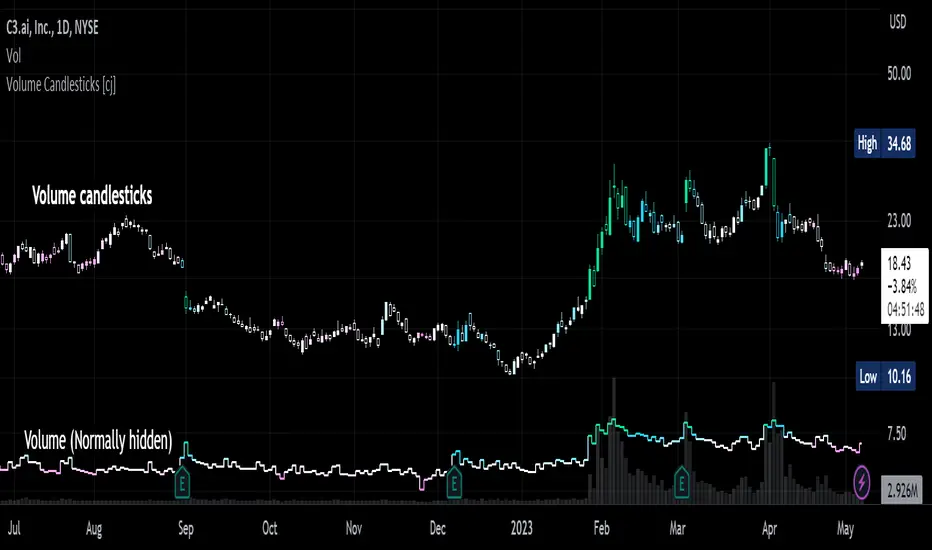
Volume Candlesticks [cajole]
This script lets you create the equivalent of "volume candlesticks" in TradingView.
"Volume candlesticks" normally vary their width according to the bar's volume. This script varies COLOUR instead of WIDTH.
Bar charts are also supported.
Candles/Bars are coloured by their distance from the average volume. You can also add a "huge volume" colour to further highlight the most extremely-high volume bars.
Note that volume is extrapolated for incomplete bars by default. So, if the average volume of the past 10 days is 5M shares, and 5M shares trade in the first 10% of today's session, that bar will be coloured as though 50M shares have traded. Set the "Extrapolate" option to 1.0 to disable this.
For this script to work properly, you should set TradingView's default candle/bar colours to be at least 20% transparent. By default, TradingView tends to overlay its own bars on top of indicators.
Nerdy details:
The script works best on a dark background, because it is easier to change the hue of white bars than of black bars. If you find a set of colours that work for white backgrounds, please comment with them!
The geometric mean is used instead of the arithmetic mean, to keep the 'average' from being strongly influenced by spikes. Bars are
then coloured by assuming a normal probability distribution and highlighting outliers. (This means that the first high-volume bars are coloured differently to later ones.)
在脚本中搜索"tradingview界面调整"
Correlation prix [SP500, TESLA, BTCBefore you see this post I want to thank all the TradingView team. Every day that passes I learn better and better to use Pine script and I owe this to all those who publish and to the philosophy of TradingView. Thanks from Amos
This trading indicator compares the prices of the S&P 500 Index (SP500), Tesla (TSLA), and Bitcoin (BTC) to find correlations between them. To make the prices of SP500 and Tesla comparable to the price of Bitcoin, the indicator multiplies the closing price of Tesla by 114 and the closing price of the S&P 500 Index by 5.6.
In this way we can superimpose the prices on the BTC chart and see what happens.
Average BTC price/ tesla price = 114, so if we multiply the tesla price by 114 times we can superimpose it on the BTC price
At average BTC/SPX price = 5.6, also in this case we multiply the price of SPX by 5.6 to overlay the graph and see any correlations.
The indicator then calculates the average price between SP500 and Tesla, using the formula (SP500 + Tesla) / 2. This calculation creates a new line on the chart that represents the average price between these two assets.
The BTC_SP_TE variable is then calculated as the average of the closing price of Bitcoin and the previously calculated average price of SP500 and Tesla, using the formula (Btc + SP_TE) / 2. This calculation creates another line on the chart that represents the average price between Bitcoin and the previously calculated average between SP500 and Tesla.
The idea behind calculating these averages is to find correlations and patterns between the prices of these assets, which can help identify potential trading opportunities. By comparing the average prices of different assets, the trader can look for trends and patterns that might not be apparent when looking at each asset individually.
The indicator plots these prices on a chart and fills the area between them with either green or fuchsia, depending on which one is higher. The strategy suggests buying Bitcoin when the average price of SP500 and Tesla is higher than the current price of Bitcoin, and selling when it is lower.
To add visual cues to the trading strategy, the indicator uses the plotchar function to display a small triangle below the chart when it detects a potential buying opportunity. This is done with the following parameters:
Value: BTC_SP_TE < Btc and Btc > Btc1 and Btc1 > Btc , which is a logical expression that checks whether the average price of SP500 and Tesla is less than the current price of Bitcoin (BTC_SP_TE < Btc), and whether the current price of Bitcoin is higher than the price 10 bars ago (Btc > Btc1 ) and higher than the price on the previous bar (Btc1 > Btc ).
Text: "Moyen BTC_SP_Te", which is the text to display inside the marker.
Symbol: "▲", which is the symbol to use for the marker. In this case, it is a small triangle pointing upwards.
Location: location.belowbar, which specifies that the marker should be placed below the bar.
I hope this is an example of how to create an indicator on TradingView, remember that correlations do not always last, it is possible that when you see the graph this correspondence no longer exists, do your studies and get inspired.

Rule Of 20 - Fair Value Estimation by Inflation & Earnings (TG)The Rule Of 20 is a heuristic calculation to find the fair value of an asset or market given its earnings and current inflation.
Its calculation is straightforward: the fair multiple of the price or price-to-earnings ratio of a stock should be 20 minus the rate of inflation.
In math terms: fair_price-to-earnings_ratio = (20 - inflation) ; fair_value = current_price * fair_price-to-earnings_ratio / real_price-to-earnings_ratio
For example, if a stock or index was trading on 11 times earnings and inflation was 2%, then the theory would be that the fair price-to-earnings ratio would be 20-2 = 18, which is much higher than the real price-to-earnings ratio of 11, and hence the asset would be undervalued.
Conversely, a market or company that was trading on 18 times price-to-earnings ration when inflation was 8% was seen as overvalued, because of the fair price-to-earnings ratio being 20-8=12, hence much lower than the real price-to-earnings ratio of 18.
We can then project the delta between the fair PE and real PE onto the asset's value to obtain the projected fair value, which may be a target of future value the asset may reach or hover around.
For example, as of 1st November 2022, SPX stood at 3871.97, with a PE ratio of 20.14 and an inflation in the US of 7.70. Using the Rule Of 20, we find that the fair PE ratio is 20-7.7=12.3, which is much lower than the current PE ratio of 20.14 by 39%! This may indicate a future possibility of a further downside risk by 39% from current valuation levels.
The origins of this rule are unknown, although the legendary US fund manager Peter Lynch is said to have been an active proponent when he was directing the Fidelity’s Magellan fund from 1977 to 1990.
For more infos about the Rule Of 20, reading this article is recommended: www.sharesmagazine.co.uk
This indicator implements the Rule Of 20 on any asset where the Financials are availble to TradingView, and also for the entire SP:SPX index as a way to assess the wider US stock market. Technically, the calculation is a bit different for the latter, as we cannot access earnings of SPX through Financials on TradingView, so we access it using the QUANDL:MULTPL/SP500_PE_RATIO_MONTH ticker instead.
By default are displayed:
current asset value in red
fair asset value according to the Rule Of 20 in white for SPX, or different shades of purple/maroon for other assets. Note that for SPX there is only one calculation, whereas for other assets there are multiple different ways to calculate earnings, so different fair values can be computed.
fair price-to-earnings ratio (PE ratio) in light grey.
real price-to-earnings ratio in darker grey.
This indicator can be used on SP:SPX ticker, and on most NASDAQ:* tickers, since they have Financials integrated in TradingView. Stocks tickers from other exchanges may not provide Financials data, so this indicator won't work then. If this happens, try to find the same ticker on NASDAQ instead.
Note that by default, only the US stock market is considered. If you want to consider stocks or assets in other regions of the world, please change the inflation ticker to a ticker that reflect the target region's inflation.
Also adding a table to ease interpretation was considered, but then the Timeframe MTF parameter would not work, and since the big advantage of this indicator is to allow for historical comparisons, the table was dropped.
Enjoy, and keep in mind that all models are wrong, but some are useful.
Trade safely!
TG

Regression Channel, Candles and Candlestick Patterns by MontyRegression Candles by ugurvu
Regression Channel by Tradingview
All Candlestick Patterns By Tradingview
This script was combined for a friend of mine who needed this.
This Script has regression candles by ugurvu, Regression channel and Candlestick patterns by tradingview.
The intention was to fuse these together so more information can be processed on the cost of a single indicator.

Real Woodies CCIAs always, this is not financial advice and use at your own risk. Trading is risky and can cost you significant sums of money if you are not careful. Make sure you always have a proper entry and exit plan that includes defining your risk before you enter a trade.
Ken Wood is a semi-famous trader that grew in popularity in the 1990s and early 2000s due to the establishment of one of the earliest trading forums online. This forum grew into "Woodie's CCI Club" due to Wood's love of his modified Commodity Channel Index (CCI) that he used extensively. From what I can tell, the website is still active and still follows the same core principles it did in the early days, the CCI is used for entries, range bars are used to help trader's cut down on the noise, and the optional addition of Woodie's Pivot Points can be used as further confirmation of support and resistance. This is my take on his famous "Woodie's CCI" that has become standard on many charting packages through the years, including a TradingView sponsored version as one of the many stock indicators provided by TradingView. Woodie has updated his CCI through the years to include several very cool additions outside of the standard CCI. I will have to say, I am a bit biased, but I think this is hands down one of the best indicators I have ever used, and I am far too young to have been part of the original CCI Club. Being a daytrader primarily, this fits right in my timeframe wheel house. Woodie designed this indicator to work on a day-trading time scale and he frequently uses this to trade futures and commodity contracts on the 30 minute, often even down to the one minute timeframe. This makes it unique in that it is probably one of the only daytrading-designed indicators out there that I am aware of that was not a popular indicator, like the MACD or RSI, that was just adopted by daytraders.
The CCI was originally created by Donald Lambert in 1980. Over time, it has become an extremely popular house-hold indicator, like the Stochastics, RSI, or MACD. However, like the RSI and Stochastics, there are extensive debates on how the CCI is actually meant to be used. Some trade it like a reversal indicator, where values greater than 100 or less than -100 are considered overbought or oversold, respectively. Others trade it like a typical zero-line cross indicator, where once the value goes above or below the zero-line, a trade should be considered in that direction. Lastly, some treat it as strictly a momentum indicator, where values greater than 100 or less than -100 are seen as strong momentum moves and when these values are reached, a new strong trend is establishing in the direction of the move. The CCI itself is nothing fancy, it just visualizes the distance of the closing price away from a user-defined SMA value and plots it as a line. However, Woodie's CCI takes this simple concept and adds to it with an indicator with 5 pieces to it designed to help the trader enter into the highest probability setups. Bear with me, it initially looks super complicated, but I promise it is pretty straight-forward and a fun indicator to use.
1) The CCI Histogram. This is your standard CCI value that you would find on the normal CCI. Woodie's CCI uses a value of 14 for most trades and a value of 20 when the timeframe is equal to or greater than 30minutes. I personally use this as a 20-period CCI on all time frames, simply for the fact that the 20 SMA is a very popular moving average and I want to know what the crowd is doing. This is your coloured histogram with 4 colours. A gray colouring is for any bars above or below the zero line for 1-4 bars. A yellow bar is a "trend bar", where the long period CCI has been above/below the zero line for 5 consecutive bars, indicating that a trend in the current direction has been established. Blue bars above and red bars below are simply 6+n number of bars above or below the zero line confirming trend. These are used for the Zero-Line Reject Trade (explained below). The CCI Histogram has a matching long-period CCI line that is painted the same colour as the histogram, it is the same thing but is used just to outline the Histogram a bit better.
2) The CCI Turbo line. This is a sped-up 6 period CCI. This is to be used for the Zero-Line Reject trades, trendline breaks, and to identify shorter term overbought/oversold conditions against the main trend. This is coloured as the white line.
3) The Least Squares Moving Average Baseline (LSMA) Zero Line. You will notice that the Zero Line of the indicator is either green or red. This is based on when price is above or below the 25-period LSMA on the chart. The LSMA is a 25 period linear regression moving average and is one of the best moving averages out there because it is more immune to noise than a typical MA. Statistically, an LSMA is designed to find the line of best fit across the lookback periods and identify whether price is advancing, declining, or flat, without the whipsaw that other MAs can be privy to. The zero line of the indicator will turn green when the close candle is over the LSMA or red when it is below the LSMA. This is meant to be a confirmation tool only and the CCI Histogram and Turbo Histogram can cross this zero line without any corresponding change in the colour of the zero line on that immediate candle.
4) The +100 and -100 lines are used in two ways. First, they can be used by the CCI Histogram and CCI Turbo as a sort of minor price resistance and if the CCI values cannot get through these, it is considered weakness in that trade direction until they do so. You will notice that both of these lines are multi-coloured. They have been plotted with the ChopZone Indicator, another TradingView built-in indicator. The ChopZone is a trend identification tool that uses the slope and the direction of a 34-period EMA to identify when price is trending or range bound. While there are ~10 different colours, the main two a trader needs to pay attention to are the turquoise/cyan blue, which indicates price is in an uptrend, and dark red, which indicates price is in a downtrend based on the slope and direction of the 34 EMA. All other colours indicate "chop". These colours are used solely for the Zero-Line Reject and pattern trades discussed below. They are plotted both above and below so you can easily see the colouring no matter what side of the zero line the CCI is on.
5) The +200 and -200 lines are also used in two ways. First, they are considered overbought/oversold levels where if price exceeds these lines then it has moved an extreme amount away from the average and is likely to experience a pullback shortly. This is more useful for the CCI Histogram than the Turbo CCI, in all honesty. You will also notice that these are coloured either red, green, or yellow. This is the Sidewinder indicator portion. The documentation on this is extremely sparse, only pointing to a "relationship between the LSMA and the 34 EMA" (see here: tlc.thinkorswim.com). Since I am not a member of Woodie's CCI Club and never intend to be I took some liberty here and decided that the most likely relationship here was the slope of both moving averages. Therefore, the Sidewinder will be green when both the LSMA and the 34 EMA are rising, red when both are falling, and yellow when they are not in agreement with one another (i.e. one rising/flat while the other is flat/falling). I am a big fan of Dr. Alexander Elder as those who follow me know, so consider this like Woodie's version of the Elder Impulse System. I will fully admit that this version of the Sidewinder is a guess and may not represent the real Sidewinder indicator, but it is next to impossible to find any information on this, so I apologize, but my version does do something useful anyways. This is also to be used only with the Zero-Line Reject trades. They are plotted both above and below so you can easily see the colouring no matter what side of the zero line the CCI is on.
How to Trade It According to Woodie's CCI Club:
Now that I have all of my components and history out of the way, this is what you all care about. I will only provide a brief overview of the trades in this system, but there are quite a few more detailed descriptions listed in the Woodie's CCI Club pamphlet. I have had little success trading the "patterns" but they do exist and do work on occasion. I just prefer to trade with the flow of the markets rather than getting overly scalpy. If you are interested in these patterns, see the pamphlet here (www.trading-attitude.com), hop into the forums and see for yourself, or check out a couple of the YouTube videos.
1) Zero line cross. As simple as any other momentum oscillator out there. When the long period CCI crosses above or below the zero line open a trade in that direction. Extra confirmation can be had when the CCI Turbo has already broken the +100/-100 line "resistance or support". Trend traders may wish to wait until the yellow "trend confirmation bar" has been printed.
2) Zero Line Reject. This is when the CCI Turbo heads back down to the zero line and then bounces back in the same direction of the prevailing trend. These are fantastic continuation trades if you missed the initial entry either on the zero line cross or on the trend bar establishment. ZLR trades are only viable when you have the ChopZone indicator showing a trend (turquoise/cyan for uptrend, dark red for downtrend), the LSMA line is green for an uptrend or red for a downtrend, and the SideWinder is either green confirming the uptrend or red confirming the downtrend.
3) Hook From Extreme. This is the exact same as the Zero Line Reject trade, however, the CCI Turbo now goes to the +100/-100 line (whichever is opposite the currently established trend) and then hooks back into the established trend direction. Ideally the HFE trade needs to have the Long CCI Histogram above/below the corresponding 100 level and the CCI Turbo both breaks the 100 level on the trend side and when it does break it has increased ~20 points from the previous value (i.e. CCI Histogram = +150 with LSMA, CZ, and SW all matching up and trend bars printed on CCI Histogram, CCI Turbo went to -120 and bounced to +80 on last 2 bars, current bar closes with CCI Turbo closing at +110).
4) Trend Line Break. Either the CCI Turbo or CCI Histogram, whichever you prefer (I find the Turbo a bit more accurate since its a faster value) creates a series of higher highs/lows you can draw a trend line linking them. When the line breaks the trendline that is your signal to take a counter trade position. For example, if the CCI Turbo is making consistently higher lows and then breaks the trendline through the zero line, you can then go short. This is a good continuation trade.
5) The Tony Trade. Consider this like a combination zero line reject, trend line break, and weak zero line cross all in one. The idea is that the SW, CZ, and LSMA values are all established in one direction. The CCI Histogram should be in an established trend and then cross the zero line but never break the 100 level on the new side as long as it has not printed more than 9 bars on the new side. If the CCI Histogram prints 9 or less bars on the new side and then breaks the trendline and crosses back to the original trend side, that is your signal to take a reversal trade. This is best used in the Elder Triple Screen method (discussed in final section) as a failed dip or rip.
6) The GB100 Trade. This is a similar trade as the Tony Trade, however, the CCI Histogram can break the 100 level on the new side but has to have made less than 6 bars on the new side. A trendline break is not necessary here either, it is more of a "pop and drop" or "momentum failure" trade trying in the new direction.
7) The Famir Trade. This is a failed CCI Long Histogram ZLR trade and is quite complicated. I have never traded this but it is in the pamphlet. Essentially you have a typical ZLR reject (i.e. all components saying it is likely a long/short continuation trade), but the ZLR only stays around the 50 level, goes back to the trend side, fails there as well immediately after 1 bar and then rebreaks to the new side. This is important to be considered with the LSMA value matching the side of the trade, so if the Famir says to go long, you need the LSMA indicator to also say to go long.
8) The Vegas Trade. This is essentially a trend-reversal trade that takes into account the LSMA and a cup and handle formation on the CCI Long Histogram after it has reached an extreme value (+200/-200). You will see the CCI Histogram hit the extreme value, head towards the zero line, and then sort of round out back in the direction of the extreme price. The low point where it reversed back in the direction of the extreme can be considered support or resistance on the CCI and once the CCI Long Histogram breaks this level again, with LSMA confirmation, you can take a counter trend trade with a stop under/over the highest/lowest point of the last 2 bars as you want to be out quickly if you are wrong without much damage but can get a huge win if you are right and add later to the position once a new trade has formed.
9) The Ghost Trade. This is nothing more than a(n) (inverse) head and shoulders pattern created on the CCI. Draw a trend line connecting the head and shoulders and trade a reversal trade once the CCI Long Histogram breaks the trend line. Same deal as the Vegas Trade, stop over/under the most recent 2 bar high/low and add later if it is a winner but cut quickly if it is a loser.
Like I said, this is a complicated system and could quite literally take years to master if you wanted to go into the patterns and master them. I prefer to trade it in a much simpler format, using the Elder Triple Screen System. First, since I am a day trader, I look to use the 20 period Woodie's on the hourly and look at the CZ, SW, and LSMA values to make sure they all match the direction of the CCI Long Histogram (a trend establishment is not necessary here). It shows you the hourly trend as your "tide". I then drill down to the 15 minute time frame and use the Turbo CCI break in the opposite direction of the trend as my "wave" and to indicate when there is a dip or rip against the main trend. Lastly, I drill down to a 3 minute time frame and enter when the CCI Long Histogram turns back to match the main trend ("ripple") as long as the CCI Turbo has broken the 100 level in the matched direction.
Enjoy, and please read the pamphlet if you have any questions about the patterns as they are not how I use these and will not be able to answer those questions.

Scrolling WatermarkThis is an improvement on the watermark published by TradingView.
Along with displaying a little bit of text on the corner of your chart, this text scrolls from left to right, or right to left! You choose!
This functionality works on all live charts. It will not scroll if the chart is currently inactive. :(
Even though this is based on the indicator by TradingView This script uses entirely original code and method developed by myself.
"Do keep in mind that if you use it when publishing ideas, videos or scripts, House Rules prohibit advertising on your chart." -Watermark by TradingView

Volume Pace & Pressure TableHave you ever wanted to know if a particular tickers volume is above or below average while still in the trading day? This indicator displays an easy-to-read table that informs the user exactly what is occurring in intraday volume. And a whole lot more!
Description
This indicator displays a variable table with either two or three columns and always three rows. It packs everything a user needs to know about volume in one small table. The table shows:
Current trading days volume
Average daily volume
Volume Pace
Volume Pressure (Buying & Selling)
Volume Pace
Volume Pace is a mathematical calculation invented by the author, Infinity_Trading . The problem was to figure out a way to know if the current days volume was below average or above average while still in the trading day. Calculations like Percent Daily Volume don’t work during the intraday trading hours. For example, say SPY has a 20-day volume average of 100 million shares. If in the first hour SPY has only traded 10 million shares then dividing the current volume into the average daily volume doesn’t tell the user anything when there is still 5.5 hours of trading left in the trading day. There had to be a better way! The solution was to chop up the trading day into evenly divisible time periods (i.e. <= 30 minutes). The Volume Pace algorithm takes the average daily volume and chops it up into small time periods based upon the charts current timeframe. This is the average volume per smaller time period. Then use the current days volume and the number of time periods that have occurred in the trading day so far (at the current moment in time i.e. the current candlestick) to form a calculation that returns the volume above or below the average volume up to that point in time.
Volume Pace Equations
Intraday Vol. Pace = Today’s Current Vol. - ( ( Average Daily Vol. / Time periods in trading day ) * Time periods that have occurred so far in trading day )
Postday Vol. Pace = Today’s Trading Vol. - Average Daily Vol.
^ Vol. = Volume (because TradingViews pine tags are dumb)
Volume Pace Definitions
Volume Pace is the difference in cumulative volume between todays current volume and the average daily volume up to same time of the day
Volume Pace Usage
If the Volume Pace is a positive number then it means that up to the current trading time the volume is that amount greater than the average daily volume over that same intraday time span.
If the Volume Pace is a negative number then it means that up to the current trading time the volume is that amount smaller than the average daily volume over that same intraday time span.
If the Volume Pace is positive during the intraday then the volume is on track to be an above average volume trading day.
If the Volume Pace is negative during the intraday then the volume is on track to be a below average volume trading day.
The Percent Volume Pace is the percent increase or decrease of the current volume compared to the average volume up to the same time of day. Or the Percent Volume Pace is the Volume Pace expressed as a percentage.
After the trading day is complete the Volume Pace will be the difference between the Daily Volume and the Average Daily Volume. And the same thing applies to the Percent Volume Pace.
Volume Pressure
The author, Infinity_Trading, did not invent the calculations for Volume Pressure but the definitions and explanations of Volume Pressure are their own creations. In specific terms, Volume Pressure is a mathematical calculation that uses the direction and distances of individual candlesticks bodies and wicks to assign a numerical value to volume.
buyingPressure = vol * (close - low) / (high - low)
sellingPressure = vol * (high - close) / (high - low)
^ vol = Volume (because TradingViews pine tags are dumb)
The author wants to make clear that volume “pressure” isn’t a real thing. Trades in any market require a buyer and a seller. So there is always an equal number of buyers and sellers. Thus, the idea that there are more buyers or more sellers isn’t rooted in reality. BUT the author believes that the calculation and understanding of “volume pressure” takes a very complex subject (price moment in a market) and condenses into something that intuitively makes sense to humans (pressure) and places it onto something that is already on everyone’s charts (volume bars).
The calculation for Buying Pressure is really calculating the upward distance between the low and the close of the candle. While Selling Pressure is measuring the downward distance from the high to the close. And both are using volume bars to express these measurements. So if an individual candle goes down then the red Selling Pressure will be more on the stacked bar chart than the green Buying Pressure. And vice versa for candles that went up. If a Volume Pressure bar is completely one color then it means, for a downward candle, the low and close were equivalent, and for an upward candle, the high and the close were the same. Lastly, the Buying & Selling Pressure will always add up to 100%.
Inputs and Style
In the Input section the user can set the number of days to use for all of the average calculations. All aspects of the table can be controlled. The background color, text color, border widths, and border colors. Also, the table can be moved to 9 unique locations around the chart for complete user control. Also, the user can use their cursor to hover over each cell in the table to reveal a tooltip definition of the calculation in the cell.
Special Notes
The volume table won’t display when the chart timeframe is weekly or monthly because the logic uses “daily” volume.
The Volume Pace column in the table disappears when the timeframe is greater than 30 minutes. Because for Volume Pace to work the time periods must be equally divisible into 6.5 hours (the duration of trading day).

Fib RSI++ by [JohnnySnow]Fib RSI++ by is an RSI Inspired by my absolutely favorite RSI on tradingview: RSI & EMA with Reverse Calculator Panel by balipour.
Built for quicker and easily identify prices at current RSI /possibly reversals/ RSI direction and RSI landings.
From balipour, I reuse /adapt to pinescriptV5 3 lines of code ( ) - the balipour implementation for reversing RSI formula in order to calculate price estimation based on the Given RSI level. Credits to the author.
Inspired by it, I also combine RSI with a MA but tuned to reads better the support/resistance levels (my humble opinion).
For quicker price target identification 2 features were added:
- Gridlines based on Fib levels, standard overbought/oversold levels and other levels I personally use. All of the grid lines can be configured according to user preferences.
- 2 information tables:
--First with a collection of 'close' numbers and Fib RSI levels price estimations at given RSI
--The second table allows the user to add up to 3 custom RSI levels to further target the price estimation.
Author UI Preferences to be used with this indicator: dark theme, hidden vertical and horizontal chart gridlines.

Multi-timeframe MAs + Stoch RSI SignalsHello traders,
I welcome you to my first published script on TradingView: “Multi-timeframe Moving Averages + Stochastic RSI”.
The script is based on a simple formula: Buy signals are generated when a fast moving average is above a slower moving average (uptrend) and the Stochastic RSI K line is crossing above the oversold level (entry).
Sell signals are generated when a fast moving average is below a slower moving average (downtrend) and the Stochastic RSI K line is crossing below the overbought level (entry).
This indicator works best in strong trends!
**Please note the above example has repainting turned on which may produce unrealistic results when viewing historical data. See below for more information regarding this and how you can turn it off.**
The user has the following inputs:
- Option to change the Stochastic RSI settings, including the oversold and overbought levels.
- Option to enter any value for both the Fast Moving Average and the Slow Moving Average.
- Option to change between EMA or SMA for each moving average.
- Multiple time frames to choose from, as well as the ability to selectively turn off individual time frames (both plots and alerts).
(Default time frames are 1 hour, 4 hour, and Daily. You can have a 4th time frame by changing your current time frame to something lower than the other 3 time frames)
- Turn on/off repainting: If repainting is turned on you will get an alert and buy/sell signal on chart immediately when condition is met, however the signal may disappear from chart if the condition reverses during the same candle.
If repainting is turned off, the indicator will wait for the candle to close before issuing the alert and painting the signal on chart.
For higher time frames, the indicator will wait for the candle in the higher time frame to close before issuing a signal if repaint is turned off. Default is set to Repaint on, so please be aware of this if you do not want repainting.
How to use alerts:
- Before you do anything, make sure your current time frame is the lowest time frame you’d like alerts on, as you will still receive alerts for the higher time frames you selected in settings.
- Once you have all the settings changed to how you like, save your chart first. Then right click on any of the indicator’s buy/sell signals on the chart and click “Add Alert on MAs + Stoch RSI”.
- Make sure “Any alert() function call” is selected under the Condition.
- You can delete or change the text in “Alert name” if you want as the alert message is already built into the indicator, and it will tell you in the alert message which asset and time frame to buy or sell.
Other things to note:
- The indicator will not display the buy/sell signals of lower time frames when you are on a higher time frame. This was done purposely to reduce clutter on the chart when you switch to higher time frames.
- While the alert message will tell you which time frame a signal was generated, the plots on the chart will instead show “Buy/Sell TF1, or TF2, or TF3”.
If the signal is from the current time frame that the alert was created on, then it will simply show “Buy” or “Sell”.
Hope you guys enjoy using this one, please drop a like if you found it useful. If anyone wants to modify my script in any way, please just credit me for the original work when you publish the script. Good luck!

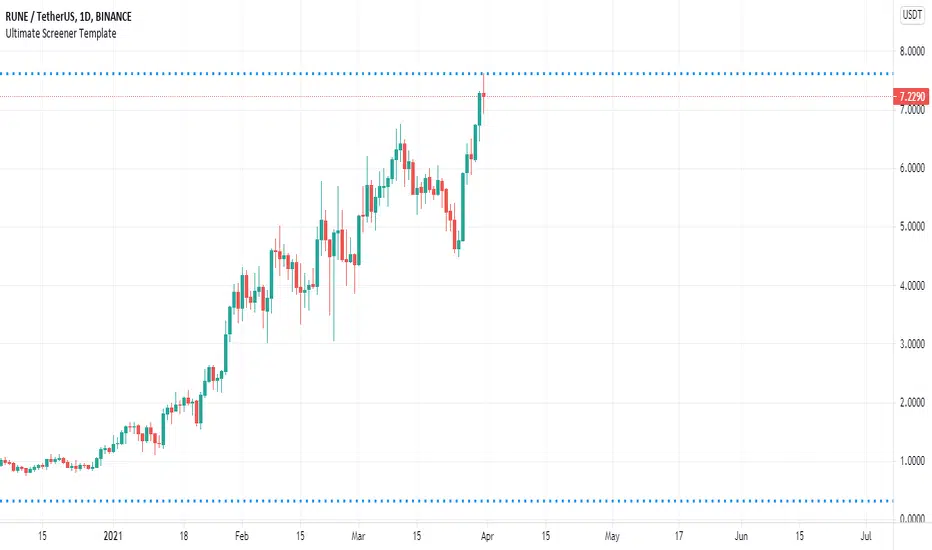
Ultimate Screener TemplateHello Traders
With the Ultimate Strategy Template , I shared a template to connect any indicator to this template and get backtesting results in less than a few minutes
Now sharing another template ... many traders ask me to develop for them a screener/scanner based on a custom indicator on TradingView.
The current TradingView screeners are great but don't allow for much customization; as we can only select pre-defined filters
I don't know when we'll be able to natively screen among hundreds of assets with a custom indicator... then.... I created this template for the time being.... which should
A whole new world
The Ultimate Screener Template screens over 38 securities.
What's very cool is that you'll only need to create 1 alert to scan over 38 securities: Explanation with this image here
I totally understand that not all TradingView accounts have a lot of alarms; with this template, you can multiply the number of custom alerts you're initially allowed to.
What if I need to set alerts on more than 38 securities?
Pretty straightforward... you can create alerts only if the indicator is added to your chart first.
So if you need let's say 100 securities, add this indicator 3 times on your chart (38*3 > 100) and then... edit the securities for your 3 indicators
How to update your Screener settings
Alert mode
As per Pinescript reference , this template allows setting the alert frequency
Possible values are:
- alert.freq_all (all function calls trigger the alert)
- alert.freq_once_per_bar (the first function call during the bar triggers the alert)
- alert.freq_once_per_bar_close (the function call triggers the alert only when it occurs during the last script iteration of the real-time bar when it closes).
All-time-high and All-time-low
This template shows how to capture ATH and ATL alerts across many securities
I used the functions from Quantnomad:
Whenever a new ATH or ATL is made, the screener will send a personalized alarm with a personalized text based on the security triggering this alarm
The code is pretty straightforward and shows you the part you'll need to update to transform your favorite custom indicator into a powerful screener.
If anything is unclear in the code, please leave a comment and I'll respond as soon as possible
All the best
Dave
Flawless Victory Strategy - 15min BTC Machine Learning StrategyHello everyone, I am a heavy Python programmer bringing machine learning to TradingView. This 15 minute Bitcoin Long strategy was created using a machine learning library and 1 year of historical data in Python. Every parameter is hyper optimized to bring you the most profitable buy and sell signals for Bitcoin on the 15min chart. The historical Bitcoin data was gathered from Binance API, in case you want to know the best exchange to use this long strategy. It is a simple Bollinger Band and RSI strategy with two versions included in the tradingview settings. The first version has a Sharpe Ratio of 7.5 which is amazing, and the second version includes the best stop loss and take profit positions with a Sharpe Ratio of 2.5 . Let me talk a little bit more about how the strategy works. The buy signal is triggered when close price is less than lower Bollinger Band at Std Dev 1, and the RSI is greater than a certain value. The sell signal is triggered when close price is greater than upper Bollinger Band at Std Dev 1, and the RSI is greater than a certain value. What makes this strategy interesting is the parameters the Machine Learning library found when backtesting for the best Sharpe Ratio. I left my computer on for about 28 hours to fully backtest 5000 EPOCHS and get the results. I was able to create a great strategy that might be one of TradingView's best strategies out on the website today. I will continue to apply machine learning to all my strategies from here on forward. Please Let me know if you have any questions or certain strategies you would like me to hyper optimize for you. I'm always willing to create profitable strategies!
P.S. You can always pyramid this strategy for more gains! I just don't add pyramiding when creating my strategies because I want to show you the true win/loss ratio based buying one time and one selling one time. I feel like when creating a strategy that includes pyramiding right off the bat falsifies the win rate. This is my way of being transparent with you all. Have fun trading!

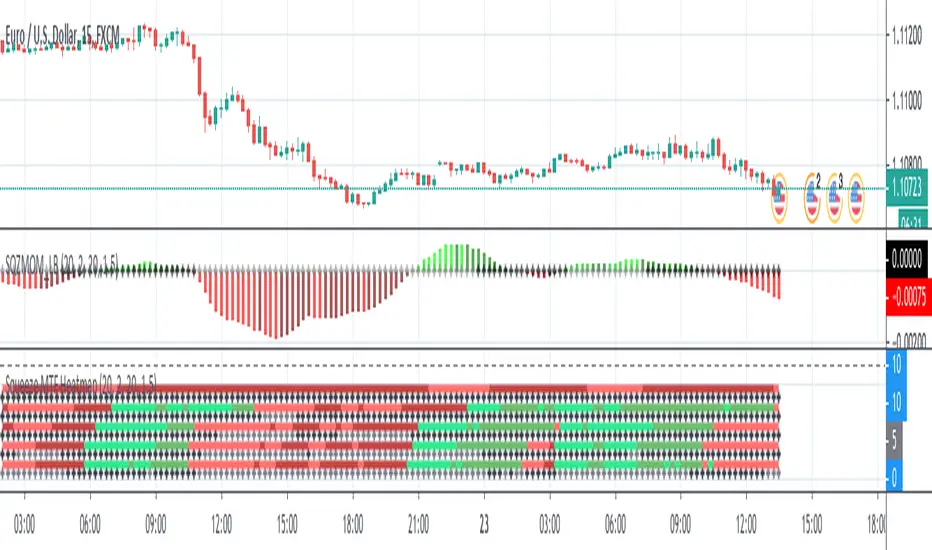
Squeeze MTF HeatmapHere is a multi-timeframe heat map using one of the most apreciated indicators in Tradingview: Squeeze Momentum Indicator by LazyBear.
Study shall be added to 15min chart.
It indicates squeeze and momentum at: 15 min, 30 min, 60 min, 240 min and 1 Day.
Thanks to © azimuthdynamics for inspiration and portion of code
Thanks to Lazy Bear for coding Squeeze Momentum Indicator
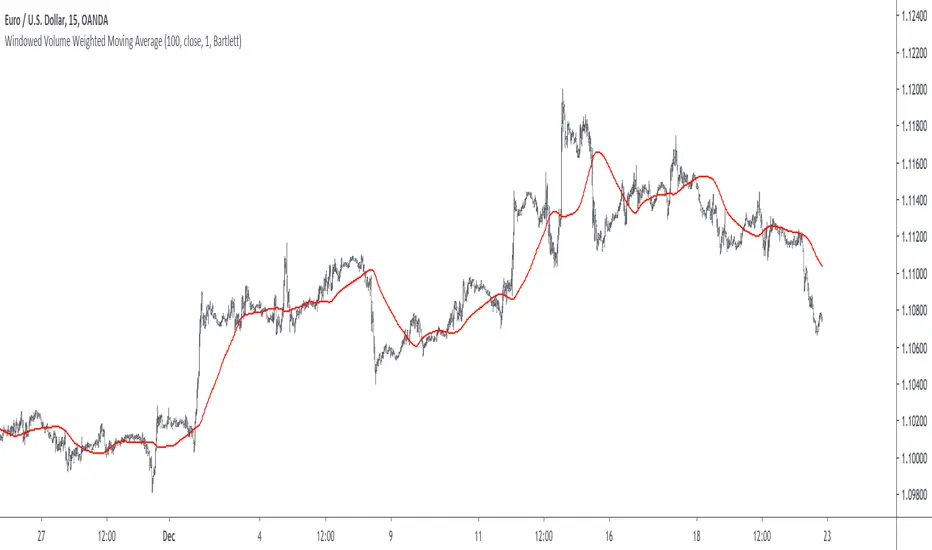
Windowed Volume Weighted Moving AverageIntroduction
The concept of windowing was briefly introduced in the Blackman filter post, however windowing is more than just some window functions, and isn't exclusively used in filter design.
Today we will use windowing with the volume weighted moving average, a moving average that weight the price with volume in order to be more reactive when volume is high, that is the moving average is more reactive when the market is more active. The use of windowing in the vwma allow to enhance its performance in the frequency domain which result in a smoother output.
Note that i made a similar indicator long ago, but at that time I was not great at all with math and pinescript in general and the indicator was therefore wrong, i want to remind to the community that i'am not a professional, only an enthusiast, I never claimed to be a master coder and i'am totally open to receive criticism, if I sounded like bragging in the past I apologize, at 20 years old it is still easy to act like a kid, the information contained in my posts is only shared in order to help others but also myself, since sharing is also a way to learn more effectively. That said lets go with the indicator.
Windowing
Windowing consist on applying a window function to a signal, by applying i mostly talk about multiplying, this process is mostly used with windowed sinc filters in order to reduce ripples in the pass/stop band, but can be used with any kind of filters in order to have better frequency domain performance, the only thing we need to do is to multiply the filter weights by a window function.
In order to understand windowing it is useful to visualize this process and understand spectral leakage. Remember that we can describe a signal as the sum of sine/cosine waves of different frequencies, amplitude and phase, leakage is an effect that appear with signals having discontinuities, that is when a signal non periodic.
This figure show a non periodic sine wave of frequency 0.1, a non periodic signal will have is last sample value different from its first sample value, if we where to do its fourier transform we wouldn't end up with a single bin at 0.1 but with more bins, this is spectral leakage, the discontinuities in the signal create additional frequency components. In order to reduce leakage we must make the signal approximately periodic, this is done by making use of window functions.
A window function is symmetric and relatively smooth, all we have to do is to multiply our first non periodic signal with the window function.
We end up with the following windowed signal :
The signal is approximately periodic and leakage has been reduced. Now that we have seen that, it might be useful to see why it is useful in filters.
Remember that the Fourier transform of the filter weights gives us its frequency response, if our weights introduce leakage we end up with ripples, so windowing the filter weights might help reduce the ripples in the frequency response, which result in a smoother filter output.
Volume Weighted Moving Average
A volume weighted moving average is a FIR filter who use volume as filter kernel, therefore the frequency response of this filter always change, it is therefore not wrong to qualify the vwma as an adaptive moving average. Higher volume mean higher weighting of the current closing price value, which therefore produce a more reactive output.
However the smoothness of the moving average is relatively poor.
Windowed Volume Weighted Moving Average
The proposed moving average has a length setting who control the moving average period, and various options that we will describe below. The first option is the type of window, there are many windows, certains more complex than others, here 3 windows are proposed, the famous Blackman window, the Bartlett, and finally the Hanning window, they provide each different level of smoothness. lets compare our moving average with period 100 with a vwma of the same period.
Our moving average in red, and the vwma in blue. As you can see the results are smoother.
The power parameter is used in order to give an even higher weighting to closing prices with high volume, this create a more boxy output. Below is a comparison with a vwma in blue and a powered vwma in red with power = 2 without windowing :
We can then apply a window, here i will choose the Blackman window :
Conclusion
A new moving average based on windowed volume weighting has been proposed. The result are smoother which might therefore reduce whipsaw trades. I wish i could have explained things better, unfortunately windowing isn't something i use much, i wanted to post this moving average earlier this year.
I will be off in France for 1 week, my flight is tomorrow in the morning, therefore i don't think i'll have the possibility to make other posts this year. I want to profit from this occasion to review my year in tradingview.
Many indicators have been posted, some being extremely bad and others really interesting, this year introduced my attempts on estimating the lsma efficiently, the linear channels, an attempt on making lines and remain the first indicator from the v4 i posted if i'am right. Then came the efficient auto-line, who gained some popularity quite fast. Then finally the %G oscillator and the recursive bands where posted, and remain some of the favorites indicators i made. I also wanted to leave this year due to studies, that i totally abandoned, i'am thankful that i chosen to stay.
I also want to express my apologies to any member that i could have offended, i think that i'am not a mean person but i certainly not contest the fact that i'am clumsy, even in my work, however my clumsiness is far greater when it comes to interact with other peoples or a group of peoples, i don't want to hurt anyone, if i made anything that made you feel bad then i'am sincerely sorry, and hope we can start this new year from 0.
Finally i thank the tradingview community for their interest and curiosity, i thank all the great coders who work on making pinescript a better scripting language, i also thank the tradingview staff for their work this year. I wish you all a merry christmas, and an happy new year.
Thanks for reading.
Peak Valley Estimation StrategyIntroduction
Its the first strategy that i post here, so don't expect ground breaking stuff, when testing my indicators i always used prorealtime and not tradingview. This strategy use signals generated by the peak/valley estimator indicator i posted long ago, i think the signals generated where sometimes quite accurate in some markets thus providing potential material for a profitable strategy.
The indicator use 3 parameters, therefore the optimisation process is not easy, but i selected what i judged good parameters values at first glance. The strategy is in its more simple form without stop or anything, the detection of peaks and valley can allow for tighter stops since we expect the price to reverse, but take into account that sops and take profits are parameters subject to optimization process except if selected with strict money management rules and not profit optimization.
Of course trading the strategy in this form is far from being great, if we take into account the market non stationarity then we might expect loss during trending markets. Trend strength indicators could help switch from a reversal to breakout strategy thus maybe providing more control.
I really hope you find an use for the strategy.
Notes
Its been three long years since i started tradingview, and i put more efforts in my indicators than in my studies and life overall, this have created complicated situations and i can't afford to follow up with this, therefore i announce that in the end of june i will leave tradingview for quite a long time, at least until i have my degree. I announce it in advance in case some of you want helps of any kind. I will post all the indicators, both in progress and finished i have made during those three years. I hope you can all understand.
Thanks for reading !

Compare CandlesShows the candles of a specified EXCHANGE:PAIR in an indicator without overlay.
Has the following advantages over the standard comparison in TradingView:
- The compared pair is below your main chart.
- You can see the price of the compared pair.
- You can add multiple compared pairs and all of them will be shown in their own space with their own price.

Super Guppy LogGeometric mean is introduced to the moving averages better capture parabolic, long lasting trends.
Options to plot hlc3 of price, switch off log, and switch to Hull MA.
How to trade Guppy: www.investopedia.com
Original Guppy by ChrisMoody:
Super Guppy by FritzMurphy:
Log-space ideas by fskrypt: tradingview.com/u/fskrypt
Log-space EMAs:
Regular EMAs:

CM Stochastic POP Method 1 - Jake Bernstein_V1A good friend ucsgears recently published a Stochastic Pop Indicator designed by Jake Bernstein with a modified version he found.
I spoke to Jake this morning and asked if he had any updates to his Stochastic POP Trading Method. Attached is a PDF Jake published a while back (Please read for basic rules, which also Includes a New Method). I will release the Additional Method Tomorrow.
Jake asked me to share that he has Updated this Method Recently. Now across all symbols he has found the Stochastic Values of 60 and 30 to be the most profitable. NOTE - This can be Significantly Optimized for certain Symbols/Markets.
Jake Bernstein will be a contributor on TradingView when Backtesting/Strategies are released. Jake is one of the Top Trading System Developers in the world with 45+ years experience and he is going to teach how to create Trading Systems and how to Optimize the correct way.
Below are a few Strategy Results....Soon You Will Be Able To Find Results Like This Yourself on TradingView.com
BackTesting Results Example: EUR-USD Daily Chart Since 01/01/2005
Strategy 1:
Go Long When Stochastic Crosses Above 60. Go Short When Stochastic Crosses Below 30. Exit Long/Short When Stochastic has a Reverse Cross of Entry Value.
Results:
Total Trades = 164
Profit = 50, 126 Pips
Win% = 38.4%
Profit Factor = 1.35
Avg Trade = 306 Pips Profit
***Most Consecutive Wins = 3 ... Most Consecutive Losses = 6
Strategy 2:
Rules - Proprietary Optimization Jake Will Teach. Only Added 1 Additional Exit Rule.
Results:
Total Trades = 164
Profit = 62, 876 Pips!!!
Win% = 38.4%
Profit Factor = 1.44
Avg Trade = 383 Pips Profit
***Most Consecutive Wins = 3 ... Most Consecutive Losses = 6
Strategy 3:
Rules - Proprietary Optimization Jake Will Teach. Only added 1 Additional Exit Rule.
Results:
Winning Percent Increases to 72.6%!!! , Same Amount of Trades.
***Most Consecutive Wins = 21 ...Most Consecutive Losses = 4
Indicator Includes:
-Ability to Color Candles (CheckBox In Inputs Tab)
Green = Long Trade
Blue = No Trade
Red = Short Trade
-Color Coded Stochastic Line based on being Above/Below or In Between Entry Lines.
Link To Jakes PDF with Rules
dl.dropboxusercontent.com

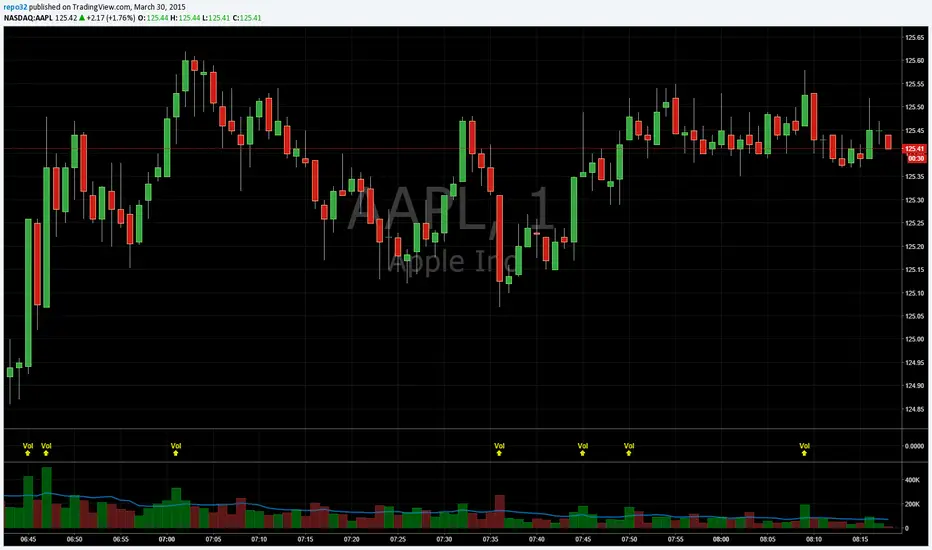
Volume BombI am republishing to use a clean chart. Previous one had too much of a mess. Idea for TradingView: Please allow us to change out the charts after publishing.
I like to know when volume spikes (only when it spikes). I am not interested in seeing the rest of the volume bars. I created this indicator to show me when it explodes (i.e. the name "Volume Bomb" , plus it sounds cool).
This indicator only shows you when volume exceeds the EMA of volume by whatever multiplier you set.
Default settings are the current volume with 10 EMA. Yellow arrowup will appear when volume is at 1.5x the 10 EMA.
Adjust it to your liking and particular stock.
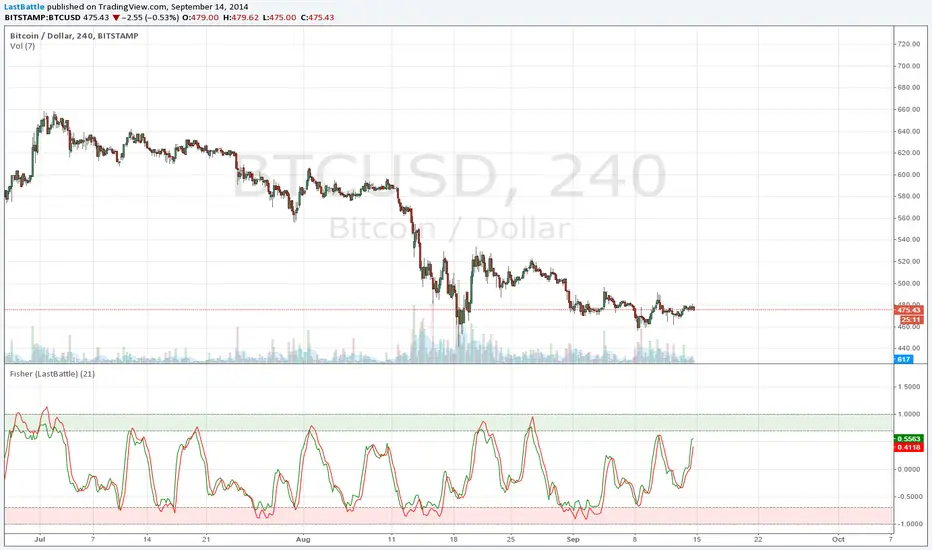
Fisher Transform StrategyDirect port of the original Fisher Transform to TradingView: media.johnwiley.com.au
www.mesasoftware.com
This might be better suited to be combined with other indicator to be effective, such as the Fisher Transform of RSI.
I hope you have found this useful :) Happy trading.
Thanks to @MikeLloyd for referring me to this, and here's my port for you.
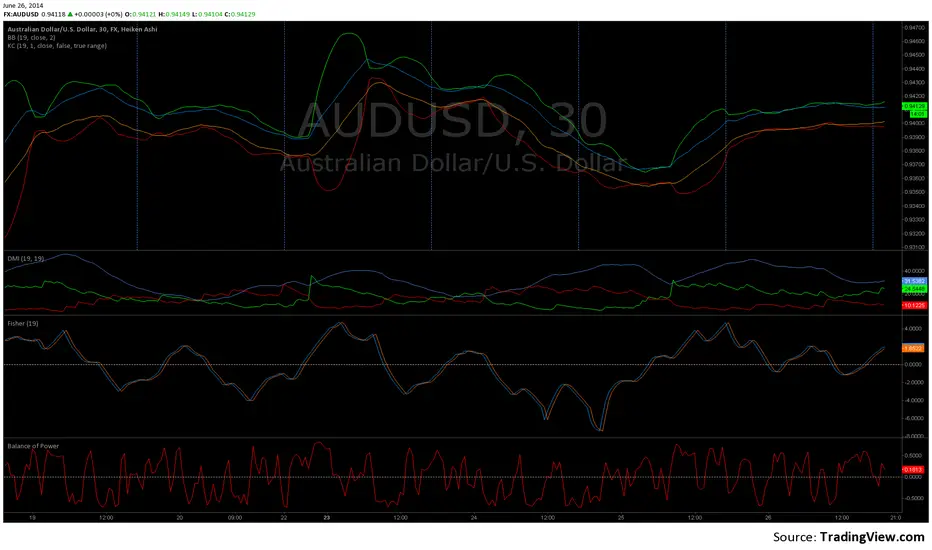
Balance of Power (w Zero Line)Same as classic Balance of Power except with a Zero Line added. Sorry, new to TradingView: did not mean to publish this as an "Idea" - just tweak the BoP indicator to show the zero crossover. This facilitates comparison with other indicator. Is there a way to delete this "Idea" submission?
2 MA + Strat Candle ColorsThe "2 MA + Strat Candle Colors" indicator combines two customizable moving averages (MAs) with a strategic candle-coloring system to help traders analyze trends and price action. Here’s a breakdown of its features:
1. Two Moving Averages (MAs):
MA 1 & MA 2 Settings:
Users can select between 7 MA types for each line: SMA, EMA, WMA, HMA, VWMA, LSMA, SMMA.
Adjustable periods and price sources (e.g., close, open) for both MAs.
Default settings: MA 1 = 9-period EMA, MA 2 = 20-period EMA.
Plotting:
MA 1 is blue, MA 2 is red (colors customizable via inputs).
Crossovers between the MAs can signal trend changes.
2. Strategic Candle Coloring:
Candles are colored based on their relationship to the previous candle:
Green (Bullish): "Two-Up Bar" – current high > prior high, and low does not break prior low.
Red (Bearish): "Two-Down Bar" – current low < prior low, and high does not break prior high.
Purple (Outside Bar): "Three Bar" – current candle engulfs the prior candle (higher high and lower low).
Yellow (Inside Bar): "One Bar" – current candle is contained within the prior candle’s range.
Candle coloring is based on:
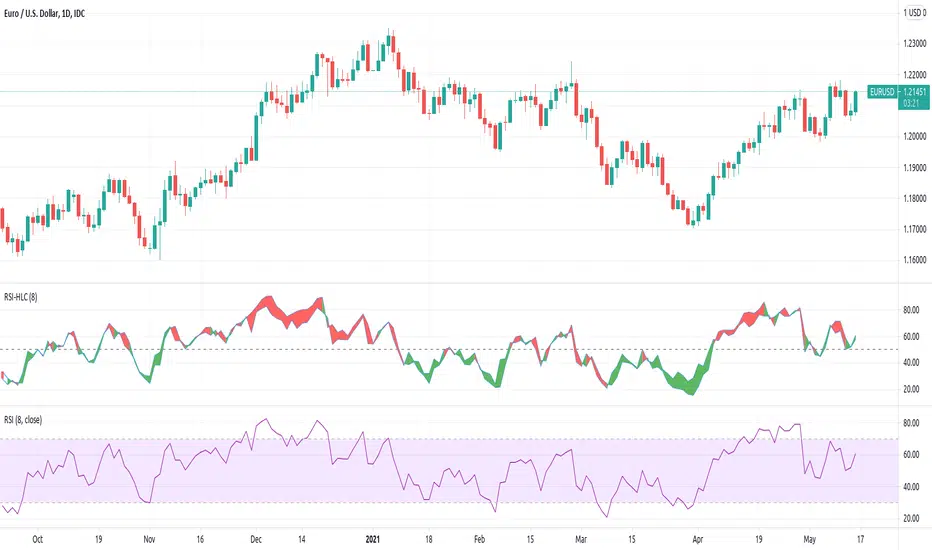
[JL] Relative Strength Index HLCTA is about visual arts.
I put both Close and (H+L)/2 on RSI and have more views on market.
How to use:
- Big Green and big Red should be considered.
- Divergence is always a good signal, but may be ensured by others like trend lines.
Custom ScreenerI was inspired by this idea:
With his script you can create a simple custom screener in Pine Script on your own for 40 tickets or less. But to make a separate screener for every 40 stocks sucks, so I wrote a program that generates script that allows you to switch stock sets.
Current script is generated for the Moscow stock exchange.
You can contact me if you need screener for your exchange or big set of stocks.