Candle Partition Statistics with IQV and Chi2NOTE: THE FORMULA IN THE CHART IS NOT PART OF THE CODE
This Pine Script calculates statistical measures for candle partitions based on whether a candle is bullish or bearish and whether the price is above or below an EMA. It evaluates statistical properties such as the Index of Qualitative Variation (IQV) and the Chi-Square (χ²) statistic to assess variations in price action.
Concept of Index of Qualitative Variation (IQV)
IQV is a statistical measure used to quantify the diversity or dispersion of categorical variables. In this script, it is used to measure how evenly the four categories of candles (green above EMA, red above EMA, green below EMA, red below EMA) are distributed.
Purpose of IQV in the Script:
IQV ranges from 0 to 1, where 0 indicates no variation (one category dominates) and 1 indicates maximum variation (categories are equally distributed).
A high IQV suggests balanced distributions of bullish/bearish candles above/below the EMA, indicating market uncertainty or mixed sentiment.
A low IQV suggests dominance of a particular candle type, indicating a strong trend.
Concept of Chi-Square (χ²) Test
Chi-square (χ²) is a statistical test that measures the difference between expected and observed frequencies of categorical data. It assesses whether short-term price behavior significantly deviates from historical trends.
Purpose of Chi-Square in the Script:
A high χ² value means that short-term candle distributions are significantly different from historical patterns, indicating potential trend shifts.
If χ² exceeds a predefined significance threshold (chi_threshold), an alert (Chi² Alert!) is triggered.
It helps traders identify periods where recent price behavior deviates from historical norms, possibly signaling trend reversals or market regime changes.
Key Takeaways:
IQV helps measure the diversity of price action, detecting whether the market is balanced or trending.
Chi-square (χ²) identifies significant deviations in short-term price behavior compared to long-term trends.
Both metrics together provide insights into whether the market is stable, trending, or shifting.
The Nasan C-score enhances trend strength by incorporating volatility. It is calculated as:
enhanced_t_s =(𝑡𝑠 × avg_movement x 100)/SMA(𝑐lose)
Key Components:
𝑡𝑠 : Measures trend strength based on price movements relative to EMA.
ts=green_EMAup_a+0.5×red_EMAup_a−(0.5×green_EMAdown_a+red_EMAdown_a)
avg_movement: The SMA of absolute close-open differences, capturing volatility.
Normalization: The division by SMA(close) adjusts the score relative to price levels.
Purpose of the Nasan C-score
Enhanced Trend Strength
It amplifies the trend strength value by factoring in volatility (price movement).
If price volatility is high, trend strength variations have a greater impact.
Volatility-Adjusted Momentum
By scaling 𝑡𝑠 with average movement, the score adjusts to changing price dynamics.
Higher price fluctuations lead to a higher score, making trend shifts more prominent.
How It Can Be Used in Trading
Higher values of Nasan C-score indicate strong bullish or bearish trends.
Comparing it with past values helps determine whether momentum is increasing or fading.
Thresholds can be set to identify significant trend shifts based on historical highs and lows.
在脚本中搜索"ts+t+0股票交易软件"

AWR_WaveTrend Multitimeframe [adapted from LazyBear]I've adapted a script from Lazy Bear (WT trend oscillator)
WaveTrend Oscillator is a port of a famous TS/MT indicator.
When the oscillator (WT1 designed as a line) is above the overbought band (50 to 60) and crosses down the WT2 (dotted line), it is usually a good SELL signal. Similarly, when the oscillator crosses above the signal when below the Oversold band ( (-50 to -60)), it is a good BUY signal.
In this indicator, you can display at the same time, different time frames.
Choice possible are 1 mn, 15 mn, 30 mn, 60 mn, 120 mn, 240 mn, 1D, Week, Month.
Small time frames (1 to 30 mn) are represented by a blue lines (light to dark)
1H is in grey
2H & 4H are in purple (light to dark)
1D is in green
1W is in orange
1M is in black
You can choose which timeframes you want to display for the current period or for the last period closed.
In a few seconds, you perfectly see the selected timeframes trends.
There is also at the bottom right a table summing up all the different values of WT1, WT2 and difference between them.
Positive difference means an upside trend
Negative difference means a downside trend.
Another way of using this indicator is displaying only the difference between WT1 & WT2. It's giving the speed & the direction of all trends. Trends are our friends ...
You can observe the significent times frames and look if they are all positives or negatives or if the speed of lower timeframe cross a longer timeframe of if the speed is decreasing or increasing...
Difference values goes generaly from -20 to 20 (it can exceed a bit but really rare). 12 is already high level of speed.
Many uses possible.
In the exemple posted, I've selected WT1 and WT2 for timeframes 4H, Daily & Weekly.
Marker 1:
Orange lines (WT1) are far below - 50 (-67 here) and cross WT2 pointed lines : weekly buy signal
But this buy signal is balanced by 4H & Daily sell signal = it's marking start of hesitations of main trend !!!!
Marker 2 :
Next buy signal in 4H or daily would normaly confirm the start
Marker 3 :
Sell signal in 4H and daily but weekly has an upside trend ! Start of a counter trend in the trend. To find the perfect timing of that you have to look to lower time frames, because 4H and daily are giving many hesitations signals crossing down & crossing up many times in an overbought zone.
Marker 4 :
End of the counter trend. Most of the time, the countertrend don't go in the "over" zone. That's why if you trading in an counter trend, you have to keep it in mind.
Then a few days later you can see the sell signal. And what a sell signal ! 4H & daily are smashed down really fastly ! Trends change warning !
Marker 5
Long hesitation/change of the trend. Daily WT and 4H are below the weekly trends. Weekly start to go down.
Start of a counter trend inside the trend giving us the best selling signal at her end !
Marker 6 :
Long hesitation/change of the trend.
You have to look in lower time frames to identify the short trend. Difficult to find the best timing to get in. ....
I've add many alerts. When a time frame become positive or negative. When many time frames are positive or negative or above or below 47 level...
Please feel free to explore.
Hope it will help you.
Thanks to Lazybear ! Thousands thanks to Lazybear !
Exemple with difference

MAGIC MACDMAGIC MACD ( MACD Indicator with Trend Filter and EMA Crossover confirmation and Momentum). This MACD uses Default Trading view MACD
from Technical indicators library and adding a second MACD along with 3 EMA's to detect Trend and confirm MACD Signal.
Eliminates usage of 3different indicators (Default MACD , MACD-2,EMA5, EMA20, EMA50)
Basic IDEA.
Idea is to filter Histogram when price is above or below 50EMA. Similar to QQE -mod oscillator but Has a EMA Filter
1.Take DEFAULT MACD crossover signals with lower period
2.check with a Higher MACD Histogram.
3.Enter upon EMA crossover signal and Histogram confirmation.
Histogram changes to GRAY when price is below EMA 50 or above EMA 50 (Follows Trend)
4.Exit on next Default MACD crossover signal.
Overview :
Moving Average Convergence Divergence Indicator Popularly Known as MACD is widely used. MACD Usually generates a lots of False signals
and noise in Lower Time Frames, making it difficult to enter a trade in sideways market. Divergence is a major issue along with sideways
movement and tangling of MACD and Signal Lines. There is no way to confirm a Default MACD signal, except to switch time frames and
verify.
Magic MACD Can be used to in combination with other signals.
This MACD uses two MACD Signals to verify the signal given by Default MACD . The Histogram Plot shown is of a higher period
MACD (close,5,50,30) values. When a signal is generated on a lower MACD it is verified by the histogram with higher time period.
Technicals Used:
1. Lower MACD-1 values 12,26 and signal-9 (crossover Signals)
2. Higher MACD-2 values 5,50 and signal-30 (Histogram)
3. EMA 50 (Histogram Filter to allow only if price above or below Ema 50)
4. EMA 5 and EMA 20 for crossover confirmation of trend
What's is in this Indicator?
1.Histogram-(higher period 5,50 and 30signal)
2. MACD crossover Signals-(lower period Default MACD setting)
3.Signal Lines-( EMA 5 & 20)
Implemented & Removed in this Indicator
1. Default MACD and Signal Lines are removed completely
2. MACD crossover are taken on lower periods and plotted as signals(Blue Triangle or Red Triangle)
3. Histogram is plotted from a higher Period providing a clear picture with Higher Time period
4. EMA 5 and EMA 20 are used for MACD signal confirmation
How to use?
Up Signal
1. MACD Default (12,26,30) up signals are shown in Blue
2. Wait till the Histogram changes Blue
3. Look for EMA signals crossover near by
Down Signal
1. MACD Default (12,26,30) up signals are shown in Red
2. Wait till the Histogram changes Red
3. Look for EMA signals crossover near by
Do's
Consider only opposite color as signals
1. Red Triangle on Blue Histogram(likely to move down direction)
2. Blue Triangle on Red Histogram (Likely to move up direction)
Don'ts
1.Ignore Blue Signal on Blue Histogram (pull back signals can be used to enter trade if you miss first crossover)
2.Ignore Red Signal on Red Histogram(pull back signals can be used to enter trade if you miss first crossover)
3.Ignore Up and Down signals till Gray or Blacked out area is finished in Histogram
Tips:
1. EMA plot also shows pull back areas along with signals
2.side by side opposite signals shows sides ways movement
3. EMA 5,20 is plotted on MACD Histogram for Additional Benefit
Thanks & Credits
To Tradingview Team for allowing me to use their default MACD version and coding it in to a MAGIC MACD by adding a few lines of code that
makes it more enhanced.
Warning...!
This is purely for Educational purpose only. Not to be used as a stand alone indicator. Usage is at your own Risk. Please get familiar with its working before implementing. Its not a Financial Advice or Suggestion . Any losses or gains is at your own risk.

Moving Average Displaced Envelope & ATRTS Moving Average Displaced Envelope. These envelopes are calculated
by multiplying percentage factors with their displaced expotential
moving average (EMA) core.
How To Trade Using:
Adjust the envelopes percentage factors to control the quantity and
quality of the signals. If a previous high goes above the envelope
a sell signal is generated. Conversely, if the previous low goes below
the envelope a buy signal is given.
Average True Range Trailing Stops Strategy, by Sylvain Vervoort
The related article is copyrighted material from Stocks & Commodities Jun 2009
ATR TS used by filter for MADE signals.
WARNING:
- For purpose educate only
- This script to change bars colors.

Impatient TS VWAP BandsImpatient VWAP bands are based of Traderskew's VWAP bands but are for more impatient traders.
Wicking or crossing down through the upper band indicates a good short trade entry for range-bound trading periods while wicking or crossing up through the lower band indicates a good long entry in range-bound conditions.
By default, impatience is disabled. If it is turned on, adjusting impatience determines how quickly the bands approach price: higher impatience approaches price faster. Rebound indicates how far from price the bands bounce after hitting price.

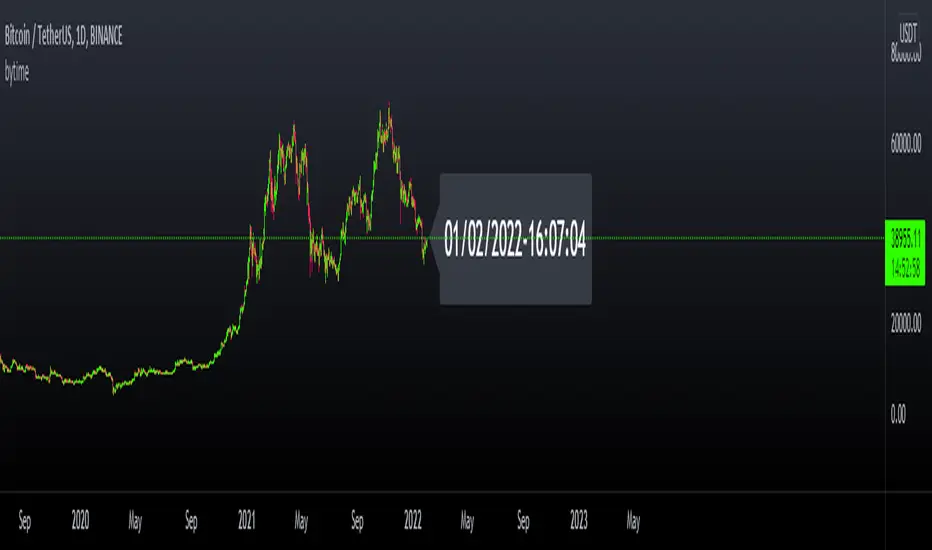
bytimeLibrary "bytime"
TODO: to do something at the specified time.
////Return =>> ht = hour , mt = minute , st = second ,Dt = Day, Mt = month, Yt = year , dateTime = full time format./////////////
Note : Remember to always add import when you call our library and change Gtime() to Timeset.Gtime() is used to access internal data.
import hapharmonic/bytime/1 as Timeset
=Timeset.Gtime()
/////////////Set a time to trigger an alert./////////////
ck = false
///hour : minute : second
if ht == TH and mt == TM and st == TS
//some action
//...
//.
ck := true
Gtime()
Vortex and RSI ts 2020* System long only (for shares).
* Enter if Vortex up crosses up vortex down and there is the classical second test of a close higher than previous' high
* Exit if
a) RSI crosses under 70 OR
b) on the contrary, Vortex down crosses up vortex up and there is the classical second test of a close lower than previous' low
* fixed money management to be optimized added.

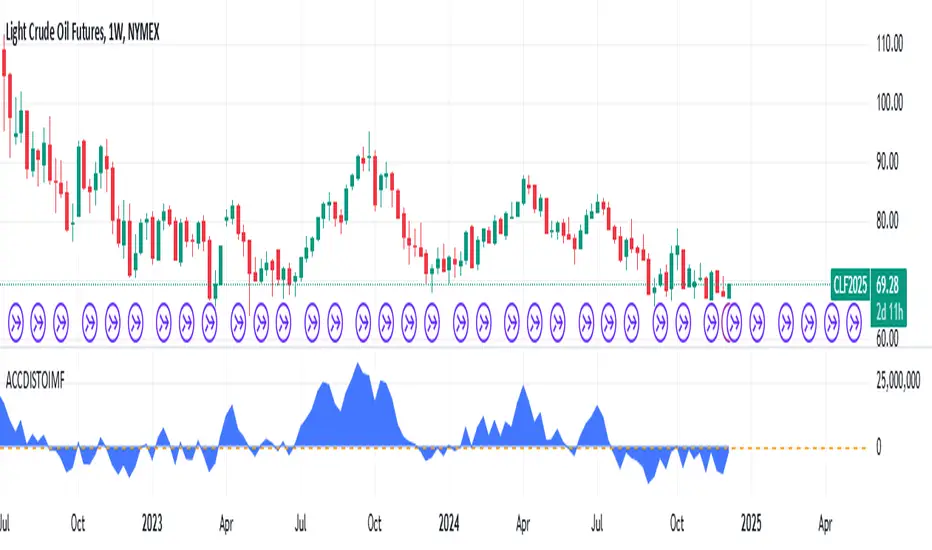
Accumulation/Distribution Open Interest Money Flow Hi, this script is the version of Accumulation / Distribution Money Flow (ADMF) that uses Open Interes ts in the required markets instead of Volume.
Can be set from the menu. (Futures/Others)
NOTE: I only modified this script.
The original script belongs to cl8DH.
Original of the script:
I think it will make a difference in the future and commodity markets.
Since the system uses CFTC data, use only for 1W timeframe.
With my best regards..
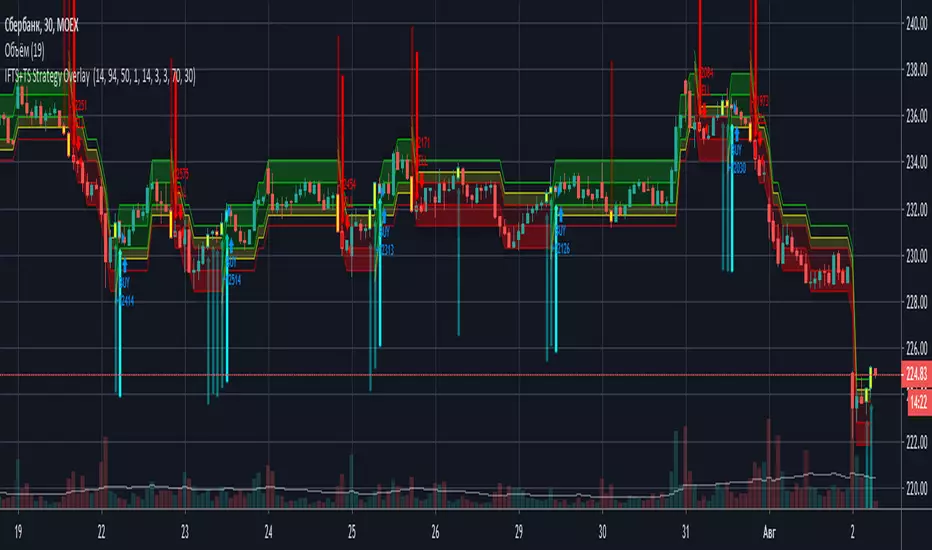
IFTS+TS Strategy OverlayInverse Fisher transform on stochastic with Hull MA and Donchian Channels with oversell/overbuy levels and dynamic trailing stop
Options:
Fixed trailing stop
Dynamic, based on ATR trailing stop
Re-enter after trailing stop
Includes Hull MA
Hull MA filtration for re-entering after trailing stop
Donchian channels, with overbuy/oversell levels
No repaints

FuturesVsSpotShows the difference between Futures and Spot.
- Credits go to Josh Olszewicz / someone in whaleclub ts

MACD + RSI TSA simple strategy that use EMAs convergence/divergence and RSI peeks to take position. Fractals are really useful to positioning your stop loss.
It works well on commodities and forex markets.

STEEMSBD WaveTrendWaveTrend-Oscillator over synthetic STEEM/SBD based on STEEM/BTC and SBD/STB from Poloniex.
WaveTrend part is based on LazyBear's port of TS/MT indicator.

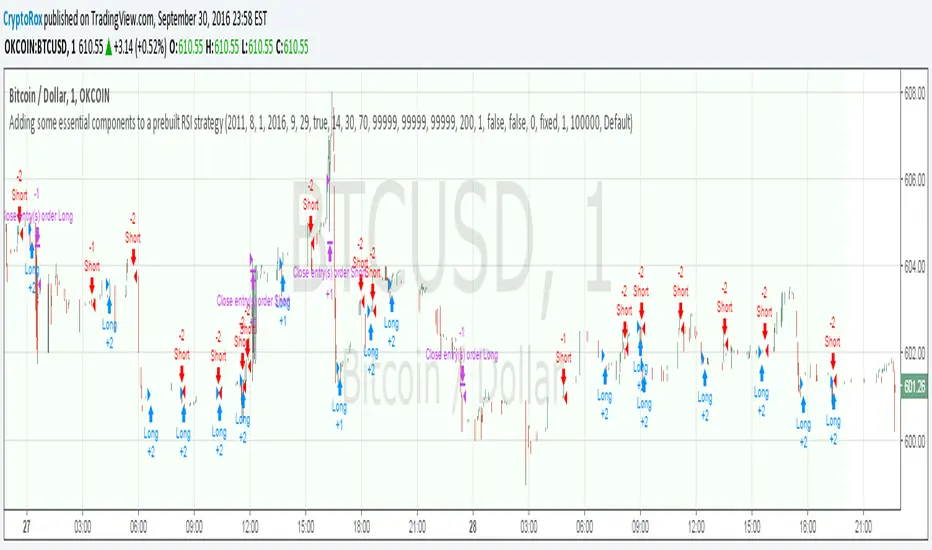
Adding some essential components to a prebuilt RSI strategyThis is more to be used as a blank_slate for any strategy build adding more effective backtesting with a period selector and inputs like TS, TP, SL that can all be used as plots for alerts.
It has the BackTest Component created by Pbergden
It also includes the standard long/short with trailing stop, take profit, stop loss and margin call.
Here is a video using the blank_slate to add in the built-in RSI Strategy.
youtu.be
We hope this brings good results and helps speed things up for everyone.
UPdate Intraday TS ,BB + Buy/Sell +Squeeze Mom.+ adx-dmiUpdate version with legend on data window and new colors on the squeeze mom idicator

Intraday TS ,BB + Buy/Sell +Squeeze Mom.+ adx-dmiIntraday 5+ min indicator/strategy. Mix of indicator as BB, Ema , Roc , adx/dmi with buy and TP/SL point. All in 1 indicator easy to use . Just look the color chnge and the shape add the the bars

[AutoView] Trailing Stop Back Testing and alerts + TP and TSThe number one request since the creation of autoview was to have alerts triggered for Take Profit, Stop Loss and Trailing Stops. Finally, we've figured it out, and as an additional bonus, this allows us to back test trailing stops in the strategy tester.
YouTube Video about this script and setup: bit.ly
This script contains 2 things people have been asking for, multiple time frames and of course, a trailing stop that can be both back tested and setup for alerts.
This strategy itself seems to perform better without the use of the Trailing Stop, so play around and monitor it before actually trying to trade it live.
View all the trades being tracked in a Google Sheets here: bit.ly
To learn more about back testing strategies, automation and AutoView join our free slack group via slack.crypto.pink
Referral Tax:
This requires 4 alerts, so you are going to have to upgrade to PRO. It'd be greatly appreciated if you signed up using our referral link.
bit.ly
1Broker
bit.ly
okcoin
bit.ly

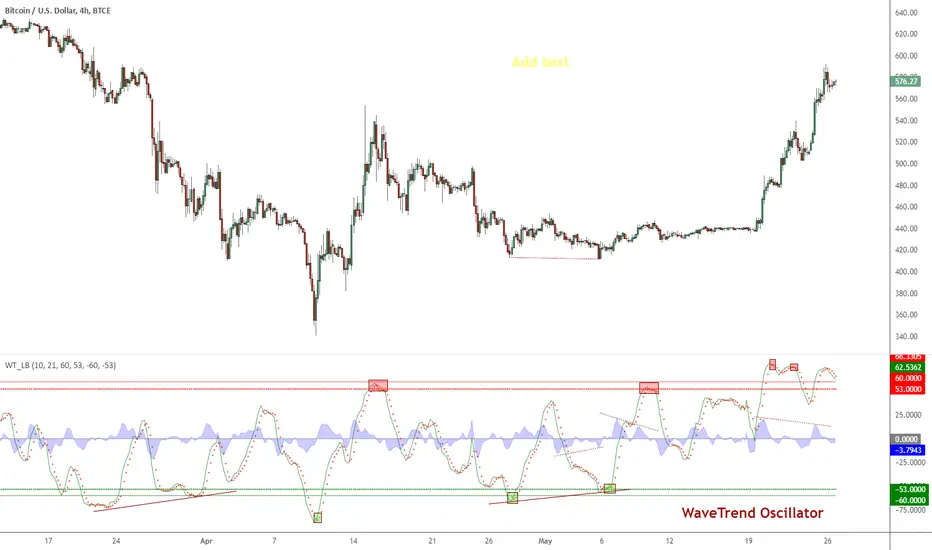
Indicator: WaveTrend Oscillator [WT]WaveTrend Oscillator is a port of a famous TS/MT indicator.
When the oscillator is above the overbought band (red lines) and crosses down the signal (dotted line), it is usually a good SELL signal. Similarly, when the oscillator crosses above the signal when below the Oversold band (green lines), it is a good BUY signal.
I have marked some cross-overs in the above chart. As you can see, they are *not* the only useful signals WT generates. Try it on your instrument and let me know what you think.