Volume Block Order AnalyzerCore Concept
The Volume Block Order Analyzer is a sophisticated Pine Script strategy designed to detect and analyze institutional money flow through large block trades. It identifies unusually high volume candles and evaluates their directional bias to provide clear visual signals of potential market movements.
How It Works: The Mathematical Model
1. Volume Anomaly Detection
The strategy first identifies "block trades" using a statistical approach:
```
avgVolume = ta.sma(volume, lookbackPeriod)
isHighVolume = volume > avgVolume * volumeThreshold
```
This means a candle must have volume exceeding the recent average by a user-defined multiplier (default 2.0x) to be considered a significant block trade.
2. Directional Impact Calculation
For each block trade identified, its price action determines direction:
- Bullish candle (close > open): Positive impact
- Bearish candle (close < open): Negative impact
The magnitude of impact is proportional to the volume size:
```
volumeWeight = volume / avgVolume // How many times larger than average
blockImpact = (isBullish ? 1.0 : -1.0) * (volumeWeight / 10)
```
This creates a normalized impact score typically ranging from -1.0 to 1.0, scaled by dividing by 10 to prevent excessive values.
3. Cumulative Impact with Time Decay
The key innovation is the cumulative impact calculation with decay:
```
cumulativeImpact := cumulativeImpact * impactDecay + blockImpact
```
This mathematical model has important properties:
- Recent block trades have stronger influence than older ones
- Impact gradually "fades" at rate determined by decay factor (default 0.95)
- Sustained directional pressure accumulates over time
- Opposing pressure gradually counteracts previous momentum
Trading Logic
Signal Generation
The strategy generates trading signals based on momentum shifts in institutional order flow:
1. Long Entry Signal: When cumulative impact crosses from negative to positive
```
if ta.crossover(cumulativeImpact, 0)
strategy.entry("Long", strategy.long)
```
*Logic: Institutional buying pressure has overcome selling pressure, indicating potential upward movement*
2. Short Entry Signal: When cumulative impact crosses from positive to negative
```
if ta.crossunder(cumulativeImpact, 0)
strategy.entry("Short", strategy.short)
```
*Logic: Institutional selling pressure has overcome buying pressure, indicating potential downward movement*
3. Exit Logic: Positions are closed when the cumulative impact moves against the position
```
if cumulativeImpact < 0
strategy.close("Long")
```
*Logic: The original signal is no longer valid as institutional flow has reversed*
Visual Interpretation System
The strategy employs multiple visualization techniques:
1. Color Gradient Bar System:
- Deep green: Strong buying pressure (impact > 0.5)
- Light green: Moderate buying pressure (0.1 < impact ≤ 0.5)
- Yellow-green: Mild buying pressure (0 < impact ≤ 0.1)
- Yellow: Neutral (impact = 0)
- Yellow-orange: Mild selling pressure (-0.1 < impact ≤ 0)
- Orange: Moderate selling pressure (-0.5 < impact ≤ -0.1)
- Red: Strong selling pressure (impact ≤ -0.5)
2. Dynamic Impact Line:
- Plots the cumulative impact as a line
- Line color shifts with impact value
- Line movement shows momentum and trend strength
3. Block Trade Labels:
- Marks significant block trades directly on the chart
- Shows direction and volume amount
- Helps identify key moments of institutional activity
4. Information Dashboard:
- Current impact value and signal direction
- Average volume benchmark
- Count of significant block trades
- Min/Max impact range
Benefits and Use Cases
This strategy provides several advantages:
1. Institutional Flow Detection: Identifies where large players are positioning themselves
2. Early Trend Identification: Often detects institutional accumulation/distribution before major price movements
3. Market Context Enhancement: Provides deeper insight than simple price action alone
4. Objective Decision Framework: Quantifies what might otherwise be subjective observations
5. Adaptive to Market Conditions: Works across different timeframes and instruments by using relative volume rather than absolute thresholds
Customization Options
The strategy allows users to fine-tune its behavior:
- Volume Threshold: How unusual a volume spike must be to qualify
- Lookback Period: How far back to measure average volume
- Impact Decay Factor: How quickly older trades lose influence
- Visual Settings: Labels and line width customization
This sophisticated yet intuitive strategy provides traders with a window into institutional activity, helping identify potential trend changes before they become obvious in price action alone.
在脚本中搜索"volume"

ToTitans : HHV/LLV Volume IndexWhat it is ?
The trade volume index (TVI) measures the amount of money flowing in and out of a security or the market. The TVI depends on the direction of the security and whether securities are accumulated or distributed. The TVI generally uses a security's intraday price data.
To calculate the TVI, the minimum tick value of the security must be known. Next, the change in price must be calculated by subtracting the last price from the most current price. Then, the direction must be determined. If the change in the security's price is greater than the minimum tick value, the security is in an accumulation period. If the change in the security's price is less than the minimum tick value, the security is in a distribution period. If the change is less than or equal to, or greater than or equal to, the minimum tick value, the security's direction is the same as the last direction.
When the direction is determined, the TVI can be calculated. If the security is in accumulation, the current TVI is the previous trade volume index plus the current day's volume. Conversely, if the security is in distribution, the TVI is the previous trade volume index less the current day's volume.
The TVI can be used to indicate buying or selling pressure within a security. Say, for example, the changes in the prices of the security are greater than the minimum tick value and have been rising over a six-hour period. This signals traders and investors are accumulating the security and buying at the ask. This can be interpreted as bullish activity and may signal the security could increase in price due to the buying pressure
Differentiation
It is implemented in pinescript version4
Easier to detect TFEX:S501! on hitting the Highest High Value (HHV) and the Lowest Low Value (LLV)
This indicator has been used in AJ Jim class for "Type 2" approach
Suitable for
Intra Day Trading (20m-2h)
TFEX:S501!
"PM me to obtain access"

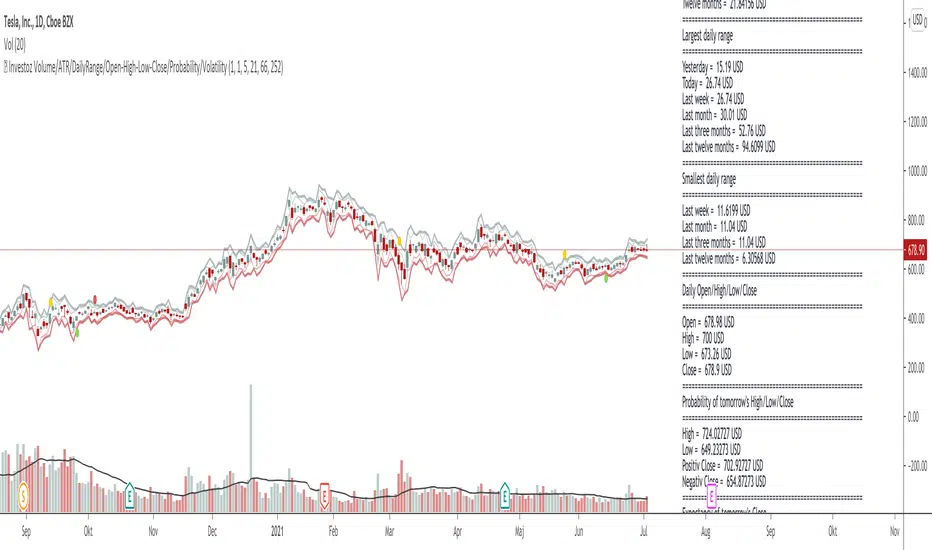
© Investoz Volume/ATR/DailyRange/OHLC/Probability/VolatilityThe relationship between returns, volatility and trading volume has interested financial economists and analysts for a long time.
Is there any dynamic relationship between trading volume, returns and volatility in the financial markets?
In recent financial studies, the linkage between return, volatility and trading volume is a central issue as it provides insights into the microstructure of financial markets. The price-volume relationship is seen as it is related to the role of information in price formation. Trading volume is defined as the number of shares traded each day and is an important indicator in technical analysis as it is used to measure the worth of stock price movement
either up or down.
Investors' motive to trade is solely dependent on their trading activity; it may be to speculate on market information or portfolios diversification for risk sharing, or else the need for liquidity. These different motives to trade are a result of processing different available information. In consequence, trading volume may originate from any of the investors who may have different information sets. As various studies reported, the information flow into the market is linked to the trading volume and volatility. Thus, since the stock price changes when new information arrives, there exists a relation between prices, volatility and trading volumes.
Significant efforts have been made, empirically and theoretically, on the phenomenon of stock price and volume relationship. Although the majority of those findings have confirmed the existence of positive contemporaneous relationship between trading volume and returns, the study of different stock markets have given mixed results about the causal return-volume relationship.
So, if you think that price and volume is important, maybe this indicator full of information around this topic may help you or make it easier in many ways.
Let me briefly guide you through.
To the right you have all the information within a label directly on the chart. Inside the label you will see following information:
-Number of bars
-Volume
-Average true range
-Daily range
-OHLC
-Probability for tomorrow´s daily range
-Warning of increased volatility
In the chart, you will also see where the expected daily range is likely to be within, with high and low levels.
Finally, I like to say this:
I have put a lot of work into this script and let me know if you use the indicator and what you think of it. Also if it is of some help or maybe you who use it, have found something wrong that needs to be reviewed and changed or information that would be important to add?
Enjoy!
Multiple Moving Averages+TransientZones+Volumes///////////////////////////////////////////////////////////////////////////////////////////
//// MULTIPLE_MA+TRANSIENT_ZONES+VOLUMES ////
/////////////////////////////////////////////////////////////////////////////////////////
// @author GianlucaBezziccheri
// A simple script including:
// 1) 4x Simple Moving Averages
// 2) 4x Exponential Moving Averages
// 3) 4x Weighted Moving Averages
// 4) 4x Volume Weighted Moving Averages
// 5) 4x Hull Moving Averages
// 6) Transient Zones v1.1 (by Jurij)
// 7) Volumes
// You can choose MA type you prefer and even to activate all of them at the same time,
// though i don't recommend doing this.
// For more details about 6) check the original script

[Volume Profile] Signal Clean Up Analysis with Backtest (TSO) This is a full-cycle trading system indicator, which uses Volume Profile for generating signals using a custom developed algorithm, TP (Take Profit) and SL (Stop Loss) levels. There are 2 SOURCES for signals (each can be used separately or both can be used at the same time, each signal SOURCE is using Volume Profile levels to open optimal trade direction) with chained (NOTE: You can select several or ALL of the features, this is not limited to either one) signal cleanup and analysis approach with scheduling and alerting capabilities. Works with most popular timeframes: 1M, 5M, 15M, 1H, 4H, D, great for intraday trading!
NOTE: Every calculation is done on a confirmed closed candle bar state, so the indicator will never repaint!
===========================================================================
Explanation of all the Features | Configuration Guide | Indicator Settings | Signal Cleanup Analysis
---------------------------------------------------------------------------
>>> Customizable Backtesting for a specific date range, results via TradingView strategy, which includes “Deep Backtesting” for largest amounts of data on trading results.
>>> Trading Schedule with customizable trading daily time range, automatic closing/alert trades before Power Hour or right before market closes or leave it open until next day.
>>> 3 Trading Systems.
>>> Multiple Signal SOURCEs for opening trades, either SOURCE can be used or both at the same time!
>>> Static/Dynamic Stop-Loss setups (HIGHLIGHT: Stop-Loss will be moved to Entry after TP1 is taken, which minimizes risk).
>>> Single or Multiple profit targets (up to 3).
>>> Take-Profit customizable offset feature (set your Take-Profit targets slightly before everyone is expecting it!).
>>> Candle bar signal analysis (matching candle color, skip opposite structured and/or doji candle uncertain signals).
>>> Additional analysis of VWAP/EMA/ATR/EWO (Elliot Wave Oscillator)/Divergence MACD+RSI/Volume signal confirmation (clean up your chart with indicator showing only the best potential signals!).
>>> Advanced Alerts setup, which can be potentially setup with a trading bot over TradingView Webhook (NOTE: This will require advanced programming knowledge).
===========================================================================
Labels, plots, colors explanations:
---------------------------------------------------------------------------
>>>>> Signal SOURCE(s): Green/Red arrows, which will be shown unconditionally, outside of trade engine and can be hidden if desired.
>>>>> LONG open: green "house" looking arrow below candle bar.
>>>>> SHORT open: red "house" looking arrow above candle bar.
>>>>> LONG/SHORT take-profit target: green/red circles (multi-profit > TP2/3/4/5 smaller circles).
>>>>> LONG/SHORT take-profit hits: green/red diamonds.
>>>>> LONG/SHORT stop-loss target: green/red + crosses.
>>>>> LONG/SHORT stop-loss hits: green/red X-crosses.
>>>>> LONG/SHORT EOD close (profitable trade): green/red squares.
>>>>> LONG/SHORT EOD close (loss trade): green/red PLUS(+)-crosses.
===========================================================================
Date Range and Trading Schedule Settings
---------------------------------------------------------------------------
>>>>> Date Range: Select your start and/or end dates (uncheck “End” for indicator to show results up to the very moment and to use for LIVE trading) for backtesting results, if not using backtesting – uncheck “Start”/“End” to turn it off.
>>>>> Use TradingView “Strategy Tester” to see backtesting results
NOTE: If Strategy Tester does not show any results with Date Ranged fully unchecked, there may be an issue where a script opens a trade, but there is not enough TradingView power to set the Take-Profit and Stop-Loss and somehow an open trade gets stuck and never closes, so there are “no trades present”. In such case you will need to manually check “Start”/“End” dates or use “Depp Backtesting” feature!
>>>>> Trading Schedule: This is where you can setup Intraday Session or any custom session schedule you wish. Turn it ON. Select trading hours. Select EOD (End of Day) setting (NOTE: If it will be OFF, the indicator will assume you are holding your position open until next day!).
>>> Trading Systems: 1) "Open Until Closed by TP or SL": the signal will only open a trade if no trades are currently open/trunning, a trade can only be closed by Take Profit, Stop Loss or End of Day close (if turned on) | 2) "Open Until Closed by TP or SL + OCA": Same as 1), but if there is an opposite signal to the trade which is currently open > it will immediately be closed with new trade open or End of Day close (if turned on) | 3) "OCA (no TP or SL)": There are is Take Profit or Stop Loss, only an opposite signal will close current trade and open an opposite one or End of Day close (if turned on)
>>>>> MULTIPROFIT | TP (Take-Profit) System: Once the trade is open, all Take-Profit target(s) are immediately calculated and set for the trade > once the target(s) is hit > trade will be partially closed (if candle bar closes beyond several Take-Profit targets > trade will be reduced accordingly to the amount of how many Take-Profit targets were hit)
>>>>> MULTIPROFIT | SL (Stop-Loss) System: 1) Static – Once the trade is open, Stop-Loss is calculated and set for the remaining of the trade ||| 2) Dynamic – At trade open, Stop-Loss is calculated and set the same way, however once 1st Take-Profit is taken > Stop-Loss is moved to Entry, reducing the risk.
>>>>> # of TPs (number of take profit targets): Just like it is named, this is where you select the number of Take-Profit targets for your trading system (NOTE: If "OCA (no TP or SL)" Trading System is selected, this setting won’t do anything, since there are no TP or SLs for that system).
>>>>> TP(s) offset: This is a special feature for all Take-Profit targets, where you can turn on a customizable offset, so that if the price is almost hitting the Take-Profit target, but never actually touches it > you will capture it. This is good to use with HHLL (Highest High Lowest Low), which is pretty much a Support/Resistance as often the price will nearly touch these strong areas and turn around…
===========================================================================
Take-Profit and Stop-Loss visual example:
---------------------------------------------------------------------------
1) A simply nice intraday trading day for SPY (S&P500 ETF TRUST) with a single Take-Profit target on each trade.
See how Take-Profit distances increase with price momentum and how Stop-Loss is following the trade reducing the risk!
2) Same intraday trading day for SPY (S&P500 ETF TRUST) with 3 Take-Profit targets with static Stop-Loss.
3) Same intraday trading day for SPY (S&P500 ETF TRUST) with 3 Take-Profit targets with dynamic Stop-Loss.
You can see how Stop-Loss was moved once TP1 is taken!
===========================================================================
Trade Analysis and Cleanup Settings
---------------------------------------------------------------------------
>>>>> Candle Analysis | Candle Color signal confirmation: If closed candle bar color does not match the signal direction > no trade will be open.
>>>>> Candle Analysis | Skip opposite candle signals: If closed candle bar color will match the signal direction, but candle structure will be opposite (for example: bearish green hammer, long high stick on top of a small green square) > no trade will be open.
>>>>> Candle Analysis | Skip doji candle signals: If closed candle bar will be the uncertain doji > no trade will be open.
>>>>> Divergence/Oscillator Analysis | EWO (Elliot Wave Oscillator) signal confirmation: LONG will only be open if at signal, EWO is green or will be at bullish slope (you can select which setting you desire), SHORT if EWO is red or will be at bearish slope.
>>>>> Divergence/Oscillator Analysis | VWAP signal confirmation: LONG will only be open if at signal, the price will be above VWAP, SHORT if below.
>>>>> Divergence/Oscillator Analysis | Moving Average signal confirmation: LONG will only be open if at signal, the price will be above selected Moving Average, SHORT if below.
>>>>> Divergence/Oscillator Analysis | ATR signal confirmation: LONG will only be open if at signal, the price will be above ATR, SHORT if below.
>>>>> Divergence/Oscillator Analysis | RSI + MACD signal confirmation: LONG will only be open if at signal, RSI + MACD will be bullish, SHORT if RSI + MACD will be bearish.
>>>>> Volume signal confirmation: LONG/SHORT will only be open if closing candle volume is 150% above average Volume based on the Volume Length.
===========================================================================
Alert Settings (you don’t have to touch this section unless you will be using TradingView alerts through a Webhook to use with trading bot)
---------------------------------------------------------------------------
Here is how a LONG OPEN alert looks like (each label is customizable + I can add up more items/labels if needed):
COIN: BTCUSD
TIMEFRAME: 15M
LONG: OPEN
ENTRY: 20000
TP1: 20500
TP2: 21000
TP3: 21500
SL: 19000
Leverage: 0
===========================================================================
Adding Alerts in TradngView
---------------------------------------------------------------------------
-Right-click anywhere on the TradingView chart
-Click on Add alert
-Condition: Select this indicator by it’s name
-Alert name: Whatever you want
-Hit “Create”
-Note: If you change ANY Settings within the indicator – you must DELETE the current alert and create a new one per steps above, otherwise it will continue triggering alerts per old Settings!
===========================================================================
If you have any questions or issues with the indicator, please message me directly via TradingView.
---------------------------------------------------------------------------
Good Luck! (NOTE: Trading is very risky, past performance is not necessarily indicative of future results, so please trade responsibly!)

Volume-Weighted Supertrend Strategy [wbburgin]This is a script that can be used as a strategy or a standalone indicator.
The Volume-Weighted Supertrend is a supertrend based on a rolling VWAP, instead of a normal price source. The strategy has two components - a supertrend based off of this VWAP (shown on the chart) and a supertrend from volume itself (not plotted on the chart directly). The supertrend from volume is an example of my "Supertrend Any Source" indicator, where a custom ATR is created from non-OHLC data; this is available as both a separate public script and also in my "wbburgin_utils" library for you to use in your own script creation.
The supertrend from volume acts as a confirmation filter for the VWAP-supertrend shown on-chart. If the volume supertrend is trending up and the VWAP-based supertrend is also trending up, a buy signal is generated. Likewise, if the volume supertrend is trending down and the VWAP-supertrend is trending down, a sell signal is generated. The colors are based off of whether both supertrends are trending up or down: green for both up, blue for only price up, orange for only price down, and red for both down.
The settings enable you to change the volume length and the ATR length separately, as well as the multiplier and the source for the price supertrend. If you load the indicator for the first time and see no entries and exits, this is because "Show Strategy Entries and Exits" is disabled in the settings. This is if you plan on using the strategy as an indicator and don't want to be bothered by the entry and exit symbols on the chart. Additionally, for those who like clean charts (like me), you can turn all the labels off in the settings, as well as the highlighting.
My default strategy settings for the strategy results shown below are as follows: 5% equity per trade, 5 degrees of pyramiding, commissions of 0.08% per trade. This strategy doesn't come with stops yet, so please be aware of that before using it to trade - I highly suggest you create your own stops based off of your R/R ratio and personal risk tolerance. Additionally, it works best on trending assets (b/c of the supertrends) with high volume. This might mean it does not work as well on lower timeframes.

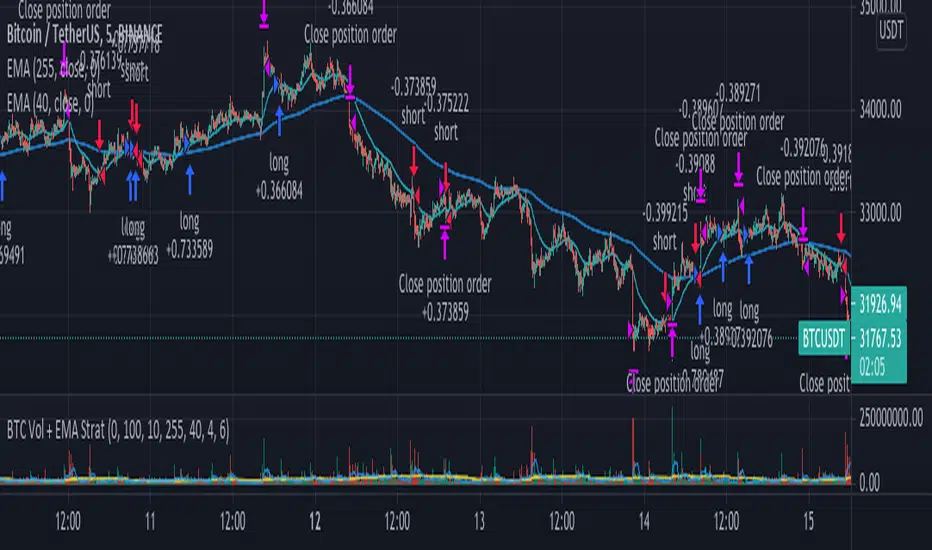
Aggregate BTC Volume + EMA Strat// This strategy buys when the price crosses the Fast EMA. It can go long only
// when the price is above the slow EMA and short when is below. The exit
// is determined by volume spikes, when the volume is greater than the Volume
// MA multiplied by the assigned input multiplier. Thanks to MartinShkreli
// for the Aggregated BTC volume. There is also a Maximum Loss filter which
// should be modified depending on the traded market.
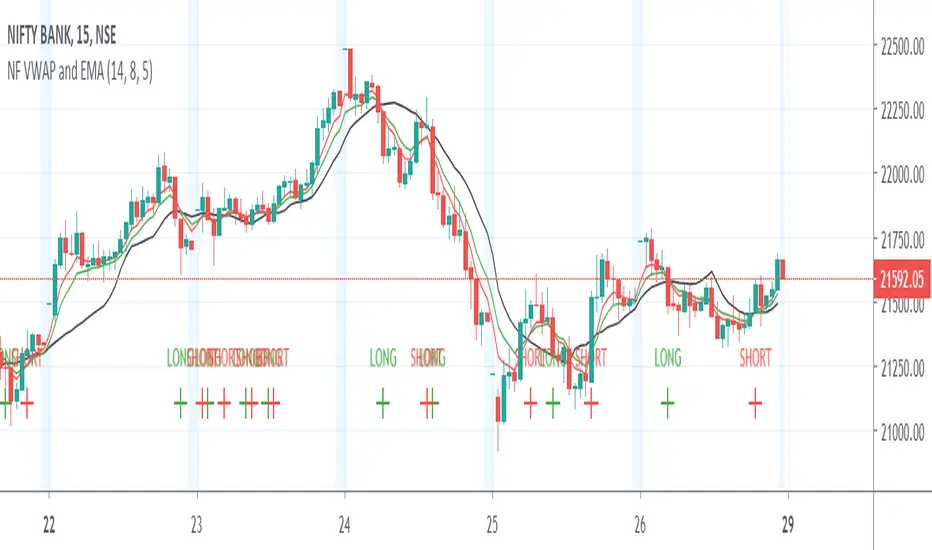
Nifty Volume profile + VWAP + EMA The script picks up nifty stocks with their current respective weights and plots a Volume Weighted Average Price line along with 2 EMAs and an alert when the EMAs cross over.
You can customize the script for EMA lengths and to remove alert. Basic utility of the script is to analyse volumes driving the Nifty 50 index.
Credits to @daytraderph and his script (Custom Volume) who's code I used to build this script. Also thanks to my friend @Varun who helped me code it.
Volume fight strategyThe Volume fight strategy looks for the predominance of bullish or bearish trading volume on the chart by dividing the trading volume in the bar into 2 parts - "bullish volume" and "bearish volume", and comparing the weighted average values by volume with each other at a given distance.
This strategy is suitable for any instrument (cryptocurrency, Forex, stocks) and is able to work on any TF.
The Volume fight strategy should be used as an auxiliary indicator that tells you who is currently prevailing in the market - " bulls "or"bears".
To configure the strategy , it is necessary to set the range of evaluation of the predominance of bullish or bearish volume (the number of bars, by default-24 bars for TF=1H). The smaller the TF, the higher the range value should be used to filter out false signals.
When there is a predominance of "bulls" on the chart, a green triangle appears (relevant at the close of the bar) and the histogram is highlighted in green, when "bears" appear on the chart, a red triangle appears (relevant at the close of the bar) and the histogram is highlighted in red.
In the strategy settings, there is smoothing to reduce false signals and highlight the flat zone by specifying a percentage, at least which should be the difference between the forces of the "bullish" and "bearish" volume . If the difference between the volume forces is less than the specified one (by default-15%), the zone is considered flat and is displayed in gray on the histogram.
If you set the percentage to zero, the flat zones will not be highlighted, but there will be much more false signals, since the strategy becomes very sensitive when the smoothing percentage decreases.
There is a function-to show the color background of the current trading zone. For" bullish "- green, for" bearish " - red.
In the settings, you can enable the display and use of each signal in the trading zone, not only the initial one, but also each after the flat zone. By default, only the signal of the beginning of the ascending/descending zone is used.
The strategy has alerts for "bullish" and "bearish" movements.
👉Use alerts - "alert() function calls only"
If you have any questions, you can write to me in private messages or by using the contacts in my signature.
----------------------------------------------------
Стратегия Volume fight ищет на графике преобладание бычьего или медвежьего объёма торгов путём разделения торгового объёма в баре на 2 части - "бычий объём" и "медвежий объём", и сравнения средне-взвешенных значений по объёму между собой на заданной дистанции.
Данная стратегия подходит для любого инструмента (криптовалюта, Forex, акции) и способен работать на любом ТФ.
Стратегию Volume fight следует использовать как вспомогательный индикатор, который подсказывает Вам кто сейчас преобладает на рынке - "быки" или "медведи".
Для настройки стратегии необходимо выставить диапазон оценки преобладания бычьего или медвежьего объема (количество баров, по умолчанию - 24 бара для ТФ=1Ч). Чем меньше ТФ, тем выше следует использовать значение диапазона, чтобы отфильтровать ложные сигналы.
При возникновении преобладания на графике "быков" появляется зелёный треугольник (актуален по закрытию бара) и гистограмма подсвечивается зелёным цветом, при возникновении на графике "медведей" появляется красный треугольник (актуален по закрытию бара) и гистограмма подсвечивается красным цветом.
В настройках стратегии есть сглаживание для уменьшения ложных сигналов и выделения зоны флета с помощью указания процента, не менее которого, должна быть разница между силами "бычьего" и "медвежьего" объёма. Если разница между силами объёмов меньше заданного (по умолчанию - 15%), то зона считается флетовой и отображается на гистограмме серым цветом.
Если выставить процент равным нулю, то зоны флета выделяться не будут, но будет гораздо больше ложных сигналов, так как стратегия становится очень чувствительной при снижении процента сглаживания.
Есть функция - показывать цветовой фон текущей торговой зоны. Для "бычьего" - зелёный, для "медвежьего" - красный.
В настройках можно включить отображение и использование каждого сигнал в торговой зоне, не только начального, но и каждого после зоны флета. По умолчанию - только сигнал начала восходящей/нисходящей зоны.
Стратегия имеет оповещения для "бычьего" и "медвежьего" движения.
👉 Используйте оповещения - "Только при вызове функции alert()".
По любым вопросам Вы можете написать мне в личные сообщения или по контактам в моей подписи.

SMH_DualMomentum (ROC + Volume Trend)SMH Dual Momentum (ROC + Volume Confirmation)
This indicator identifies high-quality bullish trends by combining price momentum (Rate of Change) with volume confirmation, and exits when momentum structurally fails.
Core Logic
BUY signal
Rate of Change (ROC) over N periods is above a positive threshold (strong upside momentum)
Current volume is above its moving average (rising market participation)
SELL signal
ROC crosses below zero, indicating loss of bullish momentum
Why It Works
ROC measures the speed and strength of price movement, filtering out weak or drifting trends
Volume confirmation ensures momentum is supported by real capital flow, reducing false breakouts
Momentum-based exit avoids prolonged drawdowns and capital stagnation
Key Advantages
Focuses on trend continuation, not prediction
Filters out low-quality price moves and range-bound markets
Captures long, high-conviction trends with relatively few trades
Simple, robust rules using only price and volume
Best Use Cases
Designed for trend-driven ETFs such as SMH (Semiconductors)
Suitable for swing to position trading on daily charts
Works best in markets with strong sector rotation and institutional participation
Notes
This is a trend-following momentum tool, not a mean-reversion indicator
No stop-loss is built in; risk management should be handled externally if required
Parameters can be adjusted to match different timeframes or assets

D.Y Volume Swing Strategy📌 Summary of the Daniel.Yer Volume Strategy
This strategy is based on identifying the "opening volume peak" at the start of each trading day, using a user-defined sampling window.
After the sampling period ends, the strategy looks for breakouts above the daily high or below the daily low, provided they occur with a strong high-volume candle that meets the user-set threshold.
When a breakout appears in one direction, the strategy waits for an opposite-direction confirmation candle (Reversal Confirmation) and then enters a smart counter-breakout trade.
Each trade includes dynamic Stop-Loss and Take-Profit levels calculated from recent price structure, with the option to multiply stop distance according to user preference.
The strategy also gives full control over entering long only, short only, or both, as well as choosing whether trades occur exclusively from the high/low or without restrictions.
The strategy can be tested on any timeframe and evaluated across four trading directions:
✔ Buy from High
✔ Sell from High
✔ Buy from Low
✔ Sell from Low

volume rsi strategy by pro trader123this strategy includes volume and rsi and plots a buy signal when rsi is below 30 with high average volume and takes profit when the rsi 14 ema crosses rsi

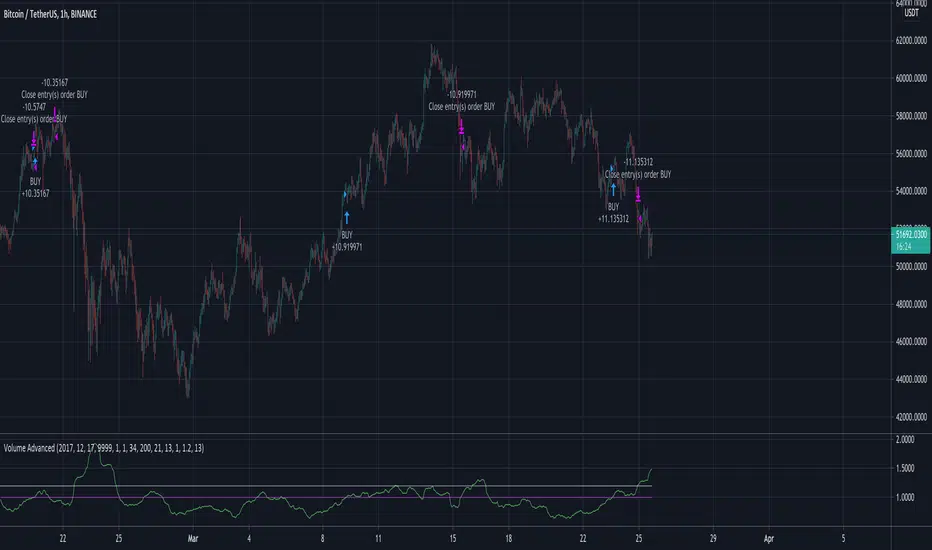
Volume AdvancedI have found out this script some time ago. In fact it is not my code (just have modified a little) and I don't know the author (couldn't find). So now I would like to share with the community, maybe somebody would have some idea how to make it better. The script itself is modified volatility oscillator (like ATR) based on volume, making a deal at the moment of price change. To recognize the current trend I have add simple function just to compare the current price with the N bars before, because sometimes in moments of high volatility there may be wrong signals.
Volume Weighted Bollinger Bands Strategy
Simple strategy,
Using Volume weighted Bollinger Bands
> Directions for Usage:
1. Use only in scripts where volume is specified by tradingview
2. Check on which timeframe the script has a profit factor greater than 1.4
3. Use that timeframe for profitability
4. In some high liquid securities there is a decent profit factor even at 5 min scale (optimise at your end!! all i want to say)
Enjoy!
Hope this helps!!

Volume and Price Moving average StrategyNAME : Volume and Price Moving average Strategy
SUMMARY
Long when Indicator >= BuyandSell
Short when Indicator < BuyandSell
It is an index created by combining the moving average of trading volume and price.
To avoid future reference, you must set the Candle Chart time and Resolution Time equally.
If you set it differently, there is a gap in yield due to future reference.
For MA Type and MA period, it is to select what the moving average of the price will be set to.
For Indicator Value, it is about the set value of this indicator.
Price Type is what to use for price. Market price, low price, closing price, high price, typical price (market price + high price + low price) / 3, center (market price + high price) / 2
There are six types.
BuyandSell is to set the index value to enter and clear. The default is 0.
Although it can be set to 0 or more, there is a risk of over-optimization.
As you can see from the profit curve, Bitcoin is a good strategy that works well when volatility is high.
MDD is too large to operate with this indicator alone, so it would be good to use it with other indicators.
If you leave a good indicator comment, I'll test it. Thank you.
==========================
Korean
거래량과 가격의 이동평균을 조합하여 만든 지표입니다.
미래참조를 피하기 위해서는 반드시 캔들 차트의 시간과, Resolution Time을 똑같이 설정해야 합니다.
다르게 설정할 경우 미래참조로 인한 수익률 괴리가 생기니 꼭 똑같이 설정해주세요.
MA Type, MA period의 경우 가격의 이동평균을 무엇으로 설정할 것인지 선택하는 것 입니다.
Indicator Value의 경우 이 지표의 설정 값에 대한 것입니다.
Price Type은 가격으로 무엇을 사용할 것인지 입니다. 시가, 저가, 종가, 고가, Typical Price (시가+고가+저가)/3, Center(시가+고가)/2
이렇게 6종류가 있습니다.
BuyandSell은 진입, 청산할 지표값을 세팅하는 것입니다. 기본값 0입니다.
0이상, 이하로도 설정할 수 있지만, 그렇게 할 경우 과최적화의 위험이 있습니다.
수익 곡선을 보시면 아시겠지만 비트코인이 변동성이 클 때 잘 먹히는 좋은 전략입니다.
이 지표만으로는 MDD가 너무 커서 운용하기 힘드니 다른 지표와 같이 활용하시면 좋을 것 같습니다.
좋은 지표 코멘트로 남겨주시면 테스트 해보겠습니다. 감사합니다.

High Gain Volume Strategy Only 2 Candles The result after having a good wine...
Data with reliable volume required.
to enjoy!
Breton Composite BTC Volume -turningpoint -strategyComposite BTCUSD Volume strategy compiled from 9 different exchanges, attempting to isolate turning points by trading on volume spikes and bag holding bars

CS Basic Script: Customizable Volume Based Trading (Strategy)Customizable Volume Based Strategy Script that includes the Following Inputs:
- Custom Backtesting Date Range
- Optional Trailing Stop Loss
- Select the Volume Strategy Types (Crossing EMA, SMA, WMA, & Lookback)
- Adjust the MA Volume Range
- Automate with the Autoview Trading Bot
Strategy script may be tested by favoriting and adding to any chart.
Study script is available for automated trading at www.cryptoscores.org

Klinger Volume Oscillator (KVO) Backtest The Klinger Oscillator (KO) was developed by Stephen J. Klinger. Learning
from prior research on volume by such well-known technicians as Joseph Granville,
Larry Williams, and Marc Chaikin, Mr. Klinger set out to develop a volume-based
indicator to help in both short- and long-term analysis.
The KO was developed with two seemingly opposite goals in mind: to be sensitive
enough to signal short-term tops and bottoms, yet accurate enough to reflect the
long-term flow of money into and out of a security.
The KO is based on the following tenets:
Price range (i.e. High - Low) is a measure of movement and volume is the force behind
the movement. The sum of High + Low + Close defines a trend. Accumulation occurs when
today's sum is greater than the previous day's. Conversely, distribution occurs when
today's sum is less than the previous day's. When the sums are equal, the existing trend
is maintained.
Volume produces continuous intra-day changes in price reflecting buying and selling pressure.
The KO quantifies the difference between the number of shares being accumulated and distributed
each day as "volume force". A strong, rising volume force should accompany an uptrend and then
gradually contract over time during the latter stages of the uptrend and the early stages of
the following downtrend. This should be followed by a rising volume force reflecting some
accumulation before a bottom develops.
You can change long to short in the Input Settings
Please, use it only for learning or paper trading.

Volatility Finite Volume Elements Strategy The FVE is a pure volume indicator. Unlike most of the other indicators
(except OBV), price change doesn?t come into the equation for the FVE
(price is not multiplied by volume), but is only used to determine whether
money is flowing in or out of the stock. This is contrary to the current trend
in the design of modern money flow indicators. The author decided against a
price-volume indicator for the following reasons:
- A pure volume indicator has more power to contradict.
- The number of buyers or sellers (which is assessed by volume) will be the same,
regardless of the price fluctuation.
- Price-volume indicators tend to spike excessively at breakouts or breakdowns.
This study is an addition to FVE indicator. Indicator plots different-coloured volume
bars depending on volatility.
You can change long to short in the Input Settings
Please, use it only for learning or paper trading. Do not
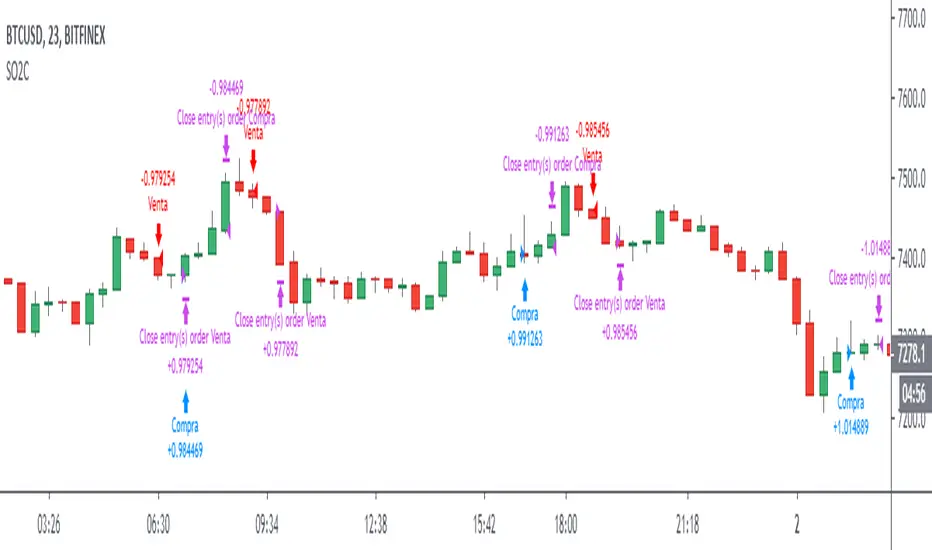
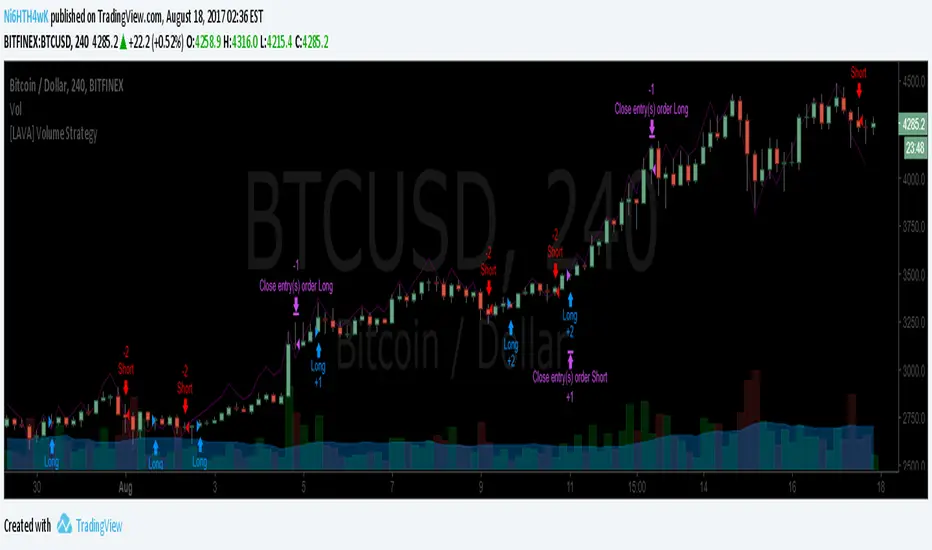
[LAVA] Volume StratA volume strategy indicator based off the size of the individual volume candles. Backtest to figure out which method works the best for your chart. A higher Profit Factor is what you want to look for since you want to trade less with better results for an overall lower commissioning fee.
Also, please contact me if there is any other indicator you would be interested in seeing as a strategy. I can do them all.
Please send your donation to any of the following addresses. Don't forget to add your TV name to the message when donating so that I can unlock the script for you. You can also send me a pm with your donation amount.
BTC: 1EabcghxBLZmGKHmKEP9W6S5ZSKeG4wLFA
BCH: 1M4QS5HE82Mk17ghKhaDeaXinL9CkLnhhR
LTC: LYaGjVAXGSLgTNiH7FbceP7ny4F4U8KWyN
ETH: 0x836ced779a10975248f847cad033c405a639b565
DASH: XhQexkwQUyDbvX4Xw78FHnxPvEsyRJYFqv
Click here for more information on these various cryptocurrencies listed above and others.
Relative Volume & RSI PopThis is a basic idea/script designed to take a breakout trade by taking advantage of volume spikes when price/strength is extended (either long or short).
The script only utilises two indicators, the Relative Volume (RV) and the Relative Strength Index (RSI). The script allows the user to select a RSI value between 69 up to 100 for a long trade and between 35 down to 0 for short trade and then pair this with RV from 0 - 10. The period for both the RSI and RV can also be amended by the user but I found in most cases there was no benefit gained by changing away from normal "14" period lookback. The script typically only has small draw downs as the script is designed to exit the trade when the RSI returns back to "normalised" level, therefore the trades are generally quite short. The exit condition for a long trade is when RSI crosses back below 69 (which is why you cannot enter a long below this value) and for a short the, trade will close when RSI crosses back above 35 (which is why you cannot enter a short above this value). These exit values are locked.
By allowing RSI value to go all the way up to "100" on the long side and "0" on the short side this in effect is a way of eliminating the script from taking either longs or shorts if lets say you wanted to back test the script for long only spikes or short only spike. E.G. By setting RSI upper value to "75" the RV to "1" and RSI lower value to "0" then no short trades will not be taken in your back test as the RSI never really gets down to zero.
I put this together with meme stocks in mind and back tested it on day charts for AMC and then a few trending style stocks too. It typically worked best as long only and with RSI settings between 71 - 75 and RV at 1 or 1.5. I also found it had okay results on some lower 1hr timeframe futures markets and weekly time frames too (albeit trades were few and far between on weekly timeframe).
The beauty of such a basic script you could easily set up a trading view screener to look for these opportunities everyday and perhaps even add in an ADX filter on the screener to see if the trend is increasing. Then use this script to run a back test on the stocks that you've selected from the screener.

Powertrend - Volume Range Filter Strategy [wbburgin]The Powertrend is a range filter that is based off of volume, instead of price. This helps the range filter capture trends more accurately than a price-based range filter, because the range filter will update itself from changes in volume instead of changes in price. In certain scenarios this means that the Powertrend will be more profitable than a normal range filter.
Essentials of the Strategy
This is a breakout strategy which works best on trending assets with high volume and liquidity. It should be used on middle to higher timeframes and can be used on all assets that have volume provided by the data source (stocks, crypto, forex). It is long-only as of now. It can work on lower timeframes if you optimize the strategy filters to make less trades or if your exchange/broker is low/no fees, provided that your exchange/broker has high liquidity and volume.
The strategy enters a long position if the range filter is trending upwards and the price crosses over the upper range band, which signifies a price-volume breakout. The strategy closes the long position if the range filter is trending downwards and the price crosses under the lower range band, which signifies a breakdown. Both these conditions can be altered by the three filter options in the settings. The default trend filter is not alterable because it helps prevent false entries and exits that are against the trend.
Settings
The Length setting is the lookback period for the range smoothing.
The ADX Filter setting enables you to turn on an ADX filter, which will halt entries and exits unless the ADX of your customizable length is above a ADX VWMA of that length.
The Range Supertrend setting creates a supertrend from the top and bottom ranges, which can be used to filter entries and exits. The length is customizable. The filter can show you whether the range is making higher highs and lower lows. Below is an example of the Range Supertrend being used as a filter and plotted on-chart:
The VWMA setting halts entries if they are below a customizable length VWMA.
Both the Range Supertrend and the VWMA can also be plotted separately without actually filtering the strategy, so that you can use them independently if you wish. You can turn off the bar color, the highlighting, and the labels if you wish in the settings. A note about the bar color: if the color changes but the strategy does not signal an exit or entry this means that the crossover was against the trend. In these circumstances it may be indicative of a pullback to enter or exit or to add onto your position.
About the Strategy Results Below
A range filter is normally composed of two components - the range filter itself and a smoothing function. In the development of this script I tested both normal and volume-based varieties of the range filter and the smoothing function:
Tests Performed
Volume-based Range x VWMA smoothing
Price-based Range x VWMA smoothing
Price-based Range x EMA smoothing
Volume-based Range x EMA smoothing (final result)
The highest-performing was a volume-based range filter and a normal EMA-based smoothing function, but that does not mean that this strategy will be profitable - exits are based off of signal reversion so I strongly encourage you to develop your own take profits/stop losses for the strategy if you think it may be a good fit for you. The results below are with a commission value of 0.05% (because I built the strategy first for equities), slippage of 3, so if your exchange/broker has a higher fee schedule, I recommend adding filters and/or moving to higher timeframes for the strategy. Additionally, I used 10% of equity in each trade, while using the Range Supertrend filter (the previous upload was unrealistic because it used 100% of equity - missed a 0, apologies, and added in slippage).
