Volume in Base CurrencyShows the volume in USD, EUR, etc (whatever the base currency is for the asset) instead of number of stocks, bitcoins, etc.
在脚本中搜索"volume"

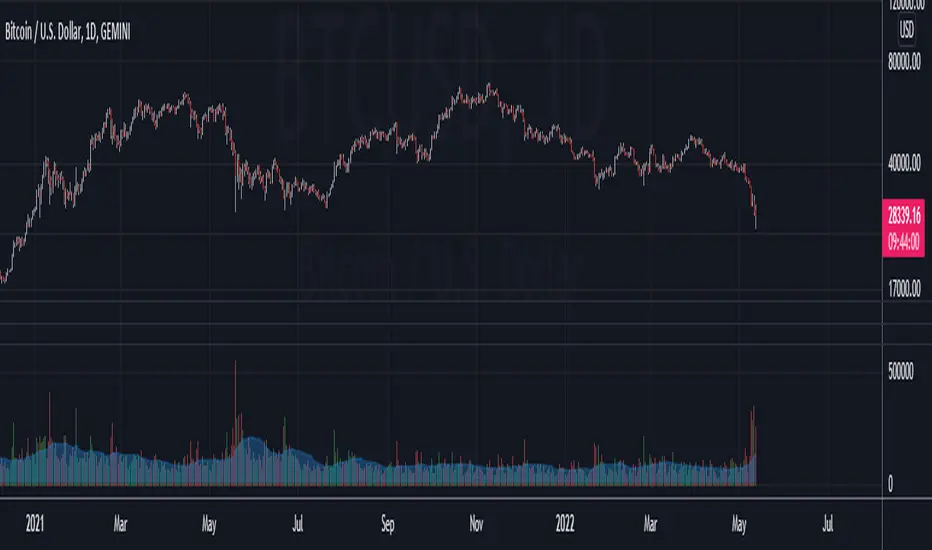
Volume Sum BTC This indicator sums the bitcoin volume of the following tickers and shows the total volume as sum:
Binance:BTCUSDT
Coinbase:BTCUSD
FTX:BTCUSD
Kraken:BTCUSD
Gemini:BTCUSD
It helps to see the real volume taking place in the bitcoin market.
The code is open source so you can modify and/or add other tickers as you wish.
Volume BB Dollars Display Volume contract wise or dollar wise.
Display Sma colored based on its own slope.
Display 6 Colors based on Bollinger Bands.

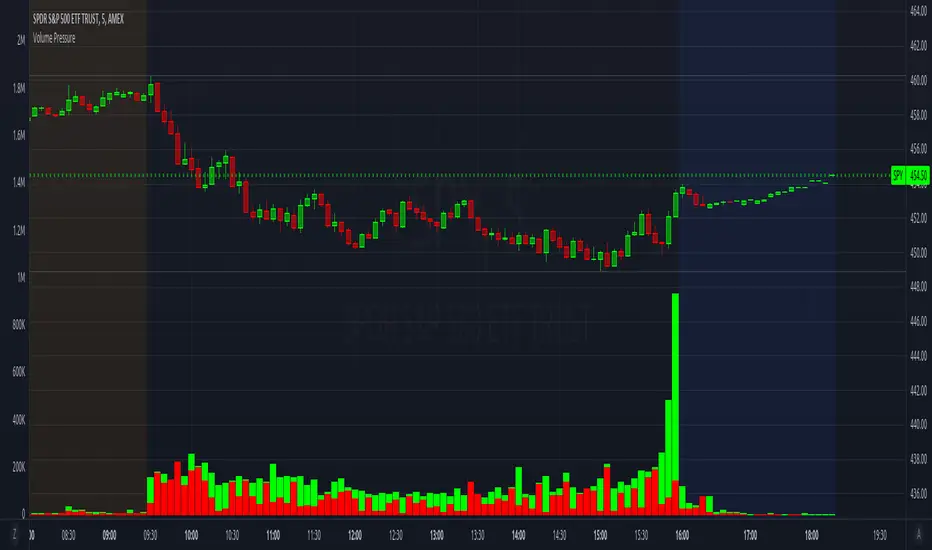
Volume PressureBreaks down volume into buyers (green part) vs sellers (red part).
It is recommended to set the volume's scale, especially if you switch tickers on the same chart. Follow these steps:
Select the Volume Pressure indicator's 3 dots (...)
Select Pin To Scale
Select a separate scale from the main chart, such as Pin To New Left Scale (Z)
Left click and hold the scale on the side of the chart and drag it up/down to bring the volume bars into the desired area
To update to the latest version, just close the indicator and add it again.
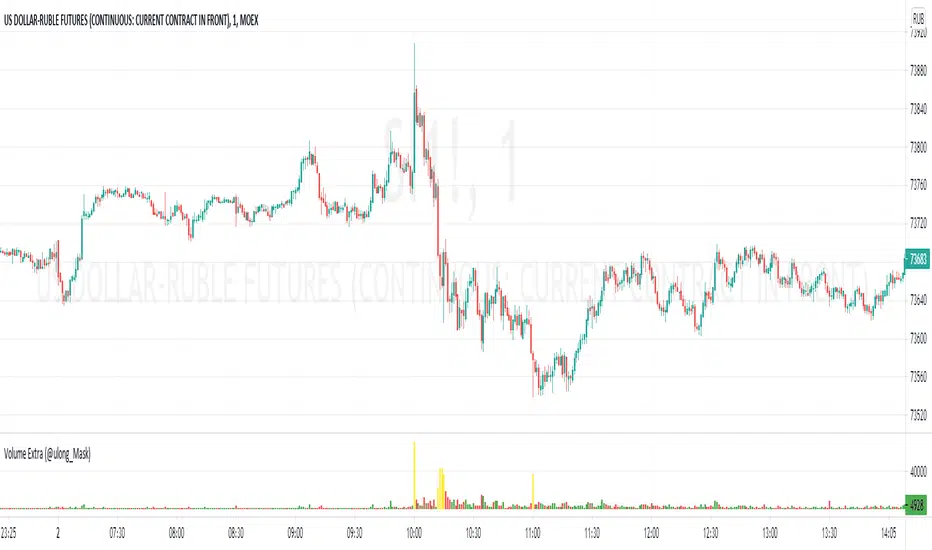
VolumeSimple and straightforward indicator. Includes - volume for Ethereum and Bitcoin to US dollar .
7 exchanges are connected:
-BINANCEUS:BTCUSD
-FTX:BTCUSD
-COINBASE:BTCUSD
-KRAKEN:XBTUSD
-GEMINI:BTCUSD
-BITFINEX:BTCUSD
-BITSTAMP:BTCUSD
Additionally, the calculation of average indicators and the amount (bull / bear separately) for a certain length is built-in.
If I missed data exchanges - write in the comments. Thank you.

Volume distance to new volume ATH This one lights up if the distance from volume ATH continues to become smaller.
Flips from color to white are a sign of trend decay/change and could be used as an exit signal or entry signal.
3rd part of the alchemy indicator.

Volume Rate of Change Histogram - LayeringShows acceleration or deceleration in volume, to be used with Volume MA, preferably overlapped

Volume ROC by Mike SierraRate of change of volume over the past few bars can be a leading indicator to price action

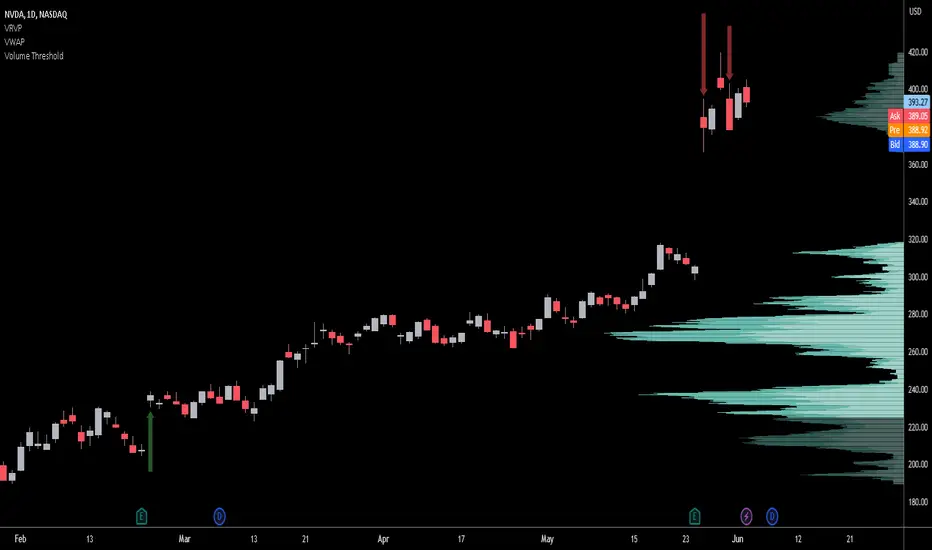
Volume ThresholdIndicates Volume breakouts over an configurable threshold by drawing arrows.
Higher volume breakouts are indicated by longer arrows. breakdowns by down arrows...
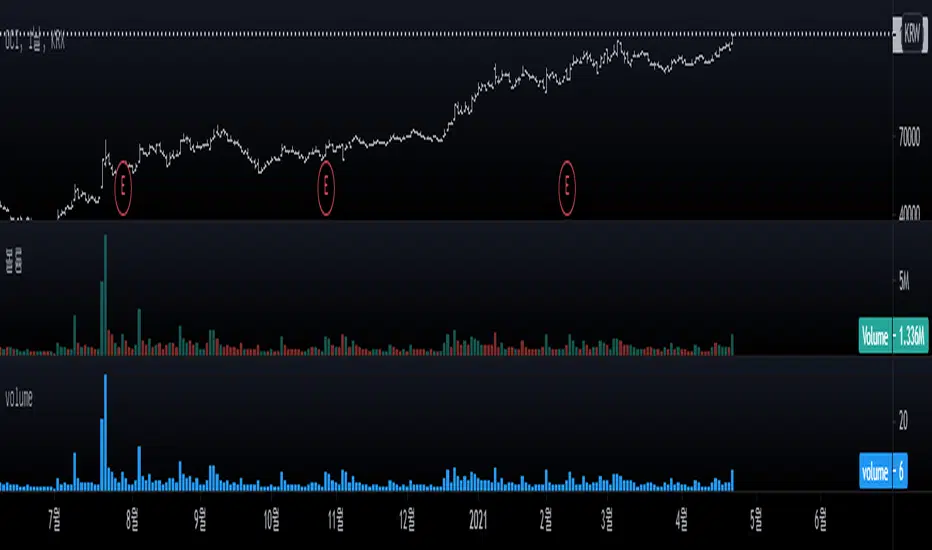
Volume outstanding shares거래량 / 발행주식 *100
volume / outstanding shares *100
When a trading volume exceeds the number of outstanding shares, this means a trading catalyst has occurred.

Volume Spike RSIFollow up to Volume Spike Strategy.
This script calculates volume spikes (e.g. volume is 3 times greater than average volume) and signals them in overbought or oversold areas (RSI).
Credit to “Capitalize AI: Volume Spike Strategy" by Bitcoin Trading Challenge for the original idea.
Tested on XBTUSD 1 minute chart

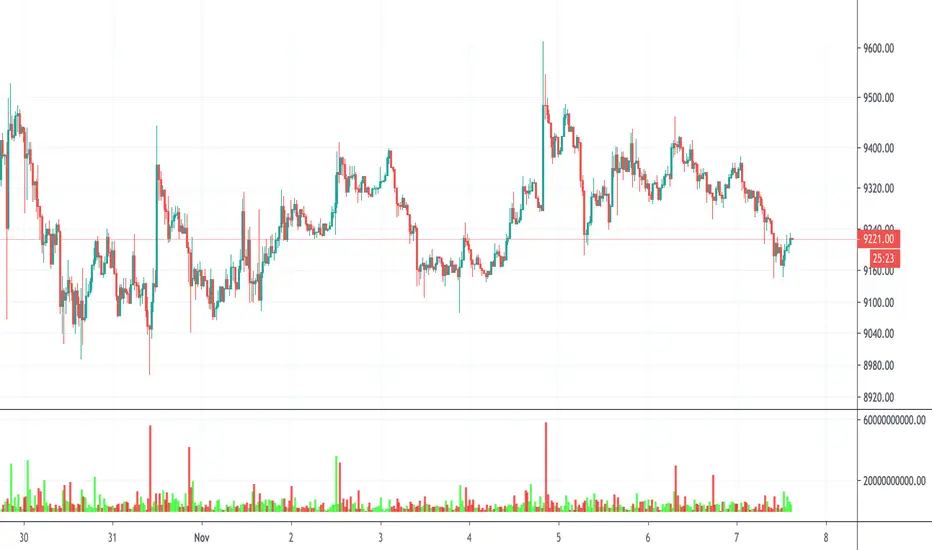
Volume BalanceThe indicator colors the volume bars in two colors to display the Bullish and Bearish power.
There is two option of the indicator view. The first is the classic one. And the second is to show the Bullish and Bearish power separately.

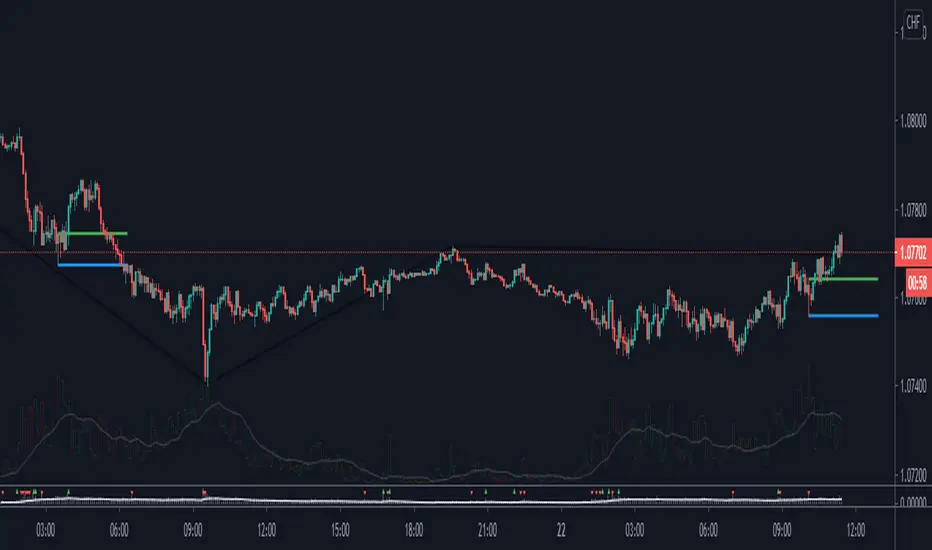
Volume HighThis is a collab script with kisshore19 to identify the highest volume candle on the chart each day and mark the highs and lows of that candle.

Volume comparison
The rate of increase / decrease in the volume of BITMEX, BYBIT, BINANCE and FINEX is displayed.

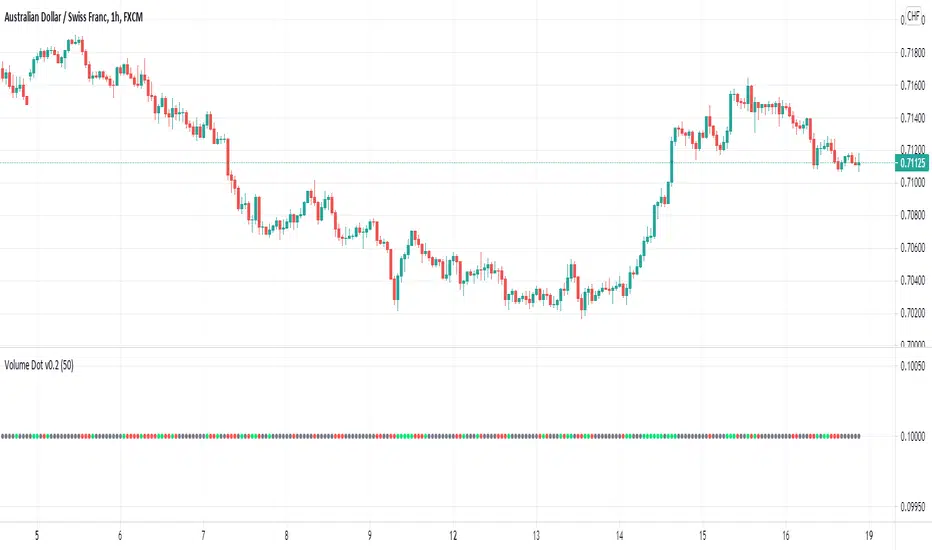
Volume Direction Force Index v1 - VDFI [wm]Essentially the same as TDFI. However, uses volume rather than price as the source data
Above filter high indicates increase in volume
Above filter low indicates drop off in volume
Orig TDFI:

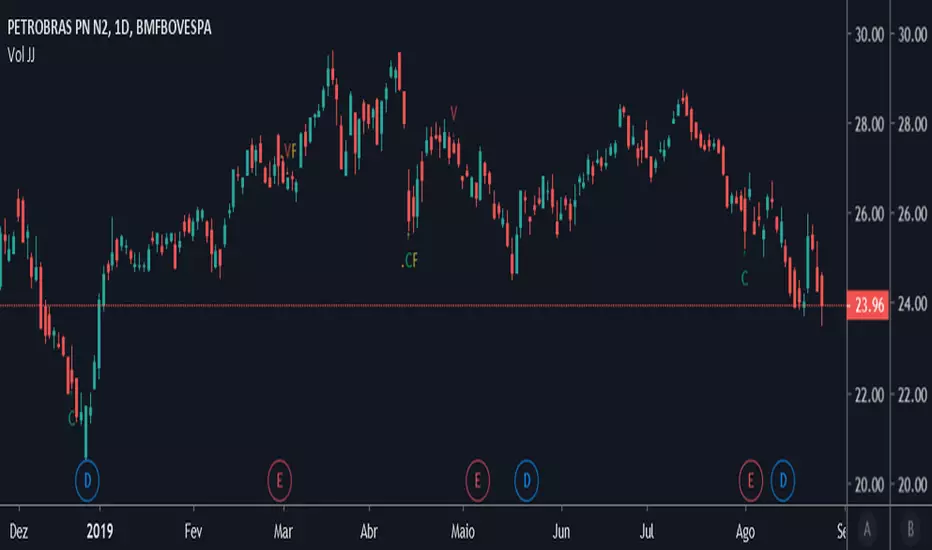
Volume JJEstudo baseado no volume
Se superar o dobro da EMA 21 Compra
Se não superar a metade da EMA 21 Venda
Se superar o triplo da EMA 21 Compra Forte
Se não superar um terço da EMA 21 Venda Forte

Volume CandleHighlight significant Candles, i.e. those candles that carry volume above the average volume of the chosen period by the chose proportion.
The value=1.25 with period=20 will highlight candles with volume 125% above the volume average for the last 20 candles.
