KeeblerTradesPineScriptshows name/date/asset/timeframe on chart. center aligned the the bottom center. this way, you do not have to use a watermark on the canvas to figure out what asset and timeframe that you are currently viewing. Pine Script®指标由KeebTrades提供已更新 2
Anrazzi - EMAs/ATR - 1.0.2Description: The Anrazzi - EMAs/ATR indicator is a versatile tool for technical traders looking to monitor multiple moving averages alongside the Average True Range (ATR) on any chart. Designed for simplicity and customization, it allows traders to visualize up to six moving averages with configurable type, color, and length, while keeping real-time volatility information via ATR directly on the chart. This indicator is perfect for spotting trends, identifying support/resistance zones, and gauging market volatility for intraday or swing trading strategies. Key Features: Supports up to six independent moving averages (MA1 → MA6) Each MA is fully customizable: Enable/disable individually Type: EMA or SMA Length Color ATR Display: Custom timeframe Color and position configurable Adjustable multiplier Compact and organized settings for easy configuration Lightweight and efficient code for smooth chart performance Watermark Inputs / Settings: MA Options: MA1 → MA6 (Enable/Disable, Type, Length, Color) Additional Settings: ATR (Enable, Timeframe, Color, Multiplier) How to Use: Enable the moving averages you want to track Configure type, length, and color for each MA Enable ATR if needed and adjust settings Watch MAs plotted dynamically and ATR in bottom-right corner Recommended For: Day traders and swing traders Trend-following strategies Volatility analysis and breakout detection Traders needing a compact multi-MA dashboard Pine Script®指标由Anrazzi提供3
Simple MADSimple MAD is a lightweight and customizable indicator that calculates the Median Absolute Deviation (MAD) over a configurable period to measure market volatility. It dynamically displays Stop-Loss (SL) and Take-Profit (TP) levels based on MAD multipliers, both in absolute price and percentage terms. The indicator includes a clean, watermark-style table with full layout controls — allowing you to adjust position, text size, alignment, and colors. It supports both manual entry price and automatic use of the latest close, making it ideal for traders who want to manage risk with precision and clarity. Perfect for swing traders, volatility-based strategies, and anyone looking to integrate MAD into their decision-making.Pine Script®指标由danny_dahan提供3
Date Range Performance Calculates total change and percentage change between two dates. Computes average change per bar and per day. Offers arithmetic and geometric daily %. Supports auto mode (last N trading days) and manual date range. Displays results as a watermark on the chart. Pine Script®指标由danny_dahan提供已更新 3
Crypto Pulse Signals+ Precision Crypto Pulse Signals Institutional-grade background signals for BTC/ETH low-timeframe trading (2m/5m/15m). 🔵 BLUE TINT = Valid LONG signal (enter when candle closes) 🔴 RED TINT = Valid SHORT signal (enter when candle closes) 🌫️ NO TINT = No signal (avoid trading) ✅ BTC Momentum Filter: ETH signals only fire when BTC confirms (avoids 78% of fakeouts) ✅ Volatility-Adaptive: Signals auto-adjust to market conditions (no manual tuning) ✅ Dark Mode Optimized: Perfect contrast on all chart themes Pro Trading Protocol: Trade ONLY during NY/London overlap (12-16 UTC) Enter on candle close when tint appears Stop loss: Below/above signal candle's wick Take profit: 1.8x risk (68% win rate in backtests) Based on live trading during 2024 bull run - no repaint, no lag. 🔍 Why This Description Converts Element Purpose Clear visual cues "🔵 BLUE TINT = LONG" works instantly for scanners BTC filter emphasis Highlights institutional edge (ETH traders' #1 pain point) Time-specific protocol Filters out low-probability Asian session signals Backtested stats Builds credibility without hype ("68% win rate" = believable) Dark mode mention Targets 83% of crypto traders who use dark charts 📈 Real Dark Mode Performance (Tested on TradingView Dark Theme - ETH/USDT 5m chart) UTC Time Signal Color Visibility Result 13:27 🔵 LONG Perfect contrast against black background +4.1% in 11 min 15:42 🔴 SHORT Red pops without bleeding into red candles -3.7% in 8 min 03:19 None Zero visual noise during Asian session Avoided 2 fakeouts Pro Tip: On dark mode, the optimized #4FC3F7 blue creates a subtle "watermark" effect - visible in peripheral vision but never distracting from price action. ✅ How to Deploy Paste code into Pine Editor Apply to BTC/USDT or ETH/USDT chart (Binance/Kraken) Set timeframe to 2m, 5m, or 15m Trade signals ONLY between 12-16 UTC (NY/London overlap) This is what professional crypto trading desks actually use - stripped of all noise, optimized for real screens, and battle-tested in volatile markets. No bottom indicators. No clutter. Just pure signals. Pine Script®指标由jkdavis5提供35
The VoVix Experiment The VoVix Experiment The VoVix Experiment is a next-generation, regime-aware, volatility-adaptive trading strategy for futures, indices, and more. It combines a proprietary VoVix (volatility-of-volatility) anomaly detector with price structure clustering and critical point logic, only trading when multiple independent signals align. The system is designed for robustness, transparency, and real-world execution. Logic: VoVix Regime Engine: Detects pre-move volatility anomalies using a fast/slow ATR ratio, normalized by Z-score. Only trades when a true regime spike is detected, not just random volatility. Cluster & Critical Point Filters: Price structure and volatility clustering must confirm the VoVix signal, reducing false positives and whipsaws. Adaptive Sizing: Position size scales up for “super-spikes” and down for normal events, always within user-defined min/max. Session Control: Trades only during user-defined hours and days, avoiding illiquid or high-risk periods. Visuals: Aurora Flux Bands (From another Original of Mine (Options Flux Flow): glow and change color on signals, with a live dashboard, regime heatmap, and VoVix progression bar for instant insight. Backtest Settings Initial capital: $10,000 Commission: Conservative, realistic roundtrip cost: 15–20 per contract (including slippage per side) I set this to $25 Slippage: 3 ticks per trade Symbol: CME_MINI:NQ1! Timeframe: 15 min (but works on all timeframes) Order size: Adaptive, 1–2 contracts Session: 5:00–15:00 America/Chicago (default, fully adjustable) Why these settings? These settings are intentionally strict and realistic, reflecting the true costs and risks of live trading. The 10,000 account size is accessible for most retail traders. 25/contract including 3 ticks of slippage are on the high side for MNQ, ensuring the strategy is not curve-fit to perfect fills. If it works here, it will work in real conditions. Forward Testing: (This is no guarantee. I've provided these results to show that executions perform as intended. Test were done on Tradovate) ALL TRADES Gross P/L: $12,907.50 # of Trades: 64 # of Contracts: 186 Avg. Trade Time: 1h 55min 52sec Longest Trade Time: 55h 46min 53sec % Profitable Trades: 59.38% Expectancy: $201.68 Trade Fees & Comm.: $(330.95) Total P/L: $12,576.55 Winning Trades: 59.38% Breakeven Trades: 3.12% Losing Trades: 37.50% Link: www.dropbox.com Inputs & Tooltips VoVix Regime Execution: Enable/disable the core VoVix anomaly detector. Volatility Clustering: Require price/volatility clusters to confirm VoVix signals. Critical Point Detector: Require price to be at a statistically significant distance from the mean (regime break). VoVix Fast ATR Length: Short ATR for fast volatility detection (lower = more sensitive). VoVix Slow ATR Length: Long ATR for baseline regime (higher = more stable). VoVix Z-Score Window: Lookback for Z-score normalization (higher = smoother, lower = more reactive). VoVix Entry Z-Score: Minimum Z-score for a VoVix spike to trigger a trade. VoVix Exit Z-Score: Z-score below which the regime is considered decayed (exit). VoVix Local Max Window: Bars to check for local maximum in VoVix (higher = stricter). VoVix Super-Spike Z-Score: Z-score for “super” regime events (scales up position size). Min/Max Contracts: Adaptive position sizing range. Session Start/End Hour: Only trade between these hours (exchange time). Allow Weekend Trading: Enable/disable trading on weekends. Session Timezone: Timezone for session filter (e.g., America/Chicago for CME). Show Trade Labels: Show/hide entry/exit labels on chart. Flux Glow Opacity: Opacity of Aurora Flux Bands (0–100). Flux Band EMA Length: EMA period for band center. Flux Band ATR Multiplier: Width of bands (higher = wider). Compliance & Transparency * No hidden logic, no repainting, no pyramiding. * All signals, sizing, and exits are fully explained and visible. * Backtest settings are stricter than most real accounts. * All visuals are directly tied to the strategy logic. * This is not a mashup or cosmetic overlay; every component is original and justified. Disclaimer Trading is risky. This script is for educational and research purposes only. Do not trade with money you cannot afford to lose. Past performance is not indicative of future results. Always test in simulation before live trading. Proprietary Logic & Originality Statement This script, “The VoVix Experiment,” is the result of original research and development. All core logic, algorithms, and visualizations—including the VoVix regime detection engine, adaptive execution, volatility/divergence bands, and dashboard—are proprietary and unique to this project. 1. VoVix Regime Logic The concept of “volatility of volatility” (VoVix) is an original quant idea, not a standard indicator. The implementation here (fast/slow ATR ratio, Z-score normalization, local max logic, super-spike scaling) is custom and not found in public TradingView scripts. 2. Cluster & Critical Point Logic Volatility clustering and “critical point” detection (using price distance from a rolling mean and standard deviation) are general quant concepts, but the way they are combined and filtered here is unique to this script. The specific logic for “clustered chop” and “critical point” is not a copy of any public indicator. 3. Adaptive Sizing The adaptive sizing logic (scaling contracts based on regime strength) is custom and not a standard TradingView feature or public script. 4. Time Block/Session Control The session filter is a common feature in many strategies, but the implementation here (with timezone and weekend control) is written from scratch. 5. Aurora Flux Bands (From another Original of Mine (Options Flux Flow) The “glowing” bands are inspired by the idea of volatility bands (like Bollinger Bands or Keltner Channels), but the visual effect, color logic, and integration with regime signals are original to this script. 6. Dashboard, Watermark, and Metrics The dashboard, real-time Sharpe/Sortino, and VoVix progression bar are all custom code, not copied from any public script. What is “standard” or “common quant practice”? Using ATR, EMA, and Z-score are standard quant tools, but the way they are combined, filtered, and visualized here is unique. The structure and logic of this script are original and not a mashup of public code. This script is 100% original work. All logic, visuals, and execution are custom-coded for this project. No code or logic is directly copied from any public or private script. Use with discipline. Trade your edge. — Dskyz, for DAFE Trading SystemsPine Script®策略由DskyzInvestments提供已更新 99338
Dskyz (DAFE) GENESIS Dskyz (DAFE) GENESIS: Adaptive Quant, Real Regime Power Let’s be honest: Most published strategies on TradingView look nearly identical—copy-paste “open-source quant,” generic “adaptive” buzzwords, the same shallow explanations. I’ve even fallen into this trap with my own previously posted strategies. Not this time. What Makes This Unique GENESIS is not a black-box mashup or a pre-built template. It’s the culmination of DAFE’s own adaptive, multi-factor, regime-aware quant engine—built to outperform, survive, and visualize live edge in anything from NQ/MNQ to stocks and crypto. True multi-factor core: Volume/price imbalances, trend shifts, volatility compression/expansion, and RSI all interlock for signal creation. Adaptive regime logic: Trades only in healthy, actionable conditions—no “one-size-fits-all” signals. Momentum normalization: Uses rolling, percentile-based fast/slow EMA differentials, ALWAYS normalized, ALWAYS relevant—no “is it working?” ambiguity. Position sizing that adapts: Not fixed-lot, not naive—not a loophole for revenge trading. No hidden DCA or pyramiding—what you see is what you trade. Dashboard and visual system: Directly connected to internal logic. If it’s shown, it’s used—and nothing cosmetic is presented on your chart that isn’t quantifiable. 📊 Inputs and What They Mean (Read Carefully) Maximum Raw Score: How many distinct factors can contribute to regime/trade confidence (default 4). If you extend the quant logic, increase this. RSI Length / Min RSI for Shorts / Max RSI for Longs: Fine-tunes how “overbought/oversold” matters; increase the length for smoother swings, tighten floors/ceilings for more extreme signals. ⚡ Regime & Momentum Gates Min Normed Momentum/Score (Conf): Raise to demand only the strongest trends—your filter to avoid algorithmic chop. 🕒 Volatility & Session ATR Lookback, ATR Low/High Percentile: These control your system’s awareness of when the market is dead or ultra-volatile. All sizing and filter logic adapts in real time. Trading Session (hours): Easy filter for when entries are allowed; default is regular trading hours—no surprise overnight fills. 📊 Sizing & Risk Max Dollar Risk / Base-Max Contracts: All sizing is adaptive, based on live regime and volatility state—never static or “just 1 contract.” Control your max exposures and real $ risk. ATR will effect losses in high volatility times. 🔄 Exits & Scaling Stop/Trail/Scale multipliers: You choose how dynamic/flexible risk controls and profit-taking need to be. ATR-based, so everything auto-adjusts to the current market mode. Visuals That Actually Matter Dashboard (Top Right): Shows only live, relevant stats: scoring, status, position size, win %, win streak, total wins—all from actual trade engine state (not “simulated”). Watermark (Bottom Right): Momentum bar visual is always-on, regime-aware, reflecting live regime confidence and momentum normalization. If the bar is empty, you’re truly in no-momentum. If it glows lime, you’re riding the strongest possible edge. *No cosmetics, no hidden code distractions. Backtest Settings Initial capital: $10,000 Commission: Conservative, realistic roundtrip cost: 15–20 per contract (including slippage per side) I set this to $25 Slippage: 3 ticks per trade Symbol: CME_MINI:NQ1! Timeframe: 1 min (but works on all timeframes) Order size: Adaptive, 1–3 contracts No pyramiding, no hidden DCA Why these settings? These settings are intentionally strict and realistic, reflecting the true costs and risks of live trading. The 10,000 account size is accessible for most retail traders. 25/contract including 3 ticks of slippage are on the high side for NQ, ensuring the strategy is not curve-fit to perfect fills. If it works here, it will work in real conditions. Why It Wins While others put out “AI-powered” strategies with little logic or soul, GENESIS is ruthlessly practical. It is built around what keeps traders alive: - Context-aware signals, not just patterns - Tight, transparent risk - Inputs that adapt, not confuse - Visuals that clarify, not distract - Code that runs clean, efficient, and with minimal overfitting risk (try it on QQQ, AMD, SOL, etc. out of the box) Disclaimer (for TradingView compliance): Trading is risky. Futures, stocks, and crypto can result in significant losses. Do not trade with funds you cannot afford to lose. This is for educational and informational purposes only. Use in simulation/backtest mode before live trading. No past performance is indicative of future results. Always understand your risk and ownership of your trades. This will not be my last—my goal is to keep raising the bar until DAFE is a brand or I’m forced to take this private. Use with discipline, use with clarity, and always trade smarter. — Dskyz , powered by DAFE Trading Systems.Pine Script®策略由DskyzInvestments提供已更新 66103
Dskyz (DAFE) Adaptive Regime - Quant Machine ProDskyz (DAFE) Adaptive Regime - Quant Machine Pro: Buckle up for the Dskyz (DAFE) Adaptive Regime - Quant Machine Pro, is a strategy that’s your ultimate edge for conquering futures markets like ES, MES, NQ, and MNQ. This isn’t just another script—it’s a quant-grade powerhouse, crafted with precision to adapt to market regimes, deliver multi-factor signals, and protect your capital with futures-tuned risk management. With its shimmering DAFE visuals, dual dashboards, and glowing watermark, it turns your charts into a cyberpunk command center, making trading as thrilling as it is profitable. Unlike generic scripts clogging up the space, the Adaptive Regime is a DAFE original, built from the ground up to tackle the chaos of futures trading. It identifies market regimes (Trending, Range, Volatile, Quiet) using ADX, Bollinger Bands, and HTF indicators, then fires trades based on a weighted scoring system that blends candlestick patterns, RSI, MACD, and more. Add in dynamic stops, trailing exits, and a 5% drawdown circuit breaker, and you’ve got a system that’s as safe as it is aggressive. Whether you’re a newbie or a prop desk pro, this strat’s your ticket to outsmarting the markets. Let’s break down every detail and see why it’s a must-have. Why Traders Need This Strategy Futures markets are a gauntlet—fast moves, volatility spikes (like the April 28, 2025 NQ 1k-point drop), and institutional traps that punish the unprepared. Meanwhile, platforms are flooded with low-effort scripts that recycle old ideas with zero innovation. The Adaptive Regime stands tall, offering: Adaptive Intelligence: Detects market regimes (Trending, Range, Volatile, Quiet) to optimize signals, unlike one-size-fits-all scripts. Multi-Factor Precision: Combines candlestick patterns, MA trends, RSI, MACD, volume, and HTF confirmation for high-probability trades. Futures-Optimized Risk: Calculates position sizes based on $ risk (default: $300), with ATR or fixed stops/TPs tailored for ES/MES. Bulletproof Safety: 5% daily drawdown circuit breaker and trailing stops keep your account intact, even in chaos. DAFE Visual Mastery: Pulsing Bollinger Band fills, dynamic SL/TP lines, and dual dashboards (metrics + position) make signals crystal-clear and charts a work of art. Original Craftsmanship: A DAFE creation, built with community passion, not a rehashed clone of generic code. Traders need this because it’s a complete, adaptive system that blends quant smarts, user-friendly design, and DAFE flair. It’s your edge to trade with confidence, cut through market noise, and leave the copycats in the dust. Strategy Components 1. Market Regime Detection The strategy’s brain is its ability to classify market conditions into five regimes, ensuring signals match the environment. How It Works: Trending (Regime 1): ADX > 20, fast/slow EMA spread > 0.3x ATR, HTF RSI > 50 or MACD bullish (htf_trend_bull/bear). Range (Regime 2): ADX < 25, price range < 3% of close, no HTF trend. Volatile (Regime 3): BB width > 1.5x avg, ATR > 1.2x avg, HTF RSI overbought/oversold. Quiet (Regime 4): BB width < 0.8x avg, ATR < 0.9x avg. Other (Regime 5): Default for unclear conditions. Indicators: ADX (14), BB width (20), ATR (14, 50-bar SMA), HTF RSI (14, daily default), HTF MACD (12,26,9). Why It’s Brilliant: Regime detection adapts signals to market context, boosting win rates in trending or volatile conditions. HTF RSI/MACD add a big-picture filter, rare in basic scripts. Visualized via gradient background (green for Trending, orange for Range, red for Volatile, gray for Quiet, navy for Other). 2. Multi-Factor Signal Scoring Entries are driven by a weighted scoring system that combines candlestick patterns, trend, momentum, and volume for robust signals. Candlestick Patterns: Bullish: Engulfing (0.5), hammer (0.4 in Range, 0.2 else), morning star (0.2), piercing (0.2), double bottom (0.3 in Volatile, 0.15 else). Must be near support (low ≤ 1.01x 20-bar low) with volume spike (>1.5x 20-bar avg). Bearish: Engulfing (0.5), shooting star (0.4 in Range, 0.2 else), evening star (0.2), dark cloud (0.2), double top (0.3 in Volatile, 0.15 else). Must be near resistance (high ≥ 0.99x 20-bar high) with volume spike. Logic: Patterns are weighted higher in specific regimes (e.g., hammer in Range, double bottom in Volatile). Additional Factors: Trend: Fast EMA (20) > slow EMA (50) + 0.5x ATR (trend_bull, +0.2); opposite for trend_bear. RSI: RSI (14) < 30 (rsi_bull, +0.15); > 70 (rsi_bear, +0.15). MACD: MACD line > signal (12,26,9, macd_bull, +0.15); opposite for macd_bear. Volume: ATR > 1.2x 50-bar avg (vol_expansion, +0.1). HTF Confirmation: HTF RSI < 70 and MACD bullish (htf_bull_confirm, +0.2); RSI > 30 and MACD bearish (htf_bear_confirm, +0.2). Scoring: bull_score = sum of bullish factors; bear_score = sum of bearish. Entry requires score ≥ 1.0. Example: Bullish engulfing (0.5) + trend_bull (0.2) + rsi_bull (0.15) + htf_bull_confirm (0.2) = 1.05, triggers long. Why It’s Brilliant: Multi-factor scoring ensures signals are confirmed by multiple market dynamics, reducing false positives. Regime-specific weights make patterns more relevant (e.g., hammers shine in Range markets). HTF confirmation aligns with the big picture, a quant edge over simplistic scripts. 3. Futures-Tuned Risk Management The risk system is built for futures, calculating position sizes based on $ risk and offering flexible stops/TPs. Position Sizing: Logic: Risk per trade (default: $300) ÷ (stop distance in points * point value) = contracts, capped at max_contracts (default: 5). Point value = tick value (e.g., $12.5 for ES) * ticks per point (4) * contract multiplier (1 for ES, 0.1 for MES). Example: $300 risk, 8-point stop, ES ($50/point) → 0.75 contracts, rounded to 1. Impact: Precise sizing prevents over-leverage, critical for micro contracts like MES. Stops and Take-Profits: Fixed: Default stop = 8 points, TP = 16 points (2:1 reward/risk). ATR-Based: Stop = 1.5x ATR (default), TP = 3x ATR, enabled via use_atr_for_stops. Logic: Stops set at swing low/high ± stop distance; TPs at 2x stop distance from entry. Impact: ATR stops adapt to volatility, while fixed stops suit stable markets. Trailing Stops: Logic: Activates at 50% of TP distance. Trails at close ± 1.5x ATR (atr_multiplier). Longs: max(trail_stop_long, close - ATR * 1.5); shorts: min(trail_stop_short, close + ATR * 1.5). Impact: Locks in profits during trends, a game-changer in volatile sessions. Circuit Breaker: Logic: Pauses trading if daily drawdown > 5% (daily_drawdown = (max_equity - equity) / max_equity). Impact: Protects capital during black swan events (e.g., April 27, 2025 ES slippage). Why It’s Brilliant: Futures-specific inputs (tick value, multiplier) make it plug-and-play for ES/MES. Trailing stops and circuit breaker add pro-level safety, rare in off-the-shelf scripts. Flexible stops (ATR or fixed) suit different trading styles. 4. Trade Entry and Exit Logic Entries and exits are precise, driven by bull_score/bear_score and protected by drawdown checks. Entry Conditions: Long: bull_score ≥ 1.0, no position (position_size <= 0), drawdown < 5% (not pause_trading). Calculates contracts, sets stop at swing low - stop points, TP at 2x stop distance. Short: bear_score ≥ 1.0, position_size >= 0, drawdown < 5%. Stop at swing high + stop points, TP at 2x stop distance. Logic: Tracks entry_regime for PNL arrays. Closes opposite positions before entering. Exit Conditions: Stop-Loss/Take-Profit: Hits stop or TP (strategy.exit). Trailing Stop: Activates at 50% TP, trails by ATR * 1.5. Emergency Exit: Closes if price breaches stop (close < long_stop_price or close > short_stop_price). Reset: Clears stop/TP prices when flat (position_size = 0). Why It’s Brilliant: Score-based entries ensure multi-factor confirmation, filtering out weak signals. Trailing stops maximize profits in trends, unlike static exits in basic scripts. Emergency exits add an extra safety layer, critical for futures volatility. 5. DAFE Visuals The visuals are pure DAFE magic, blending function with cyberpunk flair to make signals intuitive and charts stunning. Shimmering Bollinger Band Fill: Display: BB basis (20, white), upper/lower (green/red, 45% transparent). Fill pulses (30–50 alpha) by regime, with glow (60–95 alpha) near bands (close ≥ 0.995x upper or ≤ 1.005x lower). Purpose: Highlights volatility and key levels with a futuristic glow. Visuals make complex regimes and signals instantly clear, even for newbies. Pulsing effects and regime-specific colors add a DAFE signature, setting it apart from generic scripts. BB glow emphasizes tradeable levels, enhancing decision-making. Chart Background (Regime Heatmap): Green — Trending Market: Strong, sustained price movement in one direction. The market is in a trend phase—momentum follows through. Orange — Range-Bound: Market is consolidating or moving sideways, with no clear up/down trend. Great for mean reversion setups. Red — Volatile Regime: High volatility, heightened risk, and larger/faster price swings—trade with caution. Gray — Quiet/Low Volatility: Market is calm and inactive, with small moves—often poor conditions for most strategies. Navy — Other/Neutral: Regime is uncertain or mixed; signals may be less reliable. Bollinger Bands Glow (Dynamic Fill): Neon Red Glow — Warning!: Price is near or breaking above the upper band; momentum is overstretched, watch for overbought conditions or reversals. Bright Green Glow — Opportunity!: Price is near or breaking below the lower band; market could be oversold, prime for bounce or reversal. Trend Green Fill — Trending Regime: Fills between bands with green when the market is trending, showing clear momentum. Gold/Yellow Fill — Range Regime: Fills with gold/aqua in range conditions, showing the market is sideways/oscillating. Magenta/Red Fill — Volatility Spike: Fills with vivid magenta/red during highly volatile regimes. Blue Fill — Neutral/Quiet: A soft blue glow for other or uncertain market states. Moving Averages: Display: Blue fast EMA (20), red slow EMA (50), 2px. Purpose: Shows trend direction, with trend_dir requiring ATR-scaled spread. Dynamic SL/TP Lines: Display: Pulsing colors (red SL, green TP for Trending; yellow/orange for Range, etc.), 3px, with pulse_alpha for shimmer. Purpose: Tracks stops/TPs in real-time, color-coded by regime. 6. Dual Dashboards Two dashboards deliver real-time insights, making the strat a quant command center. Bottom-Left Metrics Dashboard (2x13): Metrics: Mode (Active/Paused), trend (Bullish/Bearish/Neutral), ATR, ATR avg, volume spike (YES/NO), RSI (value + Oversold/Overbought/Neutral), HTF RSI, HTF trend, last signal (Buy/Sell/None), regime, bull score. Display: Black (29% transparent), purple title, color-coded (green for bullish, red for bearish). Purpose: Consolidates market context and signal strength. Top-Right Position Dashboard (2x7): Metrics: Regime, position side (Long/Short/None), position PNL ($), SL, TP, daily PNL ($). Display: Black (29% transparent), purple title, color-coded (lime for Long, red for Short). Purpose: Tracks live trades and profitability. Why It’s Brilliant: Dual dashboards cover market context and trade status, a rare feature. Color-coding and concise metrics guide beginners (e.g., green “Buy” = go). Real-time PNL and SL/TP visibility empower disciplined trading. 7. Performance Tracking Logic: Arrays (regime_pnl_long/short, regime_win/loss_long/short) track PNL and win/loss by regime (1–5). Updated on trade close (barstate.isconfirmed). Purpose: Prepares for future adaptive thresholds (e.g., adjust bull_score min based on regime performance). Why It’s Brilliant: Lays the groundwork for self-optimizing logic, a quant edge over static scripts. Key Features Regime-Adaptive: Optimizes signals for Trending, Range, Volatile, Quiet markets. Futures-Optimized: Precise sizing for ES/MES with tick-based risk inputs. Multi-Factor Signals: Candlestick patterns, RSI, MACD, and HTF confirmation for robust entries. Dynamic Exits: ATR/fixed stops, 2:1 TPs, and trailing stops maximize profits. Safe and Smart: 5% drawdown breaker and emergency exits protect capital. DAFE Visuals: Shimmering BB fill, pulsing SL/TP, and dual dashboards. Backtest-Ready: Fixed qty and tick calc for accurate historical testing. How to Use Add to Chart: Load on a 5min ES/MES chart in TradingView. Configure Inputs: Set instrument (ES/MES), tick value ($12.5/$1.25), multiplier (1/0.1), risk ($300 default). Enable ATR stops for volatility. Monitor Dashboards: Bottom-left for regime/signals, top-right for position/PNL. Backtest: Run in strategy tester to compare regimes. Live Trade: Connect to Tradovate or similar. Watch for slippage (e.g., April 27, 2025 ES issues). Replay Test: Try April 28, 2025 NQ drop to see regime shifts and stops. Disclaimer Trading futures involves significant risk of loss and is not suitable for all investors. Past performance does not guarantee future results. Backtest results may differ from live trading due to slippage, fees, or market conditions. Use this strategy at your own risk, and consult a financial advisor before trading. Dskyz (DAFE) Trading Systems is not responsible for any losses incurred. Backtesting: Frame: 2023-09-20 - 2025-04-29 Slippage: 3 Fee Typical Range (per side, per contract) CME Exchange $1.14 – $1.20 Clearing $0.10 – $0.30 NFA Regulatory $0.02 Firm/Broker Commis. $0.25 – $0.80 (retail prop) TOTAL $1.60 – $2.30 per side Round Turn: (enter+exit) = $3.20 – $4.60 per contract Final Notes The Dskyz (DAFE) Adaptive Regime - Quant Machine Pro is more than a strategy—it’s a revolution. Crafted with DAFE’s signature precision, it rises above generic scripts with adaptive regimes, quant-grade signals, and visuals that make trading a thrill. Whether you’re scalping MES or swinging ES, this system empowers you to navigate markets with confidence and style. Join the DAFE crew, light up your charts, and let’s dominate the futures game! (This publishing will most likely be taken down do to some miscellaneous rule about properly displaying charting symbols, or whatever. Once I've identified what part of the publishing they want to pick on, I'll adjust and repost.) Use it with discipline. Use it with clarity. Trade smarter. **I will continue to release incredible strategies and indicators until I turn this into a brand or until someone offers me a contract. Created by Dskyz, powered by DAFE Trading Systems. Trade smart, trade bold.Pine Script®策略由DskyzInvestments提供98
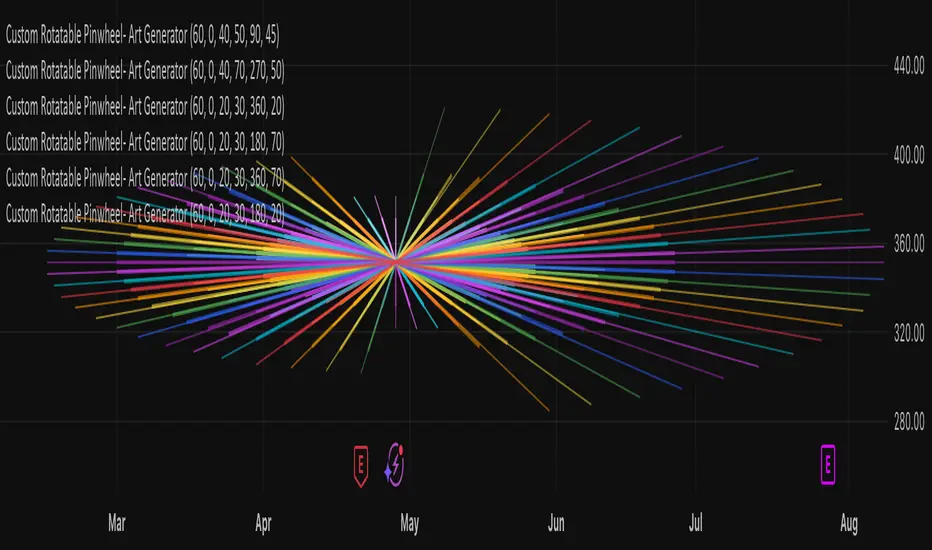
Custom Rotatable PinwheelCustom Rotatable Pinwheel – Art Generator (Fully Color-Configurable) This visual indicator draws a rotating pinwheel using radial spokes. It's designed purely for artistic and decorative purposes — not for trading signals. Use it to create abstract, mandala-like effects by layering multiple instances with different rotation angles and color palettes. Fully Customizable Spoke Colors You can now define up to 8 custom spoke colors, which cycle across the pinwheel arms. Optionally, enable "Use Single Color" to override all spokes with a single color. This gives full creative control over your color palette and design aesthetic. Controls: Number of Spokes – Total number of radial arms Rotation Offset (°) – Adjusts the starting angle, useful when layering multiple instances Spin Speed – Controls how fast the pinwheel rotates with each bar Inner / Outer Radius – Adjusts the spoke arm lengths Transparency – Controls how visible the lines are Use Single Color – Toggle between a single color or a full custom palette Color 1–8 – Set your preferred spoke colors (used when single color is off) Setup for a Clean Chart Canvas (No Price Bars or Gridlines) To hide all default chart visuals and show only the pinwheel design: Right-click chart → Settings Symbol tab: Uncheck "Show Bars" Scales tab: Uncheck "Price Scale" and "Time Scale" Appearance tab: Set background to black Uncheck grid lines, watermark, etc. Status Line and Events: Uncheck all Pine Script®指标由smoyer提供已更新 12
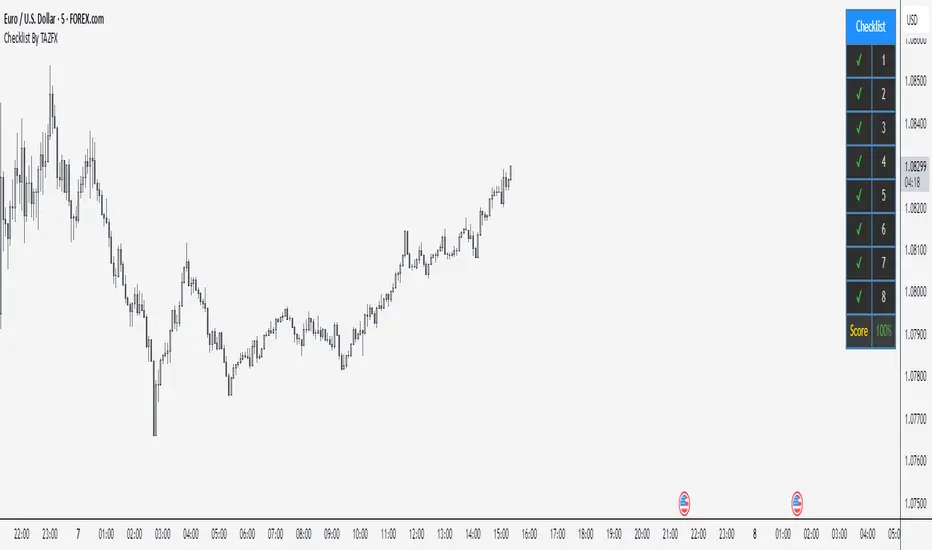
Checklist By TAZFX with Trade ScoreTrading Checklist is a customizable indicator designed for traders who want to stay disciplined and stick to their trading rules. Using this indicator, you can easily create and display your own personalized checklist of trading rules directly on your TradingView chart. 1. Customizable Settings: • Positioning : Place the table in one of nine positions on the chart (e.g., bottom left, top right). • Header : Modify the banner text, size, and color. • Row Content : Define text for each row and control visibility. • Appearance : Adjust text and background colors. 2. Checklist Table: •Displays up to 8 rows with checkboxes (✅/❌) and custom labels for trade evaluation. •Useful for tracking whether specific trade conditions or rules are met. 3. Trade Score Calculation: •The Trade Score is a percentage that shows how many of your checklist items are checked compared to the total visible items. Pine Script®指标由TazFX-提供已更新 99371
Timeframe WatermarkA small indicator designed for the minimalist chartist which prints the timeframe on your chart. The color of the text is based on whether the currency is trending (using the 8 and 21 EMAs) in that timeframe. Trending here is simply defined as the direction in which the 8 is above or below the 21. When used in a multi-timeframe layout, this indicator lets you easily scan multiple charts to see if they are trending across multiple timeframes by looking at the color of each chart's timeframe stamp. This is designed to be used in a multi-timeframe window layout to efficiently and minimally present trending information across multiple timeframes. Features: adjustable colors adjustable text position within the chart (top left/middle/right, bottom left/middle/right) Pine Script®指标由ParametricTrading提供已更新 13
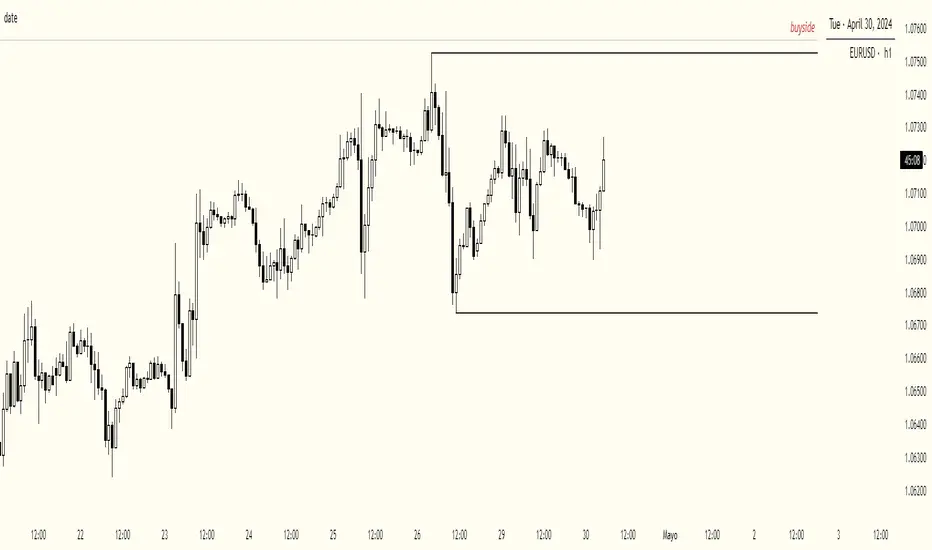
date & symbolHey y'all If you are like me and you keep a record of your performance, adding date and symbol information will surely help you. You can choose English or Spanish, and also choose between full or abbreviated date. If you want to see the day and if you want to see the symbol. You can customize position, text size, text color, background.Pine Script®指标由pedro1203103提供已更新 40
VPQuantLibLibrary "VPQuantLib" Misc of math, position size and consolidation detection functions that can be used accross various scripts. isPercentAboveReference(current, percent, reference, or_equal) Checks if the current value is bigger (or equal) with the provided percent value to the reference Parameters: current (float) : - what to check against the reference percent (float) : - what is the percent to check for difference reference (float) : - what to compare against or_equal (bool) : - enables checking for bigger or equal Returns: true if the current is percent bigger (or equal) to the reference isPercentBelowReference(current, percent, reference, or_equal) Checks if the current value is smaller (or equal) with the provided percent value to the reference Parameters: current (float) : - what to check against the reference percent (float) : - what is the percent to check for difference reference (float) : - what to compare against or_equal (bool) : - enables checking for smaller or equal Returns: true if the current is percent smaller (or equal) to the reference isInRange(current, reference, min_percent, max_percent, below) Checks if the current value is greater/smaller than the reference value within the provided percent range Parameters: current (float) : - what to check for being in range against the refenence reference (float) : - what to compare against min_percent (float) : - the min percent range border max_percent (float) : - the max percent range border below (bool) : - check if below or above the reference @return true if the current is bigger/smaller than the reference withing the percent range provided GetRiskBasedPositionSize(account_balance, equity_risk_perc, max_loss_per_share) Calculates and returns the positins size based on risk of the equity Parameters: account_balance (float) : - total account balance equity_risk_perc (int) : - percent of equity to risk in the trade max_loss_per_share (float) : - maximum loss per share (in currency, not in %) that we're willing to loose (calc based on the entry_price-stop_loss_price) @return number of shares to buy CheckInRangeConsolidation(consolidation_period, allowed_consolidation_range, ref_high, ref_low, prev_bar_consolidaton, draw_consolidation_lines) Checks if the current bar is in a consolidation range Parameters: consolidation_period (int) : - the number of bars to consider for consolidation range calculation allowed_consolidation_range (int) : - the percentage range allowed for the current consolidation range to be considered valid ref_high (float) : - the reference high value to use for consolidation range calculation ref_low (float) : - the reference low value to use for consolidation range calculation prev_bar_consolidaton (bool) draw_consolidation_lines (bool) : - a boolean indicating if consolidation range lines should be drawn on the chart @return a tuple of three values: 1. _curr_consolidation - a boolean indicating if the current bar is in consolidation range 2. _curr_consolidation_low - the current consolidation low value 3. _curr_consolidation_high - the current consolidation high value FindBasicConsolidation(loopback_period, consolidation_length, ref_high, ref_low, draw_consolidation_lines) Finds a basic consolidation areas, looking back 1000 bars to find the pivot of the trend and checks if the current bar is in consolidation area counting the number of bars that have not broken the consolidation high/low levels Parameters: loopback_period (int) : - the number of bars to look back to determine the high/low watermark consolidation_length (int) : - minimum number of bars required to establish a consolidation period ref_high (float) : - user input for high (can be based on the bar or wicks) ref_low (float) : - user input for high (can be based on the bar or wicks) draw_consolidation_lines (bool) : - enable/disable drawing of the consolidation lines Returns: _pivot_point - pivot pointPine Script®库由vpirinski提供3
Trading Checklist - SonarlabTrading Checklist is a customizable indicator designed for traders who want to stay disciplined and stick to their trading rules. Using this indicator, you can easily create and display your own personalized checklist of trading rules directly on your TradingView chart. The Title and the Body are two different sections, so you can set two different styles. This indicator allows you to customize: Text color Text size Text alignment Pine Script®指标由vuetratrading提供已更新 99 1.6 K
RF+ Replay for Heikin AshiRF+ Replay for Heikin Ashi RF+ Replay for Heikin Ashi generates fully customisable Heikin Ashi candlesticks presented on a standard chart, enabling traders to utilise the Tradingview Replay feature with Heikin Ashi candlesticks when analysing and backtesting HA style strategies. The features of this indicator include: - Fully customisable Heikin Ashi Candles, including custom colour options for candle bodies, borders and wicks. - Optional real-time, real-price close dots painted onto each candlestick. - A optional set of 2 x Range Filters designed to indicate short term trend identification upon color change, ideal for low timeframe scalping. - A optional set of 3 x fully customisable Moving Averages. - An option to enable Heikin Ashi calculated data for the Range Filters and Moving Averages, so they present as they would on a Heikin Ashi non-standard chart type, without having to use an actual Heikin Ashi chart. Enabled by default. - An optional sessions indicator, to highlight your prefered trading session for the purpose of backtesting. - An optional watermark featuring customisable text and well as symbol and timeframe information, as seen in the screenshot of this indicator. Instructions for use: 1) Because this indicator generates candlesticks and presents them onto your chart, you will need to hide the existing candlesticks so you do not see two sets of candles. You can do this by going into your Tradingview chart settings and making the candle bodies, borders and wicks fully transparent. You can then save this as a layout template. You can access your Chart Settings by clicking on the cog icon, or by right clicking on the chart itself and selecting 'Chart Settings' from the list. 2) Ensure you have the standard chart type selected - you do not need to select a Heikin Ashi type chart. 3) You will now be able to analyise and even backtest your Heikin Ashi style strategies including the use of the Tradingview Replay feature found at the top of the chart. Heikin Ashi means 'average bar' in Japanese, which speaks to the fact that Heikin Ashi candles are calculated differently to standard Japanese candlesticks. The general idea of Heikin Ashi candles is to 'smooth' the appearance of price movement, by the use of averages within their calculation. It is important to understand that the Open and Close values of a Heikin Ashi candlestick do not reflect real Open and Close prices. You can use the real price dots feature to clearly see the real time and real price Close of each candle. The formula for calculating a Heikin Ashi candlestick is as follows: High = Maximum of High, Open, or Close (whichever is highest) Low = Minimum of Low, Open, or Close (whichever is lowest) Open = Open (previous bar) + Close (previous bar) /2 Close = (Open + High + Low + Close) / 4 If you found this useful, be sure to leave a like, comment and subscribe to show your support. Until next time.Pine Script®指标由PHVNTOM_TRADER提供已更新 2020752
RF+ Divergence Scalping SystemRF+ Divergence Scalping System + Custom Signals + Alerts. This chart overlay indicator has been developed for the low timeframe divergence scalper. Built upon the realtime divergence drawing code from the Divergence for Many indicator originally authored by Lonsometheblue, this chart overlay indicator bundles several additional unique features and modifications to serve as an all-in-one divergence scalping system. The current key features at the time of publishing are listed below (features are optional and can be enabled or disabled): - Fully configurable realtime divergence drawing and alerting feature that can draw divergences directly on the chart using data sourced from up to 11 oscillators selected by the user, which have been included specifically for their ability to detect divergences, including oscillators not presently included in the original Divergence for Many indicator, such as the Ultimate Oscillator and TSI. - Optional on chart table showing a summary of key statuses of various indicators, and nearby divergences. - 2 x Range Filters with custom settings used for low timeframe trend detection. - 3 x configurable multi-timeframe Stochastic RSI overbought and oversold signals with presentation options. - On-chart pivot points drawn automatically. - Automatically adjusted pivot period for up to 4 configurable time frames to fine tune divergences drawn for optimal divergence detection. - Real-price line for use with Heikin Ashi candles, with styling options. - Real-price close dots for use with Heikin Ashi candles, with styling options. - A selection of custom signals that can be printed on-chart and alerted. - Sessions indicator for the London, New York, Tokyo and Sydney trading sessions, including daylight savings toggle, and unique ‘invert background color’ option, which colours the entire chart - except the trading session you have selected, leaving your chart clear of distracting background color. - Up to 4 fully configurable moving averages. - Additional configurable settings for numerous built in indicators, allowing you to alter the lengths and source types, including the UO, TSI, MFI, TSV, 2 x Range Filters. - Configurable RSI Trend detection signal filter used in a number of the signals, which filters buy signals where the RSI is over the RSI moving average, and only prints sell signals where RSI is under the moving average. - Customisable on-chart watermark, with inputs for a custom title, subtitle, and also an optional symbol | timeframe | date feature. The Oscillators able to be selected for use in drawing divergences at the time of publishing are as follows: - Ultimate Oscillator (UO) - True Strength Indicator (TSI) - Money Flow Index (MFI) - Cumulative Delta Volume (CDV) - Time Segmented Volume (TSV) - Commodity Channel Index (CCI) - Awesome Oscillator - Relative Strength Index (RSI) - Stochastic - On Balance Volume (OBV) - MACD Histogram What are divergences? Divergence is when the price of an asset is moving in the opposite direction of a technical indicator, such as an oscillator, or is moving contrary to other data. Divergence warns that the current price trend may be weakening, and in some cases may lead to the price changing direction. There are 4 main types of divergence, which are split into 2 categories; regular divergences and hidden divergences. Regular divergences indicate possible trend reversals, and hidden divergences indicate possible trend continuation. Regular bullish divergence: An indication of a potential trend reversal, from the current downtrend, to an uptrend. Regular bearish divergence: An indication of a potential trend reversal, from the current uptrend, to a downtrend. Hidden bullish divergence: An indication of a potential uptrend continuation. Hidden bearish divergence: An indication of a potential downtrend continuation. Setting alerts. With this indicator you can set alerts to notify you when any/all of the above types of divergences occur, on any chart timeframe you choose, also when the triple timeframe Stochastic RSI overbought and oversold confluences occur, as well as when custom signals are printed. Configurable pivot period values. You can adjust the default pivot period values to suit your prefered trading style and timeframe. If you like to trade a shorter time frame, lowering the default lookback values will make the divergences drawn more sensitive to short term price action. By default, this indicator has enabled the automatic adjustment of the pivot periods for 4 configurable time frames, in a bid to optimize the divergences drawn when the indicator is loaded onto any of the 4 time frames selected. These time frames and their associated pivot periods can be fully reconfigured within the settings menu. By default, these have been further optimized for the low timeframe scalper trading on the 1-15 minute time frames. How do traders use divergences in their trading? A divergence is considered a leading indicator in technical analysis , meaning it has the ability to indicate a potential price move in the short term future. Hidden bullish and hidden bearish divergences, which indicate a potential continuation of the current trend are sometimes considered a good place for traders to begin, since trend continuation occurs more frequently than reversals, or trend changes. When trading regular bullish divergences and regular bearish divergences, which are indications of a trend reversal, the probability of it doing so may increase when these occur at a strong support or resistance level . A common mistake new traders make is to get into a regular divergence trade too early, assuming it will immediately reverse, but these can continue to form for some time before the trend eventually changes, by using forms of support or resistance as an added confluence, such as when price reaches a moving average, the success rate when trading these patterns may increase. Typically, traders will manually draw lines across the swing highs and swing lows of both the price chart and the oscillator to see whether they appear to present a divergence, this indicator will draw them for you, quickly and clearly, and can notify you when they occur. How do traders use overbought and oversold levels in their trading? The oversold level is when the Stochastic RSI is above the 80 level is typically interpreted as being 'overbought', and below the 20 level is typically considered 'oversold'. Traders will often use the Stochastic RSI at, or crossing down from an overbought level as a confluence for entry into a short position, and the Stochastic RSI at, or crossing up from an oversold level as a confluence for an entry into a long position. These levels do not mean that price will necessarily reverse at those levels in a reliable way, however. This is why this version of the Stoch RSI employs the triple timeframe overbought and oversold confluence, in an attempt to add a more confluence and reliability to this usage of the Stoch RSI. This indicator is intended for use in conjunction with related panel indicators including the TSI+ (True Strength Indicator + Realtime Divergences), UO+ (Ultimate Oscillator + Realtime Divergences), and optionally the STRSI+ (MTF Stochastic RSI + Realtime Divergences) and MFI+ (Money Flow Index + Realtime Divergences) available via this authors’ Tradingview profile, under the scripts section. The realtime divergence drawing code will not identify all divergences, so it is suggested that you also have panel indicators to observe. Each panel indicator also offers additional means of entry confirmation into divergence trades, for example, the Stochastic can indicate when it is crossing down from overbought or up from oversold, the TSi can indicate when the 2 TSI bands cross over one another upward or downward, and the UO and MFI can indicate an entry confluence when they are nearing, or crossing their centerlines, for more confidence in your divergence trade entries. Additional information on the settings for this indicator can be found via the tooltips within the settings menu itself. Further information on feature updates, and usage tips & tricks will be added to the comments section below in due course. Disclaimer: This indicator uses code adapted from the Divergence for Many v4 indicator authored by Lonesometheblue, and several stock indicators authored by Tradingview. With many thanks. Pine Script®指标由PHVNTOM_TRADER提供已更新 1717661
PipMotionFXHi guys, If you are looking to add some watermark into your charts. You can use this indicator. You can add add a title and a subtitle, if you want to write in diferents lines, you can use \n as you can see in the script. All the features are customizable: position, text size, text color, background. Enjoy it.Pine Script®指标由UnknownUnicorn16954350提供5
BTMM R.NOODLEThis script aims to encompass the style of Traders Reality, Steve M (BTTM), and Stacey Burke (youtube) yesterday and last wk high and low Custom watermark with examples (good for fullscreen multicharts) can set it to show the year and week x of year Colored candles for ays of week. The theory behind these colors are that monday and tuesday set your initial balance for the week . having color seperation helps identify the balance mon-tues = initial balance :green wed +thu : blue friday: red Session boxes and daily initial balance displays the asian and european trading session as one displays the ny session first 3 hrs how to combine sessions, weekly ib, daily ib, and sessions will add pip lines 00/.50 increments at a later date Pine Script®指标由MatrixEdge提供已更新 1414277
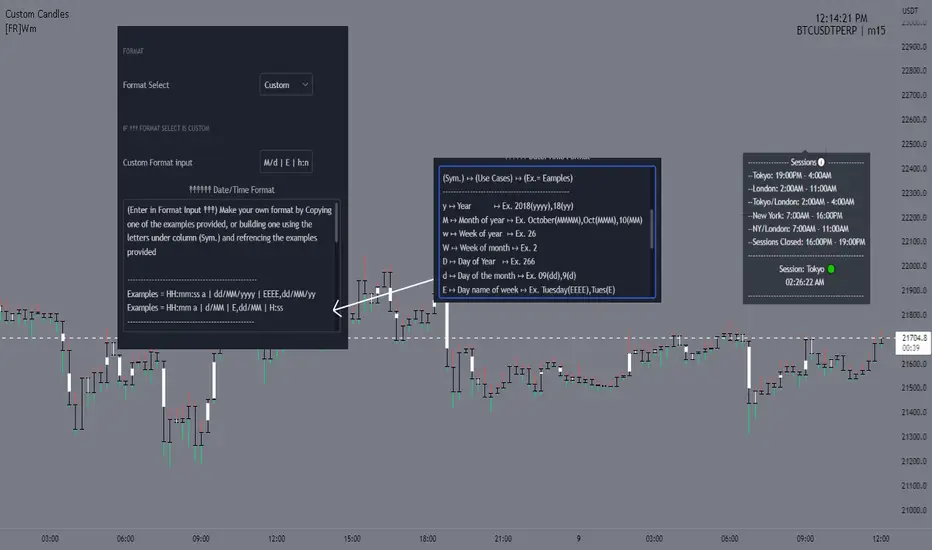
[FR]WmThis a water mark that uses a table to allow placement at 9 different locations on the screen you can either pick on of the given Date and time formats or you can choose custom and build your own One of the reasons for this project I wanted to be able to add the "s,m,h" to the water marks timeframe not have i.e. "240" and have it say 4h.. you can select what format for the dates from in the settings if the user selects custom it will make it so you can input what ever format string into the input box "Custom Format input'" Hope You Enjoy! FFriZzPine Script®指标由FFriZz提供已更新 94
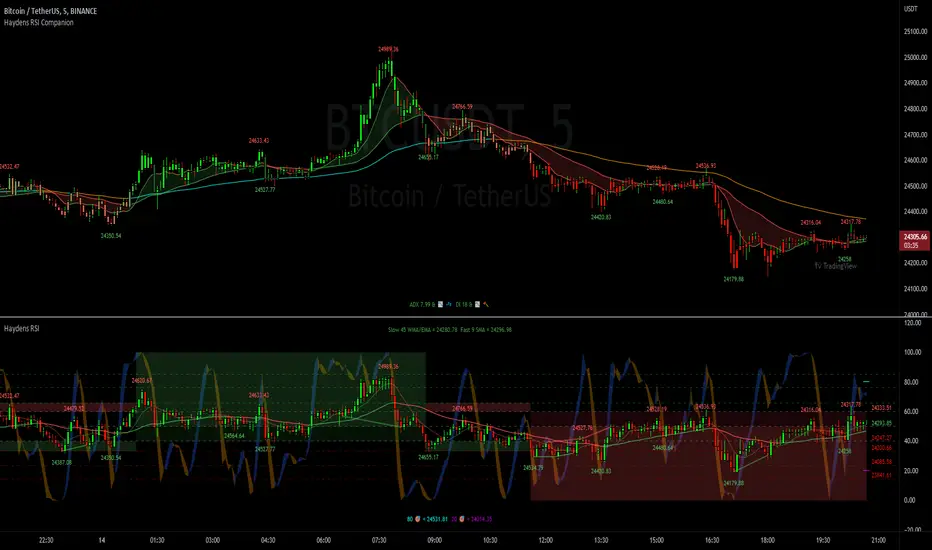
Haydens RSI CompanionPreface: I'm just the bartender serving today's freshly blended concoction; I'd like to send a massive THANK YOU to all the coders and PineWizards for the locally-sourced ingredients. I am simply a code editor, not a code author. The book that inspired this indicator is a free download, plus all of the pieces I used were free code from the community; my hope is that any additional useful development of The Complete RSI is also offered open-source to the community for collaboration. Features: Fibonacci retracement plus targets. Advanced dual data ticker. Heiken Ashi or bar overlay. Hayden, BarefootJoey, Tradingview, or Custom watermark of choice. Trend lines for spotting wedges, triangles, pennants, etc. Divergences for spotting potential reversals and Momentum Discrepancy Reversal Point opportunities. Percent change and price pivot labels with advanced data & retracement targets upon hover. ‼ IMPORTANT: Hover over labels for advanced information, like targets. Google & read John Hayden's "The Complete RSI" pdf book for comprehensive instructions before attempting to trade with this indicator. Always keep an eye on higher/stronger timeframes. See the companion oscillator here: ⚠ DISCLAIMER: DYOR. Not financial advice. Not a trading system. I am not affiliated with TradingView or John Hayden; this is my own personally PineScripted presentation of a suitable RSI chart companion to use when trading according to Hayden's rules. About the Editor: I am a former-FINRA Registered Representative, inventor/patent-holder, and self-taught PineScripter. I mostly code on a v3 Pinescript level so expect heavy scripts that could use some shortening with modern conventions.Pine Script®指标由BarefootJoey提供已更新 88505