Cumulative Volume Delta (HA Option)# **📘 Ultimate Guide to Trading With CVD Heikin Ashi (CVD+)**
## **🔍 What This Indicator Shows**
This tool plots **Cumulative Volume Delta (CVD)** as candlesticks—optionally transformed into **Heikin Ashi CVD candles**.
Instead of price, each candle represents the *battle between buyers and sellers* within your chosen timeframe.
**Volume Delta = Buying Volume – Selling Volume**
CVD takes all deltas and stacks them cumulatively, showing who is controlling the auction *over time*.
With Heikin Ashi smoothing layered on top, trend detection becomes cleaner, letting you see the “true pressure” behind price moves.
---
# **💡 Why CVD Is a Game Changer**
Most traders only see price.
Serious traders watch **pressure**.
CVD exposes what price hides:
* Absorption
* Hidden accumulation
* Seller exhaustion
* Fake breakouts
* True reversals
* Momentum strength / weakness
* Smart money footprint
When combined with Heikin-Ashi smoothing, you get delta trends with way less noise and fewer fake flips.
---
# **📈 How to Actually Use It (The Edge)**
## **1. Spot True Trend vs. Fake Trend**
If **price goes up** but **CVD goes down**, that’s:
* Passive sellers absorbing
* A weak rally
* High probability of reversal
If **price pulls back** but **CVD keeps rising**, that’s:
* Secret accumulation
* A continuation setup
* Great dip-buy opportunity
**Rule of thumb:**
🔹 *Follow the CVD trend, not the price noise.*
---
## **2. Catch Reversals Early**
Watch for:
### **🔻 Bearish Reversal Signals**
* CVD makes a **lower high**
* Heikin Ashi CVD prints **red bodies with rising upper shadows**
* Price makes one final push up on low delta
This is classic distribution → the drop usually follows fast.
### **🔹 Bullish Reversal Signals**
* CVD forms a **higher low**
* HA CVD flips from red to green with full bodies
* Price still looks weak = bottom forming
This is exactly how pros catch bottoms early.
---
## **3. Identify Absorption Levels**
If price hits a level multiple times but CVD keeps climbing (or falling), that level is being defended.
Example:
* Price stalls at support
* CVD keeps rising
= **Buyers absorbing sells → high-probability bounce**
Opposite works for resistance.
---
## **4. Validate Breakouts**
A breakout with *weak or negative CVD* is usually a trap.
A breakout with **strong, rising HA CVD** is real.
If CVD diverges from the breakout direction → fade it.
If CVD confirms → ride it.
---
## **5. Use Heikin Ashi to Stay in Trends**
HA smoothing removes the nasty chop of raw delta data.
Look for:
* Consecutive **full-body teal candles = strong buying wave**
* Consecutive **full-body red candles = strong selling wave**
* Small-bodied candles after a trend = momentum dying
This keeps you in winners longer and cuts losers faster.
---
# **🎯 Practical Trading Playbook**
### **A) Long Setup**
1. Price pullback into support
2. CVD stays bullish or makes a higher low
3. HA CVD flips green or prints a strong body
4. Enter long
5. Stop under CVD structural low
### **B) Short Setup**
1. Price pushes into resistance
2. CVD forms bearish divergence
3. HA CVD prints red bodies
4. Enter short
5. Stop above CVD swing high
### **C) Chop Filter**
No clear HA CVD trend = avoid trading → stop donating money to the market.
---
# **🧠 Tips for Mastery**
* Use lower timeframe delta (1m–5m) for scalping entries
* Use a higher anchor timeframe (1D) to define direction
* When price trends but CVD is flat → expect a fakeout
* When CVD trends but price is flat → expect a breakout
* Trade WITH delta, fade AGAINST delta
---
# **⚠️ Important Notes**
* Crypto = full tick-by-tick volume → CVD is extremely accurate
* Stocks = depends on your broker/data vendor
* Futures = best signal-to-noise ratio
* If your symbol has no volume → indicator will warn you
---
# **📥 Recommended Settings**
* **Anchor timeframe**: 1D or 4H
* **Lower timeframe**: 1m, 3m, or 5m
* **Heikin Ashi**: ON for trend filtering, OFF for raw delta
---
# **🔥 Final Word**
Price can lie.
Delta usually doesn’t.
CVD + Heikin Ashi gives you the closest thing to reading the market’s heartbeat in real time.
Use it to confirm breakouts, detect reversals early, identify real trend strength, and avoid getting caught in manipulation.
If you learn to read CVD well…
you stop trading price, and start trading the **intent** behind the price.
在脚本中搜索"wave"

Neon Waves Oscillator [NinjADeviL]Neon Waves Oscillator
The Neon Waves Oscillator is inspired by modern neon-style visual design and displays four smooth waves representing normalized price movement using ATR. The waves highlight changes in momentum, volatility, and market rhythm in a clean, sharp, and visually appealing way, enhanced by a soft glow effect that adds depth and clarity.
Key Features:
🌈 Four smooth neon-colored waves
⚡ ATR-based normalization for consistent behavior across all assets
🎨 Dynamic glow background for a rich visual appearance
🔎 Helps identify momentum shifts, volatility cycles, and trend transitions
🧠 EMA-based smoothing for stability and high accuracy
Ideal for traders focused on Price Action, Momentum, or anyone who prefers a clean, intuitive, and modern visual oscillator.
Developed by NinjADeviL.

Daedalus Gold Ratio Waves61.8 weekly moving average with extensive waves using percentages off the mean

Market Profit X (MPX)Hi Traders,
Welcome to Market Profit X (MPX)
Keep
It
Simple
Stupid
I have created MPX to give a main screen visual with simple easy Buy/Sell signals based on your favorite wave trend oscillators.
Traders' learners through to advanced will and I say will PROFIT using MPX easy to follow system.
The 12: Tema and 56: Tema are utilized umm yeah that's right the same ones you are paying thousands for 56 Tema giving you your baseline or zero line on the common Wave Trend Oscillator and the 12 Tema giving you that momentum where all chasing.
One thing after years of studying what really is the bread and butter? Money money money that's what matters money flowing in money flowing out Long/Short yeah. So that's what your BUY/SELL signals are based on and they work.
I have added ATR for stops and have found after extensive trials setting multiplier to 2.5 you are going to have a high % of winning trades which you can thank me with i will send my BTC wallet Addy.
I have added the 8 EMA for another extremely rewarding swing system that i may share with my crew or people I like. I hear you already 8 EMA yeah right that's old worth nothing well it's what I do with this is the magic.
So how do I use? i can see the DM box filling up now because i have been reluctant to release this simple little indicator because i trialed it put in hard yards and know it's a banger.
first one i share and if i get no donations i take down because i know you will be hitting home runs.
Top-down analysis first are we bull or bear? then i drop to the 30m or 15m and wait for BUY/SELL signal go to your favorite wave trend oscillator i have mine over at Marketspy.com and take a good look at your money flow. I will wait for candle to close and confirm then buy next candles open or drop down to the 5m for slight pullback for entry.
Tip one: I like to buy 60 or -60 levels with confidence what will catch you reg bear divs.
like everything not every signal a home run that's why as soon as you take the trade you are looking at your stop and setting it in stone if you get hit o well onto the next. What's your number one? protecting your bank.
Now like i said the 8EMA system is a special spice i may share with special people as it requires training.
Enjoy tell me i suck i don't care i know it works and makes consistent money and my trading group guys will vouch for me.
Thank you, Trader (IKN) I Know Nothing out.

[SwingMann©] EWTrend+ EWTrend+
Trend and Elliott Wave Cycle Indicator
Description:
EWTrend+ is a versatile indicator specifically designed to visualize market trends and Elliott Wave cycles. By combining multiple EMA lengths with flexible smoothing options, it enables precise trend analysis and signal generation.
Key Features:
Dynamic Trend Colors: Green for uptrends, red for downtrends, gray for neutral phases.
Multiple EMAs: Configurable lengths for different time horizons.
Flexible Smoothing: Choose SMA, EMA, WMA, RMA, DMA, or no smoothing at all.
Signal Lines: WMA-based signal lines for each EMA, optionally visible or hidden.
Offset Function:
Displays indicator lines slightly shifted for clearer visualization of market movements.
Elliott Wave Cycle Orientation:
Assists in identifying impulsive and corrective market phases.
When combined, absolutely lethal ;-)
Benefits:
Provides a clear visual overview of short- and long-term trends.
Supports the analysis of Elliott Wave patterns for strategic entries and exits.
Ideal for swing traders, day traders, and technical analysts.
Conclusion:
Multiple EMAs for various time horizons
Dynamic trend colors for quick orientation
Signal lines for trend confirmation
Offset function for improved visualization
Supports Elliott Wave cycle analysis
Note:
EWTrend+ is a tool for analysis and does not replace independent trading decisions. Please test the indicator on a demo account before live use.

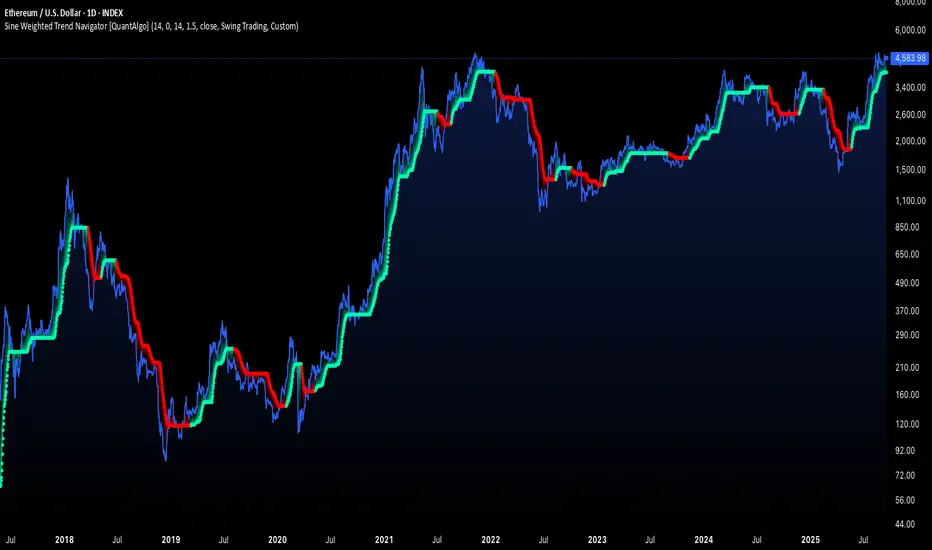
Sine Weighted Trend Navigator [QuantAlgo]🟢 Overview
The Sine Weighted Trend Navigator utilizes trigonometric mathematics to create a trend-following system that adapts to various market volatility. Unlike traditional moving averages that apply uniform weights, this indicator employs sine wave calculations to distribute weights across historical price data, creating a more responsive yet smooth trend measurement. Combined with volatility-adjusted boundaries, it produces actionable directional signals for traders and investors across various market conditions and asset classes.
🟢 How It Works
At its core, the indicator applies sine wave mathematics to weight historical prices. The system generates angular values across the lookback period and transforms them through sine calculations, creating a weight distribution pattern that naturally emphasizes recent price action while preserving smoothness. The phase shift feature allows rotation of this weighting pattern, enabling adjustment of the indicator's responsiveness to different market conditions.
Surrounding this sine-weighted calculation, the system establishes volatility-responsive boundaries through market volatility analysis. These boundaries expand and contract based on current market conditions, creating a dynamic framework that helps distinguish meaningful trend movements from random price fluctuations.
The trend determination logic compares the sine-weighted value against these adaptive boundaries. When the weighted value exceeds the upper boundary, it signals upward momentum. When it drops below the lower boundary, it indicates downward pressure. This comparison drives the color transitions of the main trend line, shifting between bullish (green) and bearish (red) states to provide clear directional guidance on price charts.
🟢 How to Use
Green/Bullish Trend Line: Rising momentum indicating optimal conditions for long positions (buy)
Red/Bearish Trend Line: Declining momentum signaling favorable timing for short positions (sell)
Steepening Green Line: Accelerating bullish momentum with increasing sine-weighted values indicating strengthening upward pressure and high-probability trend continuation
Steepening Red Line: Intensifying bearish momentum with declining sine-weighted calculations suggesting persistent downward pressure and optimal shorting opportunities
Flattening Trend Lines: Gradual reduction in directional momentum regardless of color may indicate approaching consolidation or trend exhaustion requiring position management review
🟢 Pro Tips for Trading and Investing
→ Preset Strategy Selection: Utilize the built-in presets strategically - Scalping preset for ultra-responsive 1-15 minute charts, Default preset for balanced general trading, and Swing Trading preset for 1-4 hour charts and multi-day positions.
→ Phase Shift Optimization: Fine-tune the phase shift parameter based on market bias - use positive values (0.1-0.5) in trending bull markets to enhance uptrend sensitivity, negative values (-0.1 to -0.5) in bear markets for improved downtrend detection, and zero for balanced neutral market conditions.
→ Multiplier Calibration: Adjust the multiplier according to market volatility and trading style. Use lower values (0.5-1.0) for tight, responsive signals in stable markets, higher values (2.0-3.0) during earnings seasons or high-volatility periods to filter noise and reduce whipsaws.
→ Sine Period Adaptation: Customize the sine weighted period based on your trading timeframe and market conditions. Use 5-14 for day trading to capture short-term momentum shifts, 14-25 for swing trading to balance responsiveness with reliability, and 25-50 for position trading to maintain long-term trend clarity.
→ Multi-Timeframe Sine Validation: Apply the indicator across multiple timeframes simultaneously, using higher timeframes (4H/Daily) for overall trend bias and lower timeframes (15m/1H) for entry timing, ensuring sine-weighted calculations align across different time horizons.
→ Alert-Driven Systematic Execution: Leverage the built-in trend change alerts to eliminate emotional decision-making and capture every mathematically-confirmed trend transition, particularly valuable for traders managing multiple instruments or those unable to monitor charts continuously.
→ Risk Management: Increase position sizes during strong directional sine-weighted momentum while reducing exposure during frequent color changes that indicate mathematical uncertainty or ranging market conditions lacking clear directional bias.
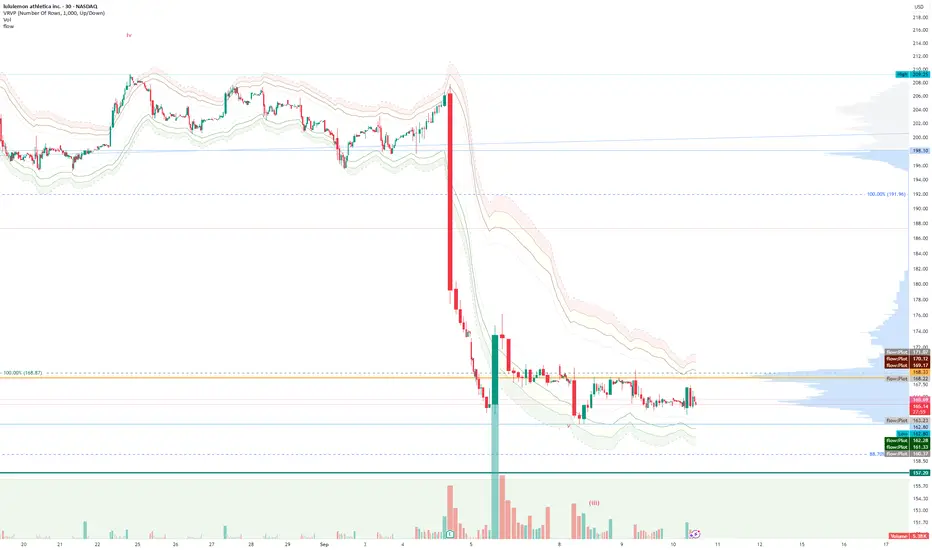
FlowThe indicator attempts to capture the volatility within a range and apply a set of Fibonacci calculations to display a range of bands of varying degrees which represents zones where exhaustion may occur on both sides.
So if price gets in to the yellow or pink zones then the script author is on high alert for a reversal. It must be noted that the user of the script should be fluent in Elliott Wave Analysis as the script was developed to help the author determine if a wave sequence may have ended.
When the indicator glides along one of the green, yellow or pink bands, then the instrument is likely in a 3rd wave, in Elliott wave speak, as such the user of the script would wait and not try to fade the move up or down as continuation is likely. Instead a move away from one of the bands should indicate another attempt at reaching the band after moving away. Thus, this move back in should be a 5th wave of some degree within the timeframe.
The indicator is not bound to any timeframe, as such it works on a 1 minute chart as it does on a weekly timeframe.
One of the observations the author makes is the use of the indicator within a sideways market. The indicator performs very well within these lower volatility environments by indicating exhaustion within these range bound markets.
So in essence, within the framework of Elliott wave analysis and respective time frames. Watch several higher and lower time frames.
1) Once wave 1 has completed
2) Look for a move down to the lower green / yellow zone to identify a wave 2 zone.
3) Once wave 3 starts, do not attempt to fade or short the first touch on the pink zone. Wait for price to move away and then come back in to the pink zone before considering a top and any attempts to fade.
4) Wave 4 should find support on the lower yellow or green band. Where it may be considered that price may change direction.
5) Depending on the time frame and any expected/unexpected extensions, Wave 5 may find resistance in to the pink zone.
A question that the author often asks is "where will wave 3 end?" - Will it end at the 1.618% extension of wave 1 & 2, the 176.4 or higher and perhaps lower. Using the pink zones the author has found it useful and quite accurate to make such a judgement based on the current position of the bands - Pink for exhaustion in an uptrend and green for exhaustion in a down trending market.
Elliott Wave Rule EngineWhat this tool does
The indicator scans price for two concurrent swing structures—a Small (shorter-degree) and a Large (higher-degree) set—then applies an Elliott/NeoWave rule engine to the most recent 5-swing motive (1-2-3-4-5) or 3-swing corrective (A-B-C). It produces:
Blue lines for Small swings and Orange lines for Large swings.
A rule dashboard (optional) showing PASS/FAIL/WARN for core rules & guidelines.
Buy/Sell labels when (a) a valid motive completes and (b) loop “consensus,” alignment, and scoring gates are satisfied.
Reading the chart
Small swings: thin blue segments, built from your Small settings.
Large swings: thicker orange segments, from your Large settings.
Background tint: faint green when a motive (impulse/diagonal) is valid right now on Small.
Labels (if enabled):
“1…5” or “A-B-C” markers on the latest detected structure.
Buy/Sell label at the last pivot when all gates pass; text may include a score %.
How it works
For both Small and Large degrees the script:
- Loops over all (left, right) combinations you specify (e.g., Small Left = 3..6, Right = 0..0) and calls ta.pivothigh/low.
- Aggregates the results:
- Keeps the most extreme pivot found in the loop (highest high or lowest low) that’s newer than the last accepted swing.
- Gates acceptance by minimum % change versus the last opposite swing (inside the loop) and a post-aggregation filter (Small Minimum swing %, Large Minimum swing %).
- Merges back-to-back same-type swings (HH or LL) by keeping only the more extreme one.
- Keeps only the last N=lookbackWaves swings (default 100).
- Consensus (used for signals) comes from the loop counts:
- sBuyConsensus = small L-count / total-combos (bullish bias)
- sSellConsensus = small H-count / total-combos (bearish bias)
(and the same for Large). This is a data-driven “how many combos agreed” measure.
2) Rule engine (Impulse/Diagonal vs. Corrective)
When there are at least 6 Small swings, the engine tests 1-2-3-4-5:
Hard rules (must pass for an Impulse):
- Wave-2 not > 100% of Wave-1 (no retrace beyond start of W1).
- Wave-3 not the shortest among 1,3,5.
- Wave-4 doesn’t overlap Wave-1 (if it does, structure may be a Diagonal).
- Diagonal eligibility: Rules 1 & 2 pass but Rule 3 fails ⇒ eligible as a Diagonal (
Guidelines (7 checks, count toward a threshold you set):
- W2 retraces a Fib level (within ±fibTol).
- W4 retraces a Fib level (within ±fibTol).
- W3 strongest momentum (speed = |Δprice| / bars).
- Alternation: W2 vs W4 have meaningfully different “sharpness” (price per bar), threshold altSlopeThr.
- Proportion (Price): |W1| and |W3| within propTolP× each other.
- Proportion (Time): W1W3 and W2W4 durations within propTolT×.
- W5 weaker than W3 (momentum divergence proxy).
A Motive is valid if:
- Impulse: all 3 hard rules pass and guideline passes ≥ Min guideline passes.
- Diagonal: diagonal-eligible and guideline passes ≥ Min guideline passes.
- if motive fails, the engine still evaluates ABC as Zigzag and Flat to populate the table:
- Zigzag: B shallower than ~0.618A; C ≈ A or 1.618A (±fibTol).
- Flat: B ≥ ~0.9A; expanded flat if B > 1.0A and C in *A; “running” note if C < A.
3) Signal logic (consensus-gated & scored)
Signals fire only on new Small pivots and only if a Small motive just validated:Direction comes from the motive’s W1 (up = bull, down = bear).
Consensus checks (from the loop):
Use Sell consensus if the last pivot is a High, or Buy consensus if it’s a Low.Require it ≥ Min SMALL loop consensus and ahead of the opposite side by at least Min consensus margin.If you also require Large quality: check the corresponding Large consensus ≥ Min LARGE loop consensus.
Alignment: If Require small/large directional alignment is ON, Small and Large directions must match (or the Large motive must be complete).
Score:
- If Large not required: finalScore = smallConsensus × smallQuality.
- If Large required: finalScore = smallConsensus × smallQuality × largeQuality.
- Need finalScore ≥ Min final score.
When all gates pass, you’ll see “Buy xx%” or “Sell xx%” at the pivot.
Inputs (explained):
- Smaller Wave Swing Detection (Looped)
- Small Left Min / Max (default 3..6): ta.pivot* left widths to scan.
- Small Right Min / Max (default 0..0): right widths to scan (0 = earliest confirmation).
- Small Minimum swing % (post-aggregation) (0.3%): filters out tiny swings after the loop.
- Larger Wave Swing Detection (Looped)
- Large Left Min / Max (100..200) and Right Min/Max (0..0): higher-degree scan (defaults are big; adjust for intraday).
- Large Minimum swing % (post-aggregation) (1.5%).
- Loop Filters (inside the loop)
- Small loop min % change (0.20%): a candidate pivot counts only if move vs. last opposite Small swing ≥ this.
- Large loop min % change (1.50%): same idea for Large.
Rule Engine Tolerances
- Fibonacci tolerance (±%) (0.05 = 5%): closeness to Fib levels.
-Same-degree TIME proportion max (x) (2.00×) and PRICE proportion max (x) (3.00×).
- Alternation slope ratio threshold (0.10): higher = stricter alternation.
- Min guideline passes (0–7) (5): threshold for motive validity.
- Signal Probability (Loop Consensus)
- Min SMALL loop consensus (0.60).
- Min LARGE loop consensus (0.50) (used only if Large validation matters).
- Min consensus margin vs opposite (0.10): e.g., 0.60 vs 0.45 fails (margin 0.15 passes).
Require LARGE 1–5 valid (or diagonal) for signal (off by default).
Min final score (0.20): gate on the composite score.
Annotate label with score % (on).
WARN (orange): guideline not met—pattern can still be valid if total passes ≥ Min guideline passes.
FAQ
Q: Why did I get a diagonal instead of an impulse?
A: Wave-4 overlapped Wave-1 (Rule 3). If Rules 1 & 2 pass and guidelines meet your minimum, it’s eligible as a Diagonal.
Q: Where do Buy/Sell labels come from?
A: Only after a valid Small motive at a new pivot, and only if consensus, alignment, and final score gates pass (per your settings).
Q: It “missed” a wave in hindsight.
A: Pivots require right bars to confirm; extremely tight settings can filter that swing; adjust Small min % or ranges.
Q: Are there repaints?
A: No, It uses standard pivot confirmation; until a pivot is confirmed, recent swings can evolve. After confirmation, lines/labels are stable.
Limitations & disclaimers
Elliott/NeoWave rules are heuristics; markets are messy. Treat outputs as structured context, not certainty.
Consensus is pattern-scan agreement, not probability of profit Not investment advice; always couple with risk management.

Malama's Quantum Swing Modulator# Multi-Indicator Swing Analysis with Probability Scoring
## What Makes This Script Original
This script combines pivot point detection with a **weighted scoring system** that dynamically adjusts indicator weights based on market regime (trending vs. ranging). Unlike standard multi-indicator approaches that use fixed weightings, this implementation uses ADX to detect market conditions and automatically rebalances the influence of RSI, MFI, and price deviation components accordingly.
## Core Methodology
**Dynamic Weight Allocation System:**
- **Trending Markets (ADX > 25):** Prioritizes momentum (50% weight) with reduced oscillator influence (20% each for RSI/MFI)
- **Ranging Markets (ADX < 25):** Emphasizes mean reversion signals (40% each for RSI/MFI) with no momentum bias
- **Price Wave Component:** Uses EMA deviation normalized by ATR to measure distance from central tendency
**Pivot-Based Level Analysis:**
- Detects swing highs/lows using configurable left/right lookback periods
- Maintains the most recent pivot levels as key reference points
- Calculates proximity scores based on current price distance from these levels
**Volume Confirmation Logic:**
- Defines "volume entanglement" when current volume exceeds SMA by user-defined factor
- Integrates volume confirmation into confidence scoring rather than signal generation
## Technical Implementation Details
**Scoring Algorithm:**
The script calculates separate bullish and bearish "superposition" scores using:
```
Bullish Score = (RSI_bull × weight) + (MFI_bull × weight) + (price_wave × weight × position_filter) + (momentum × weight)
```
Where:
- RSI_bull = 100 - RSI (inverted for oversold bias)
- MFI_bull = 100 - MFI (inverted for oversold bias)
- Position_filter = Only applies when price is below EMA for bullish signals
- Momentum component = Only active in trending markets
**Confidence Calculation:**
Base confidence starts at 25% and increases based on:
- Market regime alignment (trending/ranging appropriate conditions)
- Volume confirmation presence
- Oscillator extreme readings (RSI < 30 or > 70 in ranging markets)
- Price position relative to wave function (EMA)
**Probability Output:**
Final probability = (Base Score × 0.6) + (Proximity Score × 0.4)
This balances indicator confluence with proximity to identified levels.
## Key Differentiators
**vs. Standard Multi-Indicator Scripts:** Uses regime-based dynamic weighting instead of fixed combinations
**vs. Simple Pivot Indicators:** Adds quantified probability and confidence scoring to pivot levels
**vs. Basic Oscillator Combinations:** Incorporates market structure analysis through ADX regime detection
## Visual Components
**Wave Function Display:** EMA with ATR-based uncertainty bands for trend context
**Pivot Markers:** Clear visualization of detected swing highs and lows
**Analysis Table:** Real-time probability, confidence, and action recommendations for current pivot levels
## Practical Application
The dynamic weighting system helps avoid common pitfalls of multi-indicator analysis:
- Reduces oscillator noise during strong trends by emphasizing momentum
- Increases mean reversion sensitivity during sideways markets
- Provides quantified probability rather than subjective signal interpretation
## Important Limitations
- Requires sufficient historical data for pivot detection and volume calculations
- Probability scores are based on current market regime and may change as conditions evolve
- The scoring system is designed for confluence analysis, not standalone trading decisions
- Past probability accuracy does not guarantee future performance
## Technical Requirements
- Works on all timeframes but requires adequate lookback history
- Volume data required for entanglement calculations
- Best suited for liquid instruments where volume patterns are meaningful
This approach provides a systematic framework for evaluating swing trading opportunities while acknowledging the probabilistic nature of technical analysis.

EMA Sunset WavesThis script displays a set of Exponential Moving Averages (EMAs) (20, 50, 100, and 200) with a clean and immersive design:
Lines automatically change color based on trend direction (uptrend or downtrend).
Dynamic fill zones highlight whether the price is trading above or below each EMA.
Full color customization (bullish/bearish lines, fill zones, transparency).
Adjustable line thickness for better chart readability.
🎨 The idea is to make trend reading visual, intuitive, and aesthetic at first glance.
⚙️ Configurable settings:
EMA lengths (default 20/50/100/200).
Colors for bullish and bearish EMAs.
Fill colors (above/below price).
Transparency and line thickness.

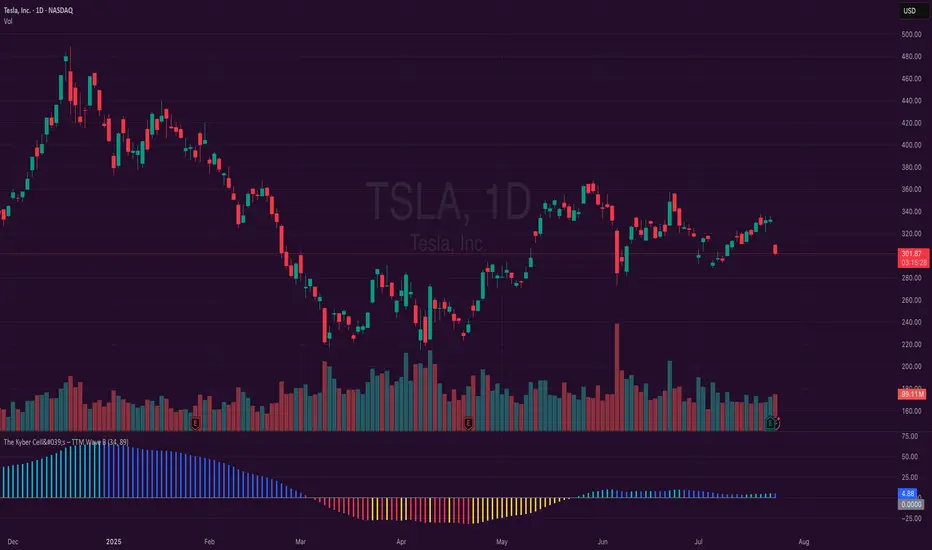
The Kyber Cell's – TTM Wave BKyber Cell’s Wave B – TTM Squeeze Trend Confirmation Histogram
⸻
1. Introduction
Wave B acts as the trend validator in the TTM Squeeze suite. While Wave A reveals the heartbeat of momentum, Wave B focuses on the directional stability of price. It answers a critical question for traders: Is the trend in my favor, or am I trading against the dominant force?
Built for confirming entries and filtering out low-probability setups, Kyber Cell’s Wave B applies a smoother, more deliberate view of trend structure using configurable moving average logic. This makes it ideal for preventing false starts and improving trade alignment — particularly in combination with Wave A and squeeze-fire signals.
⸻
2. Core Concept and Calculation
Unlike Wave A, which tracks short-term price bursts, Wave B focuses on trend direction and consistency. It typically derives its signal from one of two engines:
• EMA-Based Method: Compares short-term EMA (e.g., 8) to a longer EMA (e.g., 21) to determine directional bias.
• HMA-Based Method: Measures slope and crossover behavior between fast and slow Hull Moving Averages (e.g., HMA 34 and HMA 144) for a smoother trend read.
These calculations produce a histogram that doesn’t fluctuate rapidly like Wave A, but instead stabilizes around sustained trend strength. As such, Wave B excels at confirming whether a move has backing from the broader market structure.
⸻
3. Visual Output and Color Logic
Wave B uses a 3-color histogram to clearly define trend state:
• Bright Blue: Bullish trend
• Bright Red: Bearish trend
• Gray: Neutral or transitioning state (indecision)
This simplified color scheme helps traders avoid information overload and focus on whether the market is structurally aligned for long or short entries.
• When paired with a squeeze-fire and rising Wave A, a blue Wave B bar signals strong confirmation to go long.
• Conversely, a red Wave B bar during a squeeze-fire and falling Wave A confirms bearish setups.
• A gray bar typically signals trend conflict, indecision, or transitional environments — and should be treated as a caution flag.
⸻
4. Ideal Use Case
Wave B is best used as a filter and confirmation layer in your trading workflow:
1. Identify a squeeze setup (using Squeeze Pro or dots indicator).
2. Confirm with Wave A: Look for a fresh momentum push (cyan or red bars).
3. Validate with Wave B:
• Only take long trades when Wave B is blue.
• Only take short trades when Wave B is red.
• Avoid or delay trades when Wave B is gray.
4. Ride the trend until Wave B flips or Wave A fades.
This reduces emotional decision-making and keeps your trades aligned with the prevailing bias, especially on higher timeframes or in choppy conditions.
⸻
5. Configuration and Customization
Wave B is designed with enough flexibility to adapt to different trading styles while remaining streamlined:
• Trend Engine Selection: Choose between EMA-based or HMA-based logic.
• Moving Average Lengths: Customize the short- and long-term periods.
• Color Customization: Adjust bar colors to match your chart theme or visibility needs.
• Bar Thickness and Positioning: Optional visual tweaks depending on your chart layout.
The goal is to provide just enough configurability to integrate seamlessly with Wave A and Squeeze Pro, without diluting the core purpose: trend clarity.
⸻
6. Alerts and Add-ons
Wave B can be extended with basic or advanced alerts, depending on your needs:
• Alert on trend flips (blue → red or red → blue)
• Alert on return to neutral (gray bars)
• Combined alerts with squeeze and momentum signals for high-confluence trades
When integrated with other components, Wave B becomes an essential part of a multi-layered confirmation system.
⸻
7. Disclaimer
This indicator is provided for educational purposes only and is not financial advice. No trading decision should be made solely on the basis of this tool. All users should test their strategies, assess their own risk tolerance, and consider using Wave B as part of a broader technical framework.
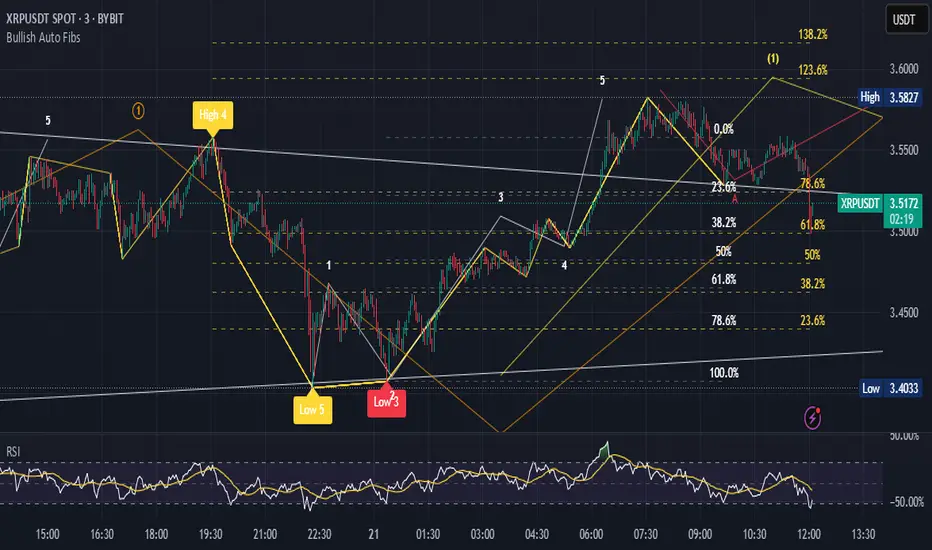
Bullish Auto FibsBullish Auto Fibs Indicator
Description
The Bullish Auto Fibs indicator is a sophisticated tool designed for traders on the TradingView platform, specifically tailored for analyzing bullish price movements on XRP and other assets. It automatically plots Fibonacci retracement, B Wave, and extension levels based on a customizable ZigZag pattern, providing clear visual cues for potential support, resistance, and price targets. With a focus on the 15-minute timeframe, this indicator enhances technical analysis by dynamically updating Fibonacci levels as new pivot highs and lows are detected, ensuring traders stay aligned with evolving market trends.
Key Features:
Automatic Fibonacci Levels: Plots retracement (23.6%, 38.2%, 50%, 61.8%, 78.6%), B Wave (23.6% to 161.8%), and extension (100%, 161.8%, 261.8%) levels.
Dynamic ZigZag Detection: Identifies pivot highs and lows with an adjustable length (1–100 bars, default 20).
Real-Time Updates: Adjusts Fibonacci levels when new highs (for retracements) or lows (for B Wave and extensions) are detected, preserving key reference points like the B Wave pivot high.
Customizable Display: Toggle visibility for retracement, B Wave, and extension levels to suit your analysis needs.
Visual Clarity: Uses distinct colors (gray for retracements, yellow for B Wave, green for extensions) and labels for easy interpretation.
This indicator is ideal for traders employing Elliott Wave theory, Fibonacci-based strategies, or trend-following approaches, offering a robust framework for identifying key price levels in bullish markets.
User Manual
Configuration
The indicator’s settings can be adjusted via the “Settings” panel in TradingView:
Yellow ZigZag Length (default: 20, range: 1–100): Controls the sensitivity of pivot detection. Higher values detect more significant pivots; lower values increase sensitivity for shorter-term swings.
Show Retracement Fibs (default: true): Enable/disable retracement levels (low to high, 0% at high, 100% at low).
Show B Wave Fibs (default: true): Enable/disable B Wave levels (high to low, 100% at high, 0% at low, with extensions up to 161.8%).
Show Extension Fibs (default: true): Enable/disable extension levels (pivot low as 0%, projecting upward).
How It Works
ZigZag Pattern:
The indicator identifies pivot highs and lows using the ta.pivothigh and ta.pivotlow functions, with the specified yellowLength.
Pivots are marked with “H” (high) or “L” (low) labels in yellow.
Fibonacci Levels:
Retracement Fibs: Drawn from a pivot low (100%) to a pivot high (0%). Updates to a new high if detected, maintaining the original low.
B Wave Fibs: Drawn from a pivot high (100%) to a pivot low (0%), with extensions above 100%. Updates to a new low if detected, preserving the original high.
Extension Fibs: Drawn from a pivot low (0%) upward, based on the prior low-to-high wave length. Updates to a new low if detected.
Dynamic Updates:
Lines and labels extend to the current bar for active Fibonacci levels, ensuring real-time relevance.
When a new pivot is detected, previous levels are cleared, and new levels are drawn to reflect the latest price structure.
Usage Tips
Trend Confirmation: Use retracement levels to identify potential support zones during pullbacks in a bullish trend.
B Wave Analysis: Leverage B Wave levels for corrective wave targets, especially in Elliott Wave strategies.
Price Targets: Extension levels highlight potential bullish continuation zones.
Timeframe Flexibility: While optimized for 15-minute charts, adjust yellowLength for higher (e.g., 50–100) or lower (e.g., 5–10) timeframes.
Combine with Other Tools: Pair with trend indicators (e.g., moving averages) or oscillators (e.g., RSI) for enhanced decision-making.
Troubleshooting
No Levels Displayed: Ensure at least two pivots (high and low) are detected. Increase yellowLength if pivots are sparse.
Overlapping Labels: Reduce chart zoom or toggle off unnecessary Fibonacci types to declutter.
Performance Issues: The indicator limits arrays to 500 entries to prevent slowdowns. Older pivots are automatically removed.
Notes
The indicator is optimized for bullish markets but can be adapted for other assets by adjusting the ZigZag length.
For best results, test settings on historical data to align with your trading style.
GCM Bull Bear RiderGCM Bull Bear Rider (GCM BBR)
Your Ultimate Trend-Riding Companion
GCM Bull Bear Rider is a comprehensive, all-in-one trend analysis tool designed to eliminate guesswork and provide a crystal-clear view of market direction. By leveraging a highly responsive Jurik Moving Average (JMA), this indicator not only identifies bullish and bearish trends with precision but also tracks their performance in real-time, helping you ride the waves of momentum from start to finish.
Whether you are a scalper, day trader, or swing trader, the GCM BBR adapts to your style, offering a clean, intuitive, and powerful visual guide to the market's pulse.
Key Features
JMA-Powered Trend Lines (UTPL & DTPL): The core of the indicator. A green "Up Trend Period Line" (UTPL) appears when the JMA's slope turns positive (buyers are in control), and a red "Down Trend Period Line" (DTPL) appears when the slope turns negative (sellers are in control). The JMA is used for its low lag and superior smoothing, giving you timely and reliable trend signals.
Live Profit Tracking Labels: This is the standout feature. As soon as a trend period begins, a label appears showing the real-time profit (P:) from the trend's starting price. This label moves with the trend, giving you instant feedback on its performance and helping you make informed trade management decisions.
Historical Performance Analysis: The profit labels remain on the chart for completed trends, allowing you to instantly review past performance. See at a glance which trends were profitable and which were not, aiding in strategy refinement and backtesting.
Automatic Chart Decluttering: To keep your chart clean and focused on significant moves, the indicator automatically removes the historical profit label for any trend that fails to achieve a minimum profit threshold (default is 0.5 points).
Dual-Ribbon Momentum System:
JMA / Short EMA Ribbon: Visualizes short-term momentum. A green fill indicates immediate bullish strength, while a red fill shows bearish pressure.
Short EMA / Long EMA Ribbon: Acts as a long-term trend filter, providing broader market context for your decisions.
"GCM Hunt" Entry Signals: The indicator includes optional pullback entry signals (green and red triangles). These appear when the price pulls back to a key moving average and then recovers in the direction of the primary trend, offering high-probability entry opportunities.
How to Use
Identify the Trend: Look for the appearance of a solid green line (UTPL) for a bullish bias or a solid red line (DTPL) for a bearish bias. Use the wider EMA ribbon for macro trend confirmation.
Time Your Entry: For aggressive entries, you can enter as soon as a new trend line appears. For more conservative entries, wait for a "GCM Hunt" triangle signal, which confirms a successful pullback.
Ride the Trend & Manage Your Trade: The moving profit label (P:) is your guide. As long as the trend line continues and the profit is increasing, you can confidently stay in the trade. A flattening JMA or a decreasing profit value can signal that the trend is losing steam.
Focus Your Strategy: Use the Display Mode setting to switch between "Buyers Only," "Sellers Only," or both. This allows you to completely hide opposing signals and focus solely on long or short opportunities.
Core Settings
Display Mode: The master switch. Choose to see visuals for "Buyers & Sellers," "Buyers Only," or "Sellers Only."
JMA Settings (Length, Phase): Fine-tune the responsiveness of the core JMA engine.
EMA Settings (Long, Short): Adjust the lengths of the moving averages that define the ribbons and "Hunt" signals.
Label Offset (ATR Multiplier): Customize the gap between the trend lines and the profit labels to avoid overlap with candles.
Filters (EMA, RSI, ATR, Strong Candle): Enable or disable various confirmation filters to strengthen the "Hunt" entry signals according to your risk tolerance.
Add the GCM Bull Bear Rider to your chart today and transform the way you see and trade the trend!
ENJOY

Fibonacci Optimal Entry Zone [OTE] (Zeiierman)█ Overview
Fibonacci Optimal Entry Zone (Zeiierman) is a high-precision market structure tool designed to help traders identify ideal entry zones during trending markets. Built on the principles of Smart Money Concepts (SMC) and Fibonacci retracements, this indicator highlights key areas where price is most likely to react — specifically within the "Golden Zone" (between the 50% and 61.8% retracement).
It tracks structural pivot shifts (CHoCH) and dynamically adjusts Fibonacci levels based on real-time swing tracking. Whether you're trading breakouts, pullbacks, or optimal entries, this tool brings unparalleled clarity to structure-based strategies.
Ideal for traders who rely on confluence, this indicator visually synchronizes swing highs/lows, market structure shifts, Fibonacci retracement levels, and trend alignment — all without clutter or lag.
⚪ The Structural Assumption
Price moves in waves, but key retracements often lead to continuation or reversal — especially when aligned with structure breaks and trend shifts.
The Optimal Entry Zone captures this behavior by anchoring Fibonacci levels between recent swing extremes. The most powerful area — the Golden Zone — marks where institutional re-entry is likely, providing traders with a sniper-like roadmap to structure-based entries.
█ How It Works
⚪ Structure Tracking Engine
At its core, the indicator detects pivots and classifies trend direction:
Structure Period – Determines the depth of pivots used to detect swing highs/lows.
CHoCH – Break of structure logic identifies where the trend shifts or continues, marked visually on the chart.
Bullish & Bearish Modes – Independently toggle uptrend and downtrend detection and styling.
⚪ Fibonacci Engine
Upon each confirmed structural shift, Fibonacci retracement levels are projected between swing extremes:
Custom Levels – Choose which retracements (0.50, 0.618, etc.) are shown.
Real-Time Adjustments – When "Swing Tracker" is enabled, levels and labels update dynamically as price forms new swings.
Example:
If you disable the Swing Tracker, the Golden Level is calculated using the most recent confirmed swing high and low.
If you enable the Swing Tracker, the Golden Level is calculated from the latest swing high or low, making it more adaptive as the trend evolves in real time.
█ How to Use
⚪ Structure-Based Entry
Wait for CHoCH events and use the resulting Fibonacci projection to identify entry points. Enter trades as price taps into the Golden Zone, especially when confluence forms with swing structure or order blocks.
⚪ Real-Time Reaction Tracking
Enable Swing Tracker to keep the tool live — constantly updating zones as price shifts. This is especially useful for scalpers or intraday traders who rely on fresh swing zones.
█ Settings
Structure Period – Number of bars used to define swing pivots. Larger values = stronger structure.
Swing Tracker – Auto-updates fib levels as new highs/lows form.
Show Previous Levels – Keep older fib zones on chart or reset with each structure shift.
-----------------
Disclaimer
The content provided in my scripts, indicators, ideas, algorithms, and systems is for educational and informational purposes only. It does not constitute financial advice, investment recommendations, or a solicitation to buy or sell any financial instruments. I will not accept liability for any loss or damage, including without limitation any loss of profit, which may arise directly or indirectly from the use of or reliance on such information.
All investments involve risk, and the past performance of a security, industry, sector, market, financial product, trading strategy, backtest, or individual's trading does not guarantee future results or returns. Investors are fully responsible for any investment decisions they make. Such decisions should be based solely on an evaluation of their financial circumstances, investment objectives, risk tolerance, and liquidity needs.

Machine Learning Adaptive Trend Toolkit [Velowave]The Machine Learning Adaptive Trend Toolkit is a technical analysis tool that combines adaptive algorithms with comprehensive market feature extraction to provide insights into changing market conditions. Unlike static indicators with fixed parameters, this system continuously analyzes and adapts to the evolving market environment.
Core Technology
At the heart of this system is a dynamic approach to market analysis:
• Feature Engineering Pipeline: Extracts and normalizes volatility, momentum, volume, and trend strength metrics
• Market Regime Classification: Identifies 10 distinct market environments including trending, ranging, breakout, and reversal conditions
• Parameter Optimization: Automatically adjusts sensitivity based on detected market conditions
• Dynamic Wave Technology: Creates adaptive support/resistance levels that respond to changing volatility
⚠️ Signal Interpretation
Important: The indicator's wave crosses should be interpreted as trend change signals rather than direct buy/sell recommendations. These signals represent potential trend changes based on adaptive parameters, but require confirmation from other analysis before making trading decisions.
(Image showing example color customizability)
Custom Candle Behavior
The custom candlesticks in this indicator are designed to enhance trend visualization but will behave differently than default candlesticks:
• They use linear regression smoothing to reduce noise
• Their coloring is based on position relative to the adaptive wave, not merely open/close relationships
• They may show different patterns than traditional candlesticks on the same chart
• Trading strategies developed using traditional candlestick patterns may not apply directly to these custom candles
This modified representation helps visualize trend conditions more clearly but should be understood as an analytical tool rather than a direct replacement for traditional price action analysis.
Practical Applications
• Trend Identification
The adaptive wave system provides clear visualization of trend direction and strength, with dynamic support and resistance levels that adjust to current volatility conditions.
• Volatility-Adjusted Analysis
Parameters automatically optimize during high and low volatility periods, preventing false signals during consolidation while remaining responsive during breakouts.
• Regime-Based Strategy Selection
Knowing the current market regime allows you to apply appropriate trading techniques for specific conditions rather than using a one-size-fits-all approach.
• Visual Price Action Analysis
Enhanced candlestick coloring instantly communicates price position relative to the adaptive trend, helping you process market information more efficiently.
(Image showing only the supertrend wave and dynamic moving average)
Technical Components
• Adaptive Wave Algorithm: Creates dynamic support/resistance bands based on volatility, volume, and detected regime
• Dynamic Moving Average: Period automatically adjusts based on market conditions - shorter in trending markets, longer in ranging conditions
• Market Regime Engine: Continuously analyzes feature patterns to classify current conditions
• Custom Candlestick Visualization: Provides instant visual feedback on trend position and momentum
Implementation Details
For full transparency, the core calculations include:
• Volatility normalization through comparative ATR analysis
• Momentum feature extraction using multi-timeframe momentum indicators
• Trend strength quantification through price structure analysis
• Regime detection through feature pattern recognition
• Adaptive parameter adjustment based on detected market conditions
The system uses only historical and current price data for its calculations and analyses. It does not use predictive methodologies that could lead to misleading results. The indicator will show different values on an open bar than it will after the bar closes, which is standard behavior for indicators that use closing prices in their calculations.
Risk Disclaimer:
Trading involves significant risk. This indicator is designed as an analytical tool to enhance decision-making, not as a standalone trading system. Past performance is not indicative of future results.

[iQ]PRO Ultimate Financial Analysis Tool And System SynergyUltimate Financial Analysis Tool And System Synergy (UFATASS)
Advanced Market Insights with Cycle Analysis, Trend Forecasting, and Risk Monitoring
The Ultimate Financial Analysis Tool And System Synergy (UFATASS) is a powerful indicator designed to give traders a deeper understanding of market dynamics. By blending cutting-edge techniques from signal processing, statistics, and dynamical systems theory, UFATASS provides a unique, all-in-one solution for technical analysis.
Key Features
Cycle Detection:
Pinpoints dominant market cycles using advanced spectral analysis, helping you identify potential turning points.
Trend Analysis:
Delivers multiple regression lines to capture short-term and long-term market trends, with a customizable complexity setting for precision.
Probability Forecasts:
Uses Monte Carlo simulations to estimate the likelihood of future price movements, offering a probabilistic edge for decision-making.
Risk Monitoring:
Tracks volatility and market stability, featuring an experimental chaos indicator based on Lyapunov exponents to assess price predictability.
Customization Options
Adjust the indicator to fit your trading style:
Cycle and regression lookback periods
Complexity factor for regression sensitivity
Volatility calculation window
Forecast horizon for price predictions
Visual Outputs
Price and regression lines plotted on the main chart
Cycle details and wave visuals in a separate pane
A summary label on the last bar with key metrics (e.g., cycle length, probabilities)
Background color alerts to signal risk levels
How to Use
Incorporate UFATASS into your strategy to:
Anticipate reversals with cycle analysis
Confirm trends using regression insights
Plan entries and exits with probability forecasts
Monitor market conditions and adjust risk exposure

cashdata by farashahThis indicator is designed to generate wave charts following the NeoWave method.
NeoWave, developed by Glenn Neely in 1990, offers a scientific and objective approach to wave analysis.
A Cash Data is essential for accurate analysis, requiring highs and lows to be plotted in the exact order they occurred—a process that can be complex and time-consuming.
The indicator automates this process by identifying highs and lows for any symbol and timeframe, plotting them in real-time.
For instance, on a monthly timeframe, it finds yearly highs and lows and arranges them sequentially, forming a "Yearly Wave Chart" for NeoWave analysis.
•Generates Wave Charts for multiple timeframes(yearly, monthly, weekly, daily, hourly, minutely).
• Provides real-time auto-updating Wave Charts.
• Supports plotting based on calendar time, bar count, or equal distances.
• Compatible with all account types.

Crypto Scanner v4This guide explains a version 6 Pine Script that scans a user-provided list of cryptocurrency tokens to identify high probability tradable opportunities using several technical indicators. The script combines trend, momentum, and volume-based analyses to generate potential buying or selling signals, and it displays the results in a neatly formatted table with alerts for trading setups. Below is a detailed walkthrough of the script’s design, how traders can interpret its outputs, and recommendations for optimizing indicator inputs across different timeframes.
## Overview and Key Components
The script is designed to help traders assess multiple tokens by calculating several indicators for each one. The key components include:
- **Input Settings:**
- A comma-separated list of symbols to scan.
- Adjustable parameters for technical indicators such as ADX, RSI, MFI, and a custom Wave Trend indicator.
- Options to enable alerts and set update frequencies.
- **Indicator Calculations:**
- **ADX (Average Directional Index):** Measures trend strength. A value above the provided threshold indicates a strong trend, which is essential for validating momentum before entering a trade.
- **RSI (Relative Strength Index):** Helps determine overbought or oversold conditions. When the RSI is below the oversold level, it may present a buying opportunity, while an overbought condition (not explicitly part of this setup) could suggest selling.
- **MFI (Money Flow Index):** Similar in concept to RSI but incorporates volume, thus assessing buying and selling pressure. Values below the designated oversold threshold indicate potential undervaluation.
- **Wave Trend:** A custom indicator that calculates two components (WT1 and WT2); a crossover where WT1 moves from below to above WT2 (particularly near oversold levels) may signal a reversal and a potential entry point.
- **Scanning and Trading Zone:**
- The script identifies a *bullish setup* when the following conditions are met for a token:
- ADX exceeds the threshold (strong trend).
- Both RSI and MFI are below their oversold levels (indicating potential buying opportunities).
- A Wave Trend crossover confirms near-term reversal dynamics.
- A *trading zone* condition is also defined by specific ranges for ADX, RSI, MFI, and a limited difference between WT1 and WT2. This zone suggests that the token might be in a consolidation phase where even small moves may be significant.
- **Alerts and Table Reporting:**
- A table is generated, with each row corresponding to a token. The table contains columns for the symbol, ADX, RSI, MFI, WT1, WT2, and the trading zone status.
- Visual cues—such as different background colors—highlight tokens with a bullish setup or that are within the trading zone.
- Alerts are issued based on the detection of a bullish setup or entry into a trading zone. These alerts are limited per bar to avoid flooding the trader with notifications.
## How to Interpret the Indicator Outputs
Traders should use the indicator values as guidance, verifying them against their own analysis before making any trading decision. Here’s how to assess each output:
- **ADX:**
- **High values (above threshold):** Indicate strong trends. If other indicators confirm an oversold condition, a trader may consider a long position for a corrective reversal.
- **Low values:** Suggest that the market is not trending strongly, and caution should be taken when considering entry.
- **RSI and MFI:**
- **Below oversold levels:** These conditions are traditionally seen as signals that an asset is undervalued, potentially triggering a bounce.
- **Above typical resistance levels (not explicitly used here):** Would normally caution a trader against entering a long position.
- **Wave Trend (WT1 and WT2):**
- A crossover where WT1 moves upward above WT2 in an oversold environment can signal the beginning of a recovery or reversal, thereby reinforcing buy signals.
- **Trading Zone:**
- Being “in zone” means that the asset’s current values for ADX, RSI, MFI, and the closeness of the Wave Trend lines indicate a period of consolidation. This scenario might be suitable for both short-term scalping or as an early exit indicator, depending on further market analysis.
## Timeframe Optimization Input Table
Traders can optimize indicator inputs depending on the timeframe they use. The following table provides a set of recommended input values for various timeframes. These values are suggestions and should be adjusted based on market conditions and individual trading styles.
Timeframe ADX RSI MFI ADX RSI MFI WT Channel WT Average
5-min 10 10 10 20 30 20 7 15
15-min 12 12 12 22 30 20 9 18
1-hour 14 14 14 25 30 20 10 21
4-hour 16 16 16 27 30 20 12 24
1-day 18 18 18 30 30 20 14 28
Adjust these parameters directly in the script’s input settings to match the selected timeframe. For shorter timeframes (e.g., 5-min or 15-min), the shorter lengths help filter high-frequency noise. For longer timeframes (e.g., 1-day), longer input values may reduce false signals and capture more significant trends.
## Best Practices and Usage Tips
- **Token Limit:**
- Limit the number of tokens scanned to 10 per query line. If you need to scan more tokens, initiate a new query line. This helps manage screen real estate and ensures the table remains legible.
- **Confirming Signals:**
- Use this script as a starting point for identifying high potential trades. Each indicator’s output should be used to confirm your trading decision. Always cross-reference with additional technical analysis tools or market context.
- **Regular Review:**
- Since the script updates the table every few bars (as defined by the update frequency), review the table and alerts regularly. Market conditions change rapidly, so timely decisions are crucial.
## Conclusion
This Pine Script provides a comprehensive approach for scanning multiple cryptocurrencies using a combination of trend strength (ADX), momentum (RSI and MFI), and reversal signals (Wave Trend). By using the provided recommendation table for different timeframes and limiting the tokens to 20 per query line (with a maximum of four query lines), traders can streamline their scanning process and more effectively identify high probability tradable tokens. Ultimately, the outputs should be critically evaluated and combined with additional market research before executing any trades.

Daily COC Strategy with SHERLOCK WAVESThis indicator implements a unique trading strategy known as the "Daily COC (Candle Over Candle) Strategy" enhanced with "SHERLOCK WAVES" for pattern recognition. It's designed for traders looking to capitalize on specific candlestick formations with a negative risk-reward ratio, with the aim of achieving a high win rate (over 70%) through numerous trading opportunities, despite each trade having a higher risk relative to the reward.
Key Features:
Pattern Recognition: Identifies a setup based on three consecutive candles - a red candle followed by a shooting star, then an entry candle that does not break below the shooting star's low.
Negative Risk/Reward Trade Selection: Focuses on entries where the potential stop loss is greater than the take profit, banking on a high win rate to offset the individual trade's negative risk-reward ratio.
Visual Signals:
Green Label: Marks potential entry points at the high of the candle before the entry.
Green Dot: Indicates a winning trade closure.
Red Dot: Signals a losing trade closure.
Blue Circle: Warns when the current candle is within 2% of breaking above the previous candle's high, suggesting a potential setup is developing.
Green Circle: Plots the take profit level.
Red Circle: Plots the stop loss level.
Dynamic Statistics: A live updating label showing the number of trades, wins, losses, open trades, current account balance, and win percentage.
Customizable Parameters:
Risk % per Trade: Adjust the percentage of your account balance you're willing to risk on each trade.
Initial Account Balance: Set your starting balance for tracking performance.
Start Date for Strategy: Define when the strategy should start calculating from, allowing for backtesting.
Alerts:
An alert condition is set for when a potential trade setup is developing, helping traders prepare for entries.
Usage Tips:
This strategy is predicated on the idea that a high win rate can compensate for the negative risk-reward ratio of individual trades. It might not suit all market conditions or traders' risk profiles.
Use this strategy in conjunction with other analysis methods to validate trade setups.
Note: Always backtest thoroughly before applying to live markets. Consider this tool as part of a broader trading strategy, not a standalone solution. Monitor your win rate and adjust your risk management accordingly to ensure the strategy remains profitable over time.
This description now correctly explains the purpose behind the negative risk-reward ratio in the context of your trading strategy.

Alternate Bat Harmonic Pattern [TradingFinder] ALT Bat Indicator🔵 Introduction
The Alternate Bat harmonic pattern is one of the most precise and practical tools in technical analysis, introduced by Scott Carney in 2003. This pattern focuses on specific Fibonacci ratios, such as 0.382 at point B and 1.13XA at point D, to identify Potential Reversal Zones (PRZ) where price is likely to reverse.
The Alternative Bat pattern emerged as a result of repeated failures observed in the standard Bat pattern. Traders entering trades near the 0.886XA level of the standard Bat often encountered losses. In the Alternate Bat, point D extends beyond 0.886XA, typically reversing at 1.13XA, offering a more accurate identification of the reversal zone.
A key characteristic of this pattern is its M- or W-shaped structure, where the midpoint B retraces 0.382XA or less. Additionally, the CD leg requires an extension of 2.0 to 3.618 to complete the pattern. Due to its accuracy and the predictable behavior of price near the PRZ, the Alternate Bat pattern is recognized as a powerful tool for forecasting price reversals.
In the bullish Alternative Bat pattern, an M-shaped structure forms. After an initial upward movement (XA), price undergoes a short correction at point B (0.382XA) and then declines toward point D (1.13XA and an extension of 2.0 to 3.618BC), where a potential upward reversal is expected.
In the bearish Alternate Bat pattern, a W-shaped structure forms. After an initial downward movement (XA), price retraces slightly at point B (0.382XA) and then rises toward point D (1.13XA and an extension of 2.0 to 3.618BC), where a potential downward reversal is anticipated.
🔵 How to Use
The Alternate Bat harmonic pattern is a key tool for identifying potential reversal zones (PRZ) in the market. By leveraging the 0.382 retracement at point B and the 1.13XA extension at point D, along with symmetrical price structures, this pattern offers precise reversal opportunities in both bullish and bearish market conditions.
🟣 Bullish Alternate Bat Pattern
The bullish Alternate Bat pattern forms during a downtrend, signaling a potential reversal to the upside. This pattern consists of three downward movements with two corrective waves, ultimately reaching point D, which marks the PRZ.
At the PRZ, the convergence of Fibonacci levels—1.13XA and extensions ranging from 2.0 to 3.618BC—creates a strong support zone where price is likely to reverse upward.
🟣 Bearish Alternative Bat Pattern
The bearish Alternate Bat pattern develops during an uptrend, indicating a potential reversal to the downside. This pattern features three upward price movements with two retracements, ending at point D, where the PRZ forms.
Point D is defined by the 1.13XA extension and the 2.0 to 3.618BC projection, creating a strong resistance zone where price is expected to reverse downward.
🔵 Setting
🟣 Logical Setting
ZigZag Pivot Period : You can adjust the period so that the harmonic patterns are adjusted according to the pivot period you want. This factor is the most important parameter in pattern recognition.
Show Valid Format : If this parameter is on "On" mode, only patterns will be displayed that they have exact format and no noise can be seen in them. If "Off" is, the patterns displayed that maybe are noisy and do not exactly correspond to the original pattern.
Show Formation Last Pivot Confirm : if Turned on, you can see this ability of patterns when their last pivot is formed. If this feature is off, it will see the patterns as soon as they are formed. The advantage of this option being clear is less formation of fielded patterns, and it is accompanied by the latest pattern seeing and a sharp reduction in reward to risk.
Period of Formation Last Pivot : Using this parameter you can determine that the last pivot is based on Pivot period.
🟣 Genaral Setting
Show : Enter "On" to display the template and "Off" to not display the template.
Color : Enter the desired color to draw the pattern in this parameter.
LineWidth : You can enter the number 1 or numbers higher than one to adjust the thickness of the drawing lines. This number must be an integer and increases with increasing thickness.
LabelSize : You can adjust the size of the labels by using the "size.auto", "size.tiny", "size.smal", "size.normal", "size.large" or "size.huge" entries.
🟣 Alert Setting
Alert : On / Off
Message Frequency : This string parameter defines the announcement frequency. Choices include: "All" (activates the alert every time the function is called), "Once Per Bar" (activates the alert only on the first call within the bar), and "Once Per Bar Close" (the alert is activated only by a call at the last script execution of the real-time bar upon closing). The default setting is "Once per Bar".
Show Alert Time by Time Zone : The date, hour, and minute you receive in alert messages can be based on any time zone you choose. For example, if you want New York time, you should enter "UTC-4". This input is set to the time zone "UTC" by default.
🔵 Conclusion
The Alternate Bat harmonic pattern, with its precise Fibonacci ratios like 0.382 and 1.13XA, is a reliable tool for identifying Potential Reversal Zones (PRZ) in financial markets. By recognizing symmetrical price structures and focusing on both bullish and bearish scenarios, traders can identify optimal entry and exit points with high accuracy.
The key strength of this pattern lies in its ability to define strong support and resistance zones near the PRZ, increasing the probability of price reversals. Combining the pattern with candlestick confirmations and volume analysis enhances its effectiveness.
Ultimately, incorporating the Alternative Bat pattern with proper risk management and Fibonacci-based targets allows traders to enter the market confidently and capitalize on potential price reversals.

Quantum Wave OscillatorQuantum Wave (QWO) Oscillator
Version: 1.0
Overview
Quantum Wave (QWO) is a dynamic oscillator designed to help traders identify potential buy and sell signals by analyzing price momentum relative to its moving average. Utilizing trigonometric transformations, Quantum Wave offers a clear visualization of market trends, making it easier to spot reversals and continuations.
Key Features
Customizable Parameters: Adjust the length and amplitude to fit various trading strategies and timeframes.
Dynamic Coloring: Colors change based on bullish (green) or bearish (red) momentum.
Clear Signals: Generates buy and sell signals when the oscillator crosses the zero line.
Clamped Waveform: Maintains values between -250 and 250 for clear visualization.
Signal Version Available: Enhanced version includes alert notifications for trading signals.
How to Use Quantum Wave
Add to Chart:
Open TradingView.
Go to Indicators and search for Quantum Wave (QWO).
Add it to your chart.
Configure Settings:
Length (len): Period for the SMA calculation (default: 14). Shorter lengths increase sensitivity.
Amplitude (amp): Strength of the oscillator signal (default: 2.0). Adjust to amplify or dampen responses.
Colors: Customize colors for above/below zero and buy/sell signals as desired.
Interpret the Oscillator:
Quantum Wave Plot: Green indicates bullish momentum; red indicates bearish.
Zero Line: Crosses above suggest buy signals; crosses below suggest sell signals.
Use the Signal Version:
Upgrade to the signal version to receive automated alerts for buy and sell signals, enhancing timely trading decisions.
Pros
Easy Visualization: Clear color cues and area plots simplify momentum analysis.
Highly Customizable: Tailor settings to match your trading style and market conditions.
Signal Alerts: The signal version provides automated notifications for efficient trading.
Noise Reduction: Clamped values prevent extreme oscillations from obscuring signals.
Cons
Lagging Nature: May produce delayed signals as it relies on moving averages.
False Signals: Potential for incorrect signals in volatile or sideways markets.
Parameter Sensitivity: Requires careful adjustment of length and amplitude for optimal performance.
Limited Scope: Does not indicate overbought or oversold conditions inherently.
Tips for Effective Use
Combine with Other Indicators: Enhance reliability by pairing Quantum Wave with trend indicators like RSI or MACD.
Optimize Settings: Experiment with different lengths and amplitudes to suit specific assets and timeframes.
Use the Signal Version: Leverage automated alerts to stay informed of trading opportunities without constant monitoring.
Implement Risk Management: Always use stop-loss orders and other risk management techniques to protect your trades.
Conclusion
Quantum Wave (QWO) is a powerful and customizable oscillator that provides clear insights into market momentum and trading signals. Its dynamic coloring and signal capabilities make it a valuable tool for traders aiming to enhance their market analysis. For those seeking automated alerts, the signal version offers added convenience and efficiency. Incorporate Quantum Wave into your trading strategy to improve decision-making and capitalize on market movements.

Weighted Fourier Transform: Spectral Gating & Main Frequency🙏🏻 This drop has 2 purposes:
1) to inform every1 who'd ever see it that Weighted Fourier Tranform does exist, while being available nowhere online, not even in papers, yet there's nothing incredibly complicated about it, and it can/should be used in certain cases;
2) to show TradingView users how they can use it now in dem endevours, to show em what spectral filtering is, and what can they do with all of it in diy mode.
... so we gonna have 2 sections in the description
Section 1: Weighted Fourier Transform
It's quite easy to include weights in Fourier analysis: you just premultiply each datapoint by its corresponding weight -> feed to direct Fourier Transform, and then divide by weights after inverse Fourier transform. Alternatevely, in direct transform you just multiply contributions of each data point to the real and imaginary parts of the Fourier transform by corresponding weights (in accumulation phase), and in inverse transform you divide by weights instead during the accumulation phase. Everything else stays the same just like in non-weighted version.
If you're from the first target group let's say, you prolly know a thing or deux about how to code & about Fourier Transform, so you can just check lines of code to see the implementation of Weighted Discrete version of Fourier Transform, and port it to to any technology you desire. Pine Script is a developing technology that is incredibly comfortable in use for quant-related tasks and anything involving time series in general. While also using Python for research and C++ for development, every time I can do what I want in Pine Script, I reach for it and never touch matlab, python, R, or anything else.
Weighted version allows you to explicetly include order/time information into the operation, which is essential with every time series, although not widely used in mainstream just as many other obvious and right things. If you think deeply, you'll understand that you can apply a usual non-weighted Fourier to any 2d+ data you can (even if none of these dimensions represent time), because this is a geometric tool in essence. By applying linearly decaying weights inside Fourier transform, you're explicetly saying, "one of these dimensions is Time, and weights represent the order". And obviously you can combine multiple weightings, eg time and another characteristic of each datum, allows you to include another non-spatial dimension in your model.
By doing that, on properly processed (not only stationary but Also centered around zero data), you can get some interesting results that you won't be able to recreate without weights:
^^ A sine wave, centered around zero, period of 16. Gray line made by: DWFT (direct weighted Fourier transform) -> spectral gating -> IWFT (inverse weighted Fourier transform) -> plotting the last value of gated reconstructed data, all applied to expanding window. Look how precisely it follows the original data (the sine wave) with no lag at all. This can't be done by using non-weighted version of Fourier transform.
^^ spectral filtering applied to the whole dataset, calculated on the latest data update
And you should never forget about Fast Fourier Transform, tho it needs recursion...
Section 2: About use cases for quant trading, about this particular implementaion in Pine Script 6 (currently the latest version as of Friday 13, December 2k24).
Given the current state of things, we have certain limits on matrix size on TradingView (and we need big dope matrixes to calculate polynomial regression -> detrend & center our data before Fourier), and recursion is not yet available in Pine Script, so the script works on short datasets only, and requires some time.
A note on detrending. For quality results, Fourier Transform should be applied to not only stationary but also centered around zero data. The rightest way to do detrending of time series
is to fit Cumulative Weighted Moving Polynomial Regression (known as WLSMA in some narrow circles xD) and calculate the deltas between datapoint at time t and this wonderful fit at time t. That's exactly what you see on the main chart of script description: notice the distances between chart and WLSMA, now look lower and see how it matches the distances between zero and purple line in WFT study. Using residuals of one regression fit of the whole dataset makes less sense in time series context, we break some 'time' and order rules in a way, tho not many understand/cares abouit it in mainstream quant industry.
Two ways of using the script:
Spectral Gating aka Spectral filtering. Frequency domain filtering is quite responsive and for a greater computational cost does not introduce a lag the way it works with time-domain filtering. Works this way: direct Fourier transform your data to get frequency & phase info -> compute power spectrum out of it -> zero out all dem freqs that ain't hit your threshold -> inverse Fourier tranform what's left -> repeat at each datapoint plotting the very first value of reconstructed array*. With this you can watch for zero crossings to make appropriate trading decisions.
^^ plot Freq pass to use the script this way, use Level setting to control the intensity of gating. These 3 only available values: -1, 0 and 1, are the general & natural ones.
* if you turn on labels in script's style settings, you see the gray dots perfectly fitting your data. They get recalculated (for the whole dataset) at each update. You call it repainting, this is for analytical & aesthetic purposes. Included for demonstration only.
Finding main/dominant frequency & period. You can use it to set up Length for your other studies, and for analytical purposes simply to understand the periodicity of your data.
^^ plot main frequency/main period to use the script this way. On the screenshot, you can see the script applied to sine wave of period 16, notice how many datapoints it took the algo to figure out the signal's period quite good in expanding window mode
Now what's the next step? You can try applying signal windowing techniques to make it all less data-driven but your ego-driven, make a weighted periodogram or autocorrelogram (check Wiener-Khinchin Theorem ), and maybe whole shiny spectrogram?
... you decide, choice is yours,
The butterfly reflect the doors ...
∞

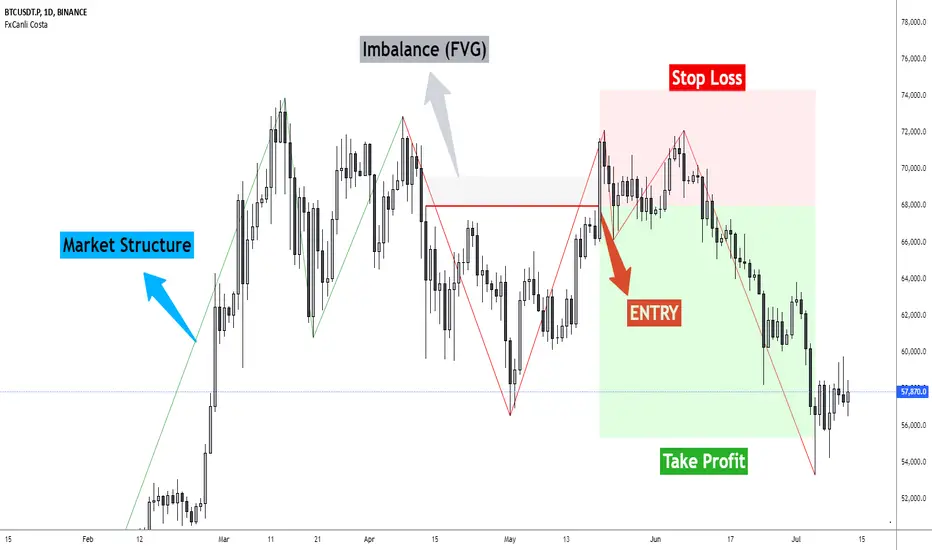
FxCanli CostaFxCanli Costa indicator draws all of the following with FxCanli Costa strategy
▪️ Market Structure
▪️ Up Trend with Green Lines
▪️ Down Trend with Red Lines
▪️ Imbalance(FVG)
▪️ Limit order Level
▪️ Entry Level
▪️ Stop Loss Level
▪️ Take Profit Level
******* Lets first understand about the FxCanli COSTA Strategy *******
Think that, we wait price to reverse from any level -
I call it PRZ (Potential Reversal Zone)
it can reverse in 2 type
Type 1 - it will reverse with 2 wave
Type 2 - it will reverse with 1 wave
⚫ What is PRZ (Potential Reversal Zone)?
Depends on your technical analysis, it can be any Harmonic Pattern level
or it can be Order block at Price action concept.
⚫ What is Imbalance (FVG)?
Fair Value Gaps are price jumps caused by imbalanced buying and selling pressures.
A bullish Fair Value Gap is created when there is a gap between the high of the first candle and the low of the third candle.
A bearish Fair Value Gap is created when there is a gap between the low of the first candle and the high of the third candle.
⚫ FxCanli Costa Strategy is starting now
At my trades, I always wait trend reversal ( Type1 or Type 2 , That I mention above)
for buy trades, I enter the trade below the break out candles
for sell trades, I enter the trade above the break out candles
⚫ Where to put stop loss and take profit?
Stop loss is always above/below swing High/Low
and take profit has to be at least 1/1 Risk/Reward ratio
******* What is FxCanli COSTA Indicator? *******
FxCanli Costa draws all these, depends on FxCanli Costa Strategy
🔴 Market Structure
▪️ Up Trend with Green Lines
▪️ Down Trend with Red Lines
🔴 Trade Levels
FxCanli Costa Indicator first draws Buy Limit level or Sell limit level on the chart
and when Price Reaced to that level it will show Entry / Stop Loss / Take Profit levels
it puts stop loss above/below swing High/Low
and it put Take profit depends on Risk/Reward ratio from inputs.
🔴 FILTERING
FxCanli Costa Indicator's input has got some filtering parts
With these filtering you will not enter all trades
For Example Fibonacci Filtering
it will only give entry signal of impulse's 0.618 and more fibonacci level
🔵 Others Filter are;
RSI Filtering - It will give entry signal, if only RSI is at Overbought or Oversold
EMA Filtering - It will give entry signal with the same direction of Exponential Moving Average
Imbalance Filtering - It will give entry signal, if there is FVG - Imbalance at the entry level
Thanks alot, wish you great trades