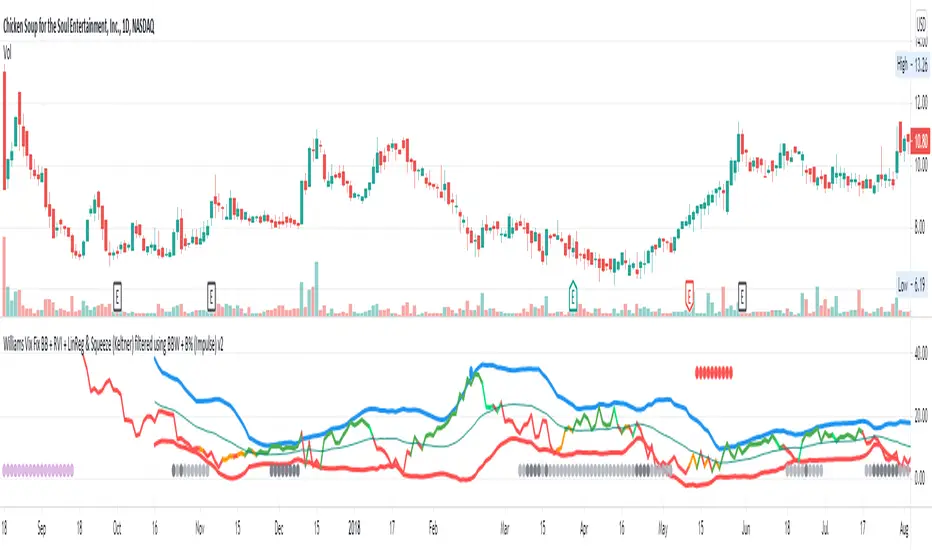
Williams Vix Fix BB + RVI + LinReg & Squeeze (Keltner) BBW + %BLegend:
Entery signal: When line color turns to lime (lighter green) after a blue dot appears
Exit signal: When line color turns to red (darker red) after a red dot appears
Note: it is more affective as an entry signal (Bottom is stronger)
- When line touches or crosses red band it is Top signal (Williams Vix Fix)
- When line touches or crosses blue band it is Bottom signal (Williams Vix Fix)
- Red dot at the top of indicator is a Top signal (Relative Volatility Index)
- Blue dot at the top of indicator is a Bottom signal (Relative Volatility Index)
- Gray dot at the bottom of indicator is a Keltner Squeeze signal (filtered by either BBW or %B)
- Silver dot at the bottom of indicator is a weaker Keltner Squeeze signal (Doesn't meet either BBW or %B filter)
- Purple is a 'Half Squeeze' only 1 Bollinger Band crossed the Keltner Channel
This is an attempt to make use of the main features of all 6 of these Volatility tools:
- Williams Vix Fix + Bollinger Bands
- Relative Volatility Index (RVI)
- Linear Regression (detects Vix Fix starts to rise or fall to a certain degree in order to help validate bottom/top)
Note : There is also added precision on Linear Regression entry by dividing WVF by square roots of basis.
- The crossing of Keltner Channel by the Bollinger Bands (Squeeze)
Conditions to Help Filter Keltner Squeeze:
- When the Bollinger Bands Width (BBW) value is lower than the lowest value within a period plus a margin of error (percentage)
- When the %B value goes up or down by the impulse value (threshold value in setting) detailed in LazyBears indicator. (www.tradingview.com)
If it meets one of these 2 filters and there is a Keltner Channel Squeeze than gray color or else if the squeeze doesn’t meet one of the 2 filters than silver color (weaker Squeeze).
The goal is to find the best tool to find bottoms and top relative to volatility and filter squeeze.
Note: You can also change the threshold for RVI top and bottom.
And this work builds on my last indicators:
- Williams Vix Fix + BB & RVI (Top/Bottom) & Squeeze ()
- Williams Vix Fix BB + RVI & Squeeze (Keltner) filtered BBW + %B ()
If you have ideas on this work or have ideas on potential combinations please message me, I always want to learn or get perspective on how it can be improved.
Sharing is how we get better (Parameter tuning, ideas, discussion)
I don’t reinvent the wheel, just trying to make the wheel better.
在脚本中搜索"williams"
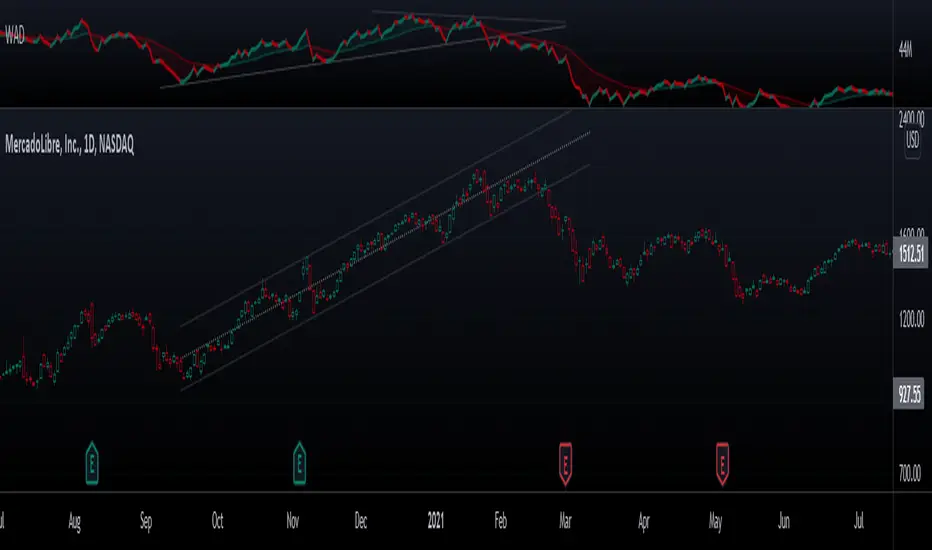
Williams Alligator Spread Oscillator (WASO)Short description (About box)
Williams Alligator Spread Oscillator (WASO) converts Bill Williams’ Alligator into a 0–100 oscillator that measures the average distance between Lips/Teeth/Jaw relative to ATR. High = expansion/trend (default), low = compression/range — making sideways markets easier to spot. Includes adaptive normalization, configurable thresholds, background shading, and alerts.
Full description (Description field)
What it does
The Williams Alligator Spread Oscillator (WASO) transforms Bill Williams’ Alligator into a single, adaptive 0–100 scale. It computes the average pairwise distance among the Alligator lines (Lips/Teeth/Jaw), normalizes it by ATR and a rolling min–max window, and smooths the result. This makes the signal robust across symbols and timeframes and explicitly improves detection of sideways (ranging) conditions by highlighting compression regimes.
Why it helps
Sideways detection made easier: Low WASO marks compressed regimes that commonly align with consolidation/range phases, helping you identify chop and plan breakout strategies.
Trend/expansion clarity: High WASO indicates the Alligator lines are widening relative to volatility, pointing to trending or expanding conditions.
You can flip the direction if you prefer “High = Range.”
How it is calculated (plain English)
Smooth price with RMA (SMMA-like) to get Jaw, Teeth, Lips.
Compute the average pairwise distance between these three lines.
Divide by ATR to remove price-scale effects.
Normalize with a rolling min–max window to map values to 0–100.
Optionally apply EMA smoothing to the oscillator.
Key settings
Jaw/Teeth/Lips Lengths: Alligator periods (SMMA-like via ta.rma).
ATR Length: Volatility benchmark for scaling.
Normalization Lookback: Longer = steadier; shorter = more responsive.
Smoothing (EMA): Evens out noise.
High Value = Large Spread (Trend): Toggle to invert semantics.
Upper/Lower Thresholds: 70/30 are practical starting points.
Signals / interpretation
Sideways / Compression (easier to spot):
Default direction: WASO below Lower Threshold (e.g., <30).
With inverted direction OFF: WASO above Upper Threshold (e.g., >70).
Trend / Expansion:
Default direction: WASO above Upper Threshold (e.g., >70).
With inverted direction OFF: WASO below Lower Threshold (e.g., <30).
Midline (50): Neutral zone; flips around 50 can hint at regime shifts.
Alerts included
Range Start (sideways/compression)
Trend Start (expansion/trend)
Notes & limitations
This implementation omits the classic forward shift of Alligator lines to keep signals usable on live bars.
If market behavior shifts (very quiet or very volatile), tune Lookback and ATR Length.
Combine WASO with breakout levels or momentum filters for entries/exits.
Credits & disclaimer
Inspired by Bill Williams’ Alligator.
For educational purposes only. Not financial advice.
Release Notes (v1.0):
Initial release of Williams-Alligator Spread Oscillator (WASO) with ATR-based scaling and adaptive 0–100 normalization.
Direction toggle (High = Trend by default), adjustable thresholds, background shading, and two alert conditions.

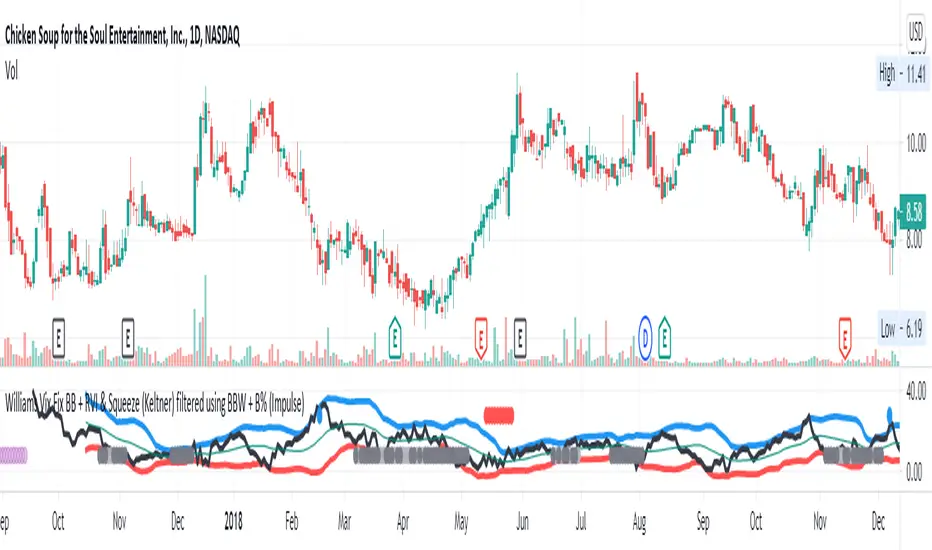
Williams Vix Fix BB + RVI & Squeeze (Keltner) filtered BBW + %BLegend:
- When line touches or crosses red band it is Top signal (Williams Vix Fix)
- When line touches or crosses blue band it is Bottom signal (Williams Vix Fix)
- Red dot at the top of indicator is a Top signal (Relative Volatility Index)
- Blue dot at the top of indicator is a Bottom signal (Relative Volatility Index)
- Gray dot at the bottom of indicator is a Keltner Squeeze signal (filtered by either BBW or %B)
- Silver dot at the bottom of indicator is a weaker Keltner Squeeze signal (Doesn't meet either BBW or %B filter)
- Purple is a 'Half Squeeze' only 1 Bollinger Band crossed the Keltner Channel
This is an attempt to make use of the main features of all 6 of these Volatility tools :
- Williams Vix Fix + Bollinger Bands
- Relative Volatility Index (RVI)
- The crossing of Keltner Channel by the Bollinger Bands (Squeeze)
Conditions to Help Filter Keltner Squeeze:
- When the Bollinger Bands Width (BBW) value is lower than the lowest value within a period plus a margin of error (percentage)
- When the %B value reaches the alert level detailed in LazyBears indicator. ()
If it meets one of these 2 filters and there is a Keltner Channel Squeeze than gray color or else if the squeeze doesn’t meet one of the 2 filters than silver color (weaker Squeeze).
The goal is to find the best tool to find bottoms and top relative to volatility and filter the squeeze.
The idea is that both Williams Vix Fix + Bollinger Bands and Relative Volatility Index both already give the main volatility bottom and top so combining them to compare and validate the signals makes sense. (Note: Bottom signal is more accurate than top). In addition, I added the squeeze to show the potential breakout pressure and to compliment bottom and top signals.
For ideas on how to continue this work :
I encourage ideas to combine the Williams Vix Fix and Relative Volatility Index for volatility top and bottom (with probability would be awesome)
And I encourage ideas to filter Keltner Channel Volatility Squeeze using both the BBW or %B or other volatility squeeze indicators or a combination of all of them.
Also, I encourage people to post their top parameters for the BBW and %B to filter the Keltner Squeeze in the comments or to send me them by chat relative to this indicator.
Half the battle is making the indicator, while the other half is tuning the parameters.
The current parameters are one of the least aggressive, and act as a mild filter.
Note: You can also change the threshold for RVI top and bottom.
And this work builds on my last indicator:
If you have ideas on this work or have ideas on potential combinations please message me, I always want to learn or get perspective on how it can be improved.
Sharing is how we get better (Parameter tuning, ideas, discussion)
I don’t reinvent the wheel, just trying to make the wheel better.
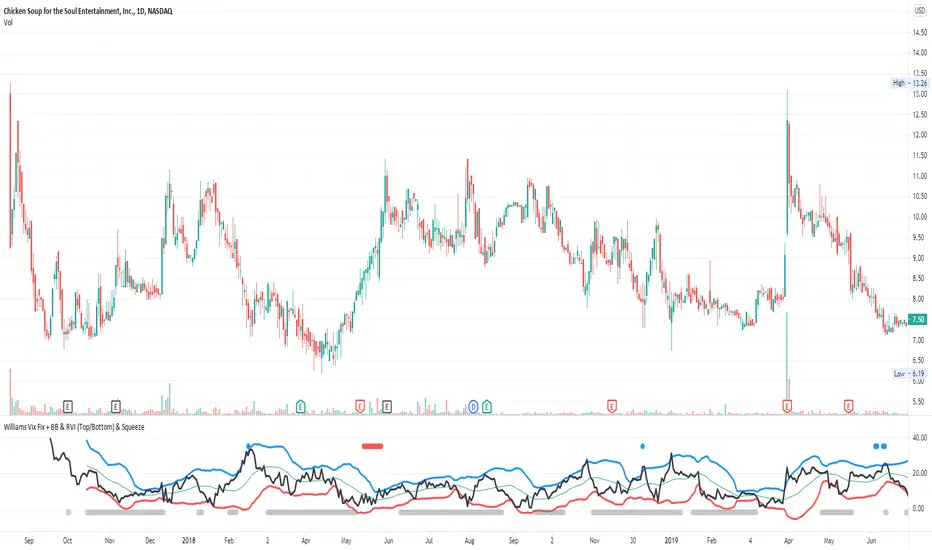
Williams Vix Fix + BB & RVI (Top/Bottom) & SqueezeLegend :
- When line touches or crosses red band it is Top signal (Williams Vix Fix)
- When line touches or crosses blue band it is Bottom signal (Williams Vix Fix)
- Red dot at the top of indicator is a Top signal (Relative Volatility Index)
- Blue dot at the top of indicator is a Bottom signal (Relative Volatility Index)
- Gray dot at the bottom of indicator is a Squeeze signal
This is an attempt to make use of the main features of all 4 of these very popular Volatility tools :
- Williams Vix Fix + Bollinger Bands (as per Larry Williams idea, link )
- Relative Volatility Index (RVI)
- The crossing of Keltner Channel by the Bollinger Bands (Squeeze)
The goal is to find the best tool to find bottoms and top relative to volatility . This is a simple combination, but I find it very useful personally
(no need to reinvent the wheel, just need to find what works best)
The idea is that Williams Vix Fix + Bollinger Bands already give the main volatility bottom and top (Bottom are more accurate).
So instead of trying to modify it, I chose to compliment it by mapping with points when the Relative Volatility Index (RVI) reached the
top/bottom thresholds (red dot means top and blue dot means bottom). That way we can easily see when both indicators find a top or bottom relative
to volatility (of course this needs to be then confirmed with a momentum indicator rally).
In addition, I added the squeeze because this quickly shows the potential breakouts.
For ideas on how to continue this work, it would be very interesting to be able to create a probability of a bottom and top relative to volatility using the
Williams Vix Fix + Bollinger Bands and "Relative Volatility Index" signals as both work well and give top or bottom the other doesn't see.
Williams %R IndicatorDeveloped by Larry Williams, Williams %R is a momentum indicator much like the Stochastic Oscillator and is especially popular
for measuring overbought and oversold levels. The scale ranges from 0 to -100 with readings from 0 to -20 considered overbought,
and readings from -80 to -100 considered oversold. Typically, Williams %R is calculated using 14 periods and can be used on intraday,
daily, weekly or monthly data.
This implementation is enhanced with CCI in the form of background colors as a confirming signal and an indication of a prevailing trend.

Williams FractalsBoaBias Fractals High & Lows is an indicator based on Bill Williams' fractals that helps identify key support and resistance levels on the chart. It displays horizontal lines at fractal highs (red) and lows (green), which extend to the current bar. Lines automatically disappear if the price breaks through them, leaving only the relevant levels. Additionally, the indicator shows the price values of active fractals on the price scale for convenient monitoring.
Key Features:
Customizable Fractals: Choose between 3-bar or 5-bar fractals (default: 3-bar).
Period: Adjust the number of periods for calculation
Visualization: Red lines for highs (resistance), green for lows (support). Lines are fixed on the chart and persist during scrolling or scaling changes.
Alert System: Notifications for the formation of a new fractal high/low and for level breaks (Fractal High Formed, Fractal Low Formed, Fractal High Broken, Fractal Low Broken).
How to Use:
Add the indicator to the chart.
Configure parameters: select the fractal type (3 or 5 bars) and period.
Set up alerts in TradingView to receive notifications about new fractals or breaks.
Use the lines as levels for entry/exit positions, stop-losses, or take-profits in fractal-based strategies.
Troubleshooting: If Levels Are Not Fixed on the Chart
If the levels (fractal lines) do not stay fixed on the chart and fail to move with it during scrolling or scaling (e.g., they remain stationary while the chart shifts), this is typically due to the indicator's scale settings in TradingView. The indicator may be set to "No scale," causing the lines to desynchronize from the chart's price scale.
What to Do:
Locate the Indicator Label: On the chart, find the indicator label in the top-left corner of the pane (or where "BoaBias Fractals High & Lows" is displayed).
Right-Click the Label: Click the right mouse button on this label.
Adjust the Scale:
In the context menu, look for the "Scale" or "Pin to scale" option.
If it shows "Pin to scale (now no scale)" or similar, select "Pin to right scale" (or "Pin to left scale," depending on your chart's main price scale—usually the right).
Refresh the Chart: After changing the setting, refresh the chart (press F5 or reload the page), or toggle the indicator off and on again to apply the changes.
After this, the lines should move and scale with the chart during scrolling (horizontal or vertical) or zooming. If the issue persists, check:
TradingView Limits: The indicator may draw too many lines (maximum ~500 per script). If there are many historical fractals, older lines might not display.
Chart Settings: Ensure the chart is not in logarithmic scale (if applicable) or that auto-scaling is enabled.
Indicator Version: Verify you are using the latest script version (Pine Script v6) and check for errors in the TradingView console.
This indicator is ideal for traders working with Bill Williams' chaos theory or those seeking dynamic support/resistance levels. It is based on standard fractals but with enhancements for convenience: automatic removal of broken levels and integration with the price scale.
Note: The indicator does not provide trading signals on its own — use it in combination with other tools. Test on historical data before real trading.
Code written in Pine Script v6. Original template: Mit Nayi.

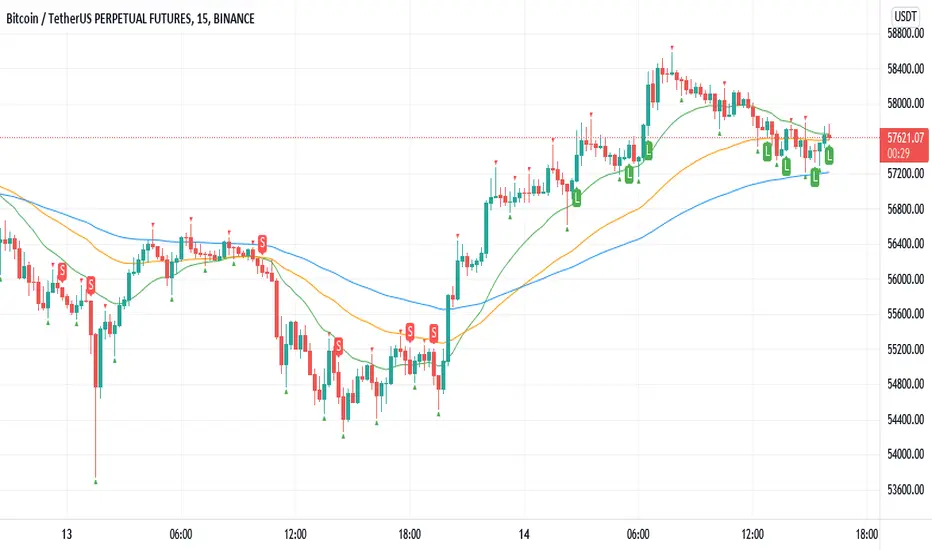
Williams Fractals BUY/SELL signals indicatorThis indicator made with using Williams Fractals, 20 50 100 Moving Averages and Relative Strength Index. You can easily find entry points by using Long (L), Short (S) signals.
This is a 15min scalping strategy for BTC:USDT Perpetual pair. For use different pairs or TFs you may need to change settings.
How to use
****************
When flashing Long (L) or Short (S) signal you should wait until the candle closing for the confirmation.
After that candle closed with the signal, you can enter a trade in next candle opening.
Your SL should be 3.1% from etnry and TP should be 0.5% from entry for best results. (You can use Long Position / Short Position tool in Prediction and Measurement Tools in drawing pannel to calculate this. This settings only for BTC:USDT Perp 15 min TF. For other TFs or Pairs settings may vary. You can easily change these settings and backtest your own.)
After entering a trade you can be ignored next signals until close the trade.
To learn more about this strategy, please try the "Williams Fractals Strategy" I coded. Thank you!
Williams Vix Fix Bottoms and TopsThis indicator uses the very popular Williams Vix Fix for Bottoms by Chris Moody but not only does it search for bottoms, it can also be switch to work for tops for those who look to short the market. I've also added in a few options like flipping the indicator, color adjustments on the settings page, as well as cut a few of the options I feel did not need to be in which cluttered the screen when the settings were opened. In his later revisions of the Williams Vix Fix, CM took out the functions which draw the high/low ranges as well as the standard deviation which is what this indicator uses to show entry points. I have added options back on to draw these, I think it's useful. To be honest, I have not messed around with the number settings much so I am not sure how adjusting the look back range or going for smaller / bigger percentage changes would change how well the indicator works. It seems to work very well at its default settings.
With the Bollinger Band deviation, you have to remember that it looks back at the set amount of candles (20 by default) and uses those for the standard deviation: 1 dev = 68%, 2 dev = 95%, 3 dev = 99.7%
These percentages mean that at 2 dev, 95% of the last 20 candles will remain within the boundaries of the Bollinger Bands. Three tends to be too high, one is usually too low. Two is pretty good.
The lowest percentile option probably won't change much other than bring up the bottom line which doesn't effect the alerts or signals, just something to observe.
The highest percentile option makes a difference similar to the stand deviation and Bollinger Band. The higher you put it, the less likely it will get triggered but the more reliant it of a signal it should be.
As always, I have left notes throughout the code and I did leave in the code that was original but commented it out as I don't believe it's worth having.
I like to have the high/lows drawn, as well as the standard deviation. Then I find that the filtered entries are most accurate signals to follow. Simple entry is hit or miss, Aggressive entry is always early but sometimes that's not a great thing.
Williams Accumulation/Distribution (Williams AD) Backtest Accumulation is a term used to describe a market controlled by buyers;
whereas distribution is defined by a market controlled by sellers.
Williams recommends trading this indicator based on divergences:
Distribution of the security is indicated when the security is making
a new high and the A/D indicator is failing to make a new high. Sell.
Accumulation of the security is indicated when the security is making
a new low and the A/D indicator is failing to make a new low. Buy.
You can change long to short in the Input Settings
WARNING:
- For purpose educate only
- This script to change bars colors.

Williams Accumulation/Distribution (Williams AD) Strategy Accumulation is a term used to describe a market controlled by buyers;
whereas distribution is defined by a market controlled by sellers.
Williams recommends trading this indicator based on divergences:
Distribution of the security is indicated when the security is making
a new high and the A/D indicator is failing to make a new high. Sell.
Accumulation of the security is indicated when the security is making
a new low and the A/D indicator is failing to make a new low. Buy.
WARNING:
- This script to change bars colors.

Williams Fractals StrategyThis indicator made with using Williams Fractals, 20 50 100 Moving Averages and Relative Strength Index. You can easily find entry points by using Long (L), Short (S) signals.
Note : Settings are optimized for BTC:USDT Perpetual 15min TF. For use different pairs or TFs you may need to change settings.

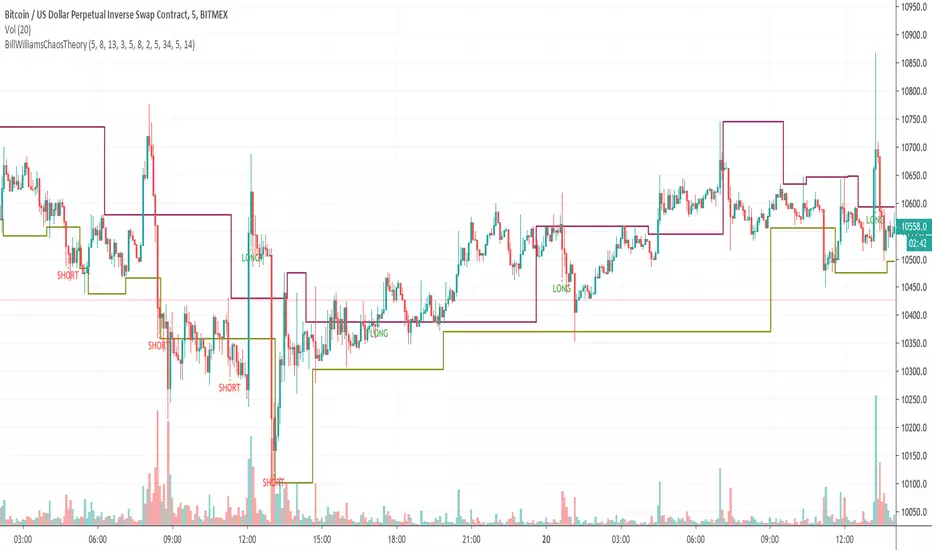
Bill Williams Chaos TheoryBill Williams Chaos Theory
- Alligator
- Fractals
- Accelerator Decelerator Oscillator
- Market Facilitation Index
Combining all of that to generate signal long or short.
Long entry when long signal appears.
Short entry when short signal appears.
For donations
BTC: 3E7rUPX7upS8iTj42JdLt7keJVbJLfvMoH
ETH: 0x094ed88e4c5a9b225e936586cbc2d61f4a027f68
Thank you & happy trading!
Larry Williams - Smash Day (SL/TP in %)This strategy implements Larry Williams’ “Smash Day” reversal concept on any symbol and timeframe (daily is the classic). A Smash Day is a bar that closes beyond a recent extreme and then potentially reverses on the next session.

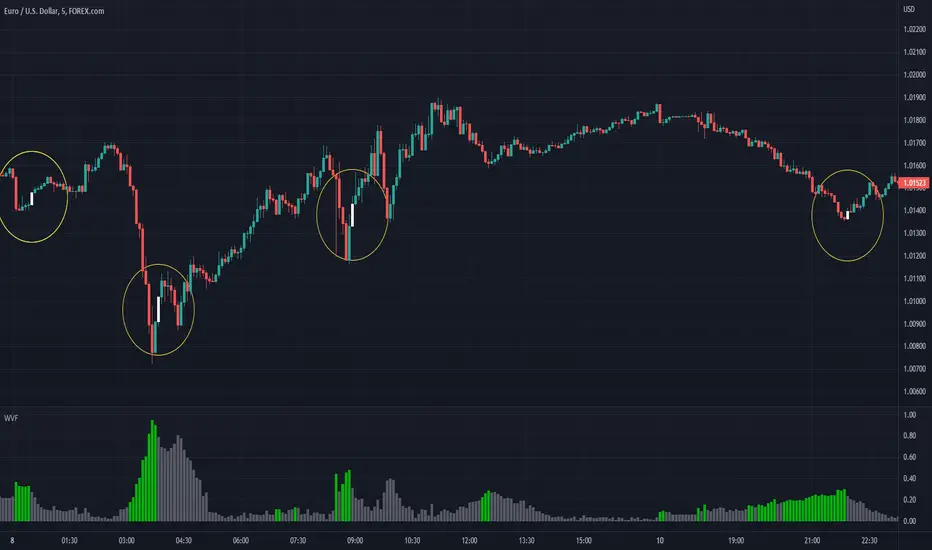
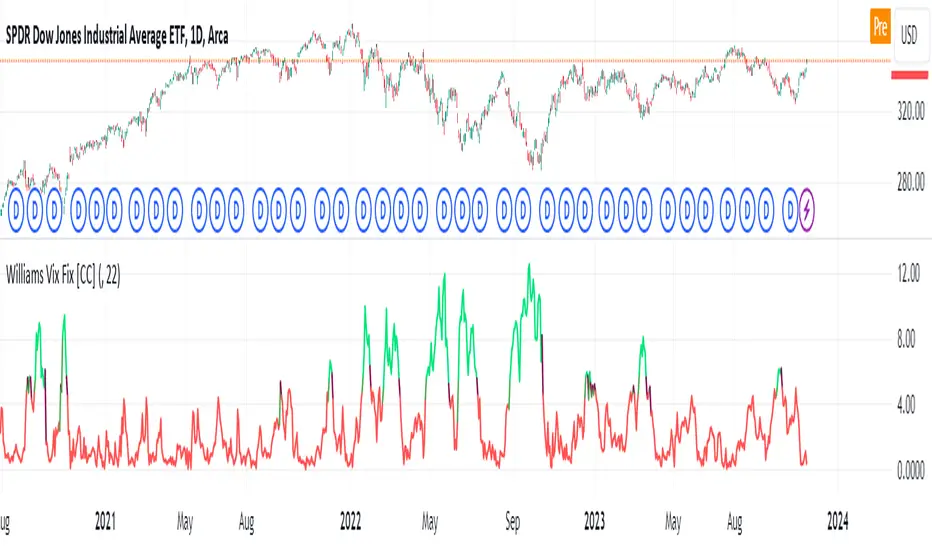
Williams Vix Fix [CC]The Vix Fix indicator was created by Larry Williams and is one of my giant backlog of unpublished scripts which I'm going to start publishing more of. This indicator is a great synthetic version of the classic Volatility Index and can be useful in combination with other indicators to determine when to enter or exit a trade due to the current volatility. The indicator creates this synthetic version of the Volatility Index by a fairly simple formula that subtracts the current low from the highest close over the last 22 days and then divides that result by the same highest close and multiplies by 100 to turn it into a percentage. The 22-day length is used by default since there is a max of 22 trading days in a month but this formula works well for any other timeframe. By itself, this indicator doesn't generate buy or sell signals but generally speaking, you will want to enter or exit a trade when the Vix fix indicator amount spikes and you get an entry or exit signal from another indicator of your choice. Keep in mind that the colors I'm using for this indicator are only a general idea of when volatility is high enough to enter or exit a trade so green colors mean higher volatility and red colors mean low volatility. This is one of the few indicators I have written that don't recommend to buy or sell when the colors change.
This was a custom request from one of my followers so please let me know if you guys have any other script requests you want to see!
Williams Accumulation/DistributionThis is an indicator described by Larry Williams in one of his books. Larry won the 1987 World Cup Championship of Futures Trading, where he turned $10,000 to over $1,100,000 in a 12-month competition with real money.
Larry used this indicator to track divergences between price action and volume, which he called patterns of accumulation (bullish divergence) and distribution(bearish divergence). Its logic is similar to On Balance Volume(OBV), where it accumulates up and down volume in a single line, but also takes into account the size of the candle in its calculation, by taking the difference between the open and close, and the high and the low.
Enjoy!
Williams Vix Fix paired with Supertrend HeatmapThis script shows my mod of the powerful Williams' Vix Fix indicator paired with a modified Supertrend Heatmap, originally created by Daveatt.

Williams Vix Fix + Inverse [Alorse]The VIX Fix measures how close the current market price is to the lowest price of the last X candles. When prices are in uptrends, the close is usually near the high. But prices close near the low in downtrends.
It works because it’s based on how traders behave. The calculation fixes some of the problems with the VIX.
This indicator is based on CM_Williams_Vix_Fix Finds Market Bottoms and its great difference is that it adds the inverse functionality, also showing the possible highest areas of the market.

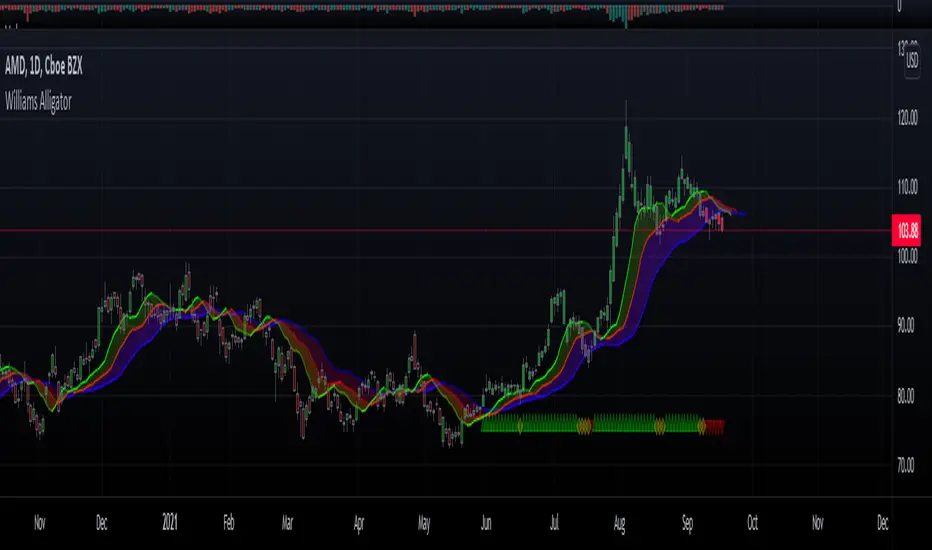
Williams Alligator [DM]Greetings colleagues
I share here the classic Williams Alligator
Options added to the standard indicator:
You can choose between Alligator and Alma
Gradient colors for the plots
Gradient fill colors between plots
Visual alerts
Alerts in TradingView
Enjoy”
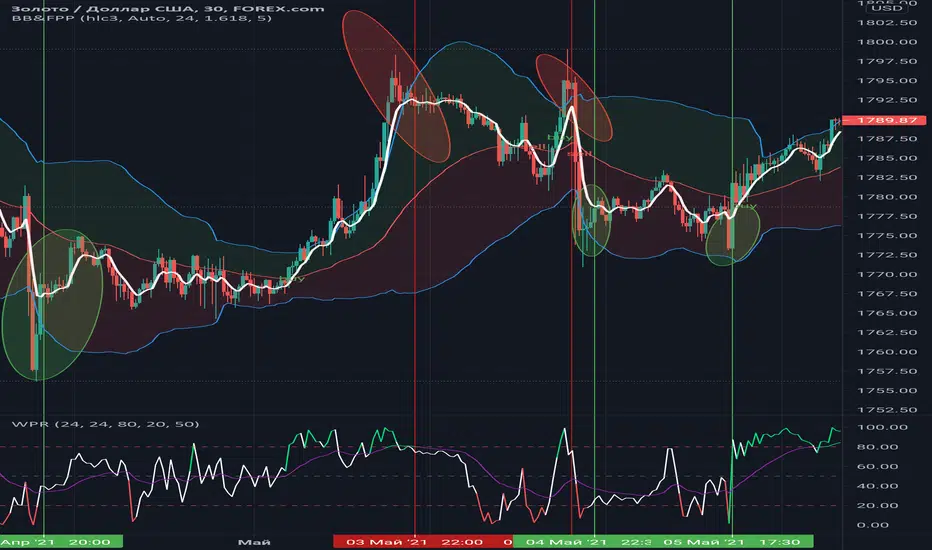
Williams %RHi! WPR is the Williams percentage range indicator in my design. The main idea is that the intersection of the indicator and the moving average in the overbought and oversold zones + color highlighting gives more clear visual signals for making trading decisions based on this indicator.
Williams_proGOWilliams ProGo & %R
indicatori di Williams da usare per identificare il momentum di operativita' con l'incrocio dei buoi con mani forti e per l'entrata il %R settato a 4 periodi che indica la barra di operatività
BUON TRADING A TUTTI !!

Williams Fractals, A simpler scriptA simpler script to filter fractals and support large range parameter.

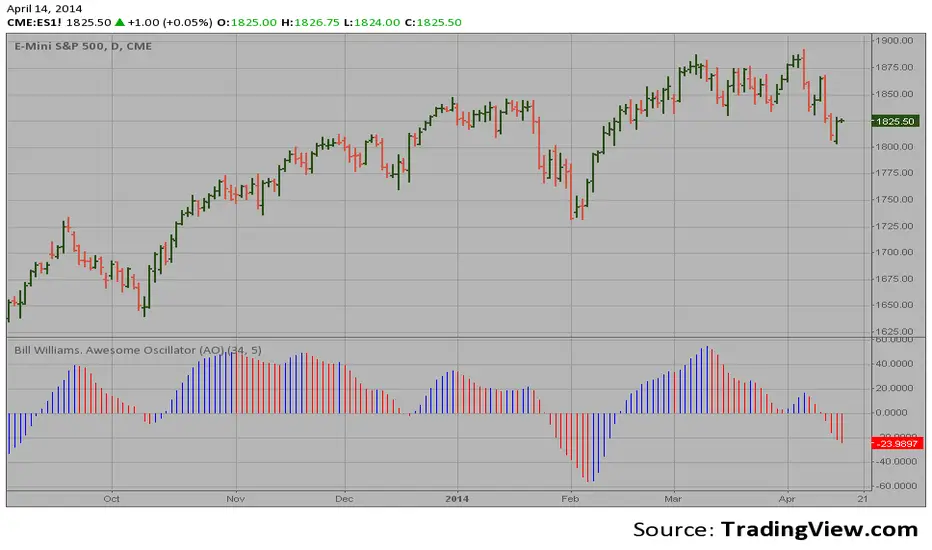
Bill Williams. Awesome Oscillator (AO) Hi
Let me introduce my Bill Williams. Awesome Oscillator (AO) script.
This indicator is based on Bill Williams` recommendations from his book
"New Trading Dimensions". We recommend this book to you as most useful reading.
The wisdom, technical expertise, and skillful teaching style of Williams make
it a truly revolutionary-level source. A must-have new book for stock and
commodity traders.
The 1st 2 chapters are somewhat of ramble where the author describes the
"metaphysics" of trading. Still some good ideas are offered. The book references
chaos theory, and leaves it up to the reader to believe whether "supercomputers"
were used in formulating the various trading methods (the author wants to come across
as an applied mathemetician, but he sure looks like a stock trader). There isn't any
obvious connection with Chaos Theory - despite of the weak link between the title and
content, the trading methodologies do work. Most readers think the author's systems to
be a perfect filter and trigger for a short term trading system. He states a goal of
10%/month, but when these filters & axioms are correctly combined with a good momentum
system, much more is a probable result.
There's better written & more informative books out there for less money, but this author
does have the "Holy Grail" of stock trading. A set of filters, axioms, and methods which are
the "missing link" for any trading system which is based upon conventional indicators.
This indicator plots the oscillator as a histogram where periods fit for buying are marked
as blue, and periods fit for selling as red. If the current value of AC (Awesome Oscillator)
is over the previous, the period is deemed fit for buying and the indicator is marked blue.
If the AC values is not over the previous, the period is deemed fir for selling and the indicator
is marked red.
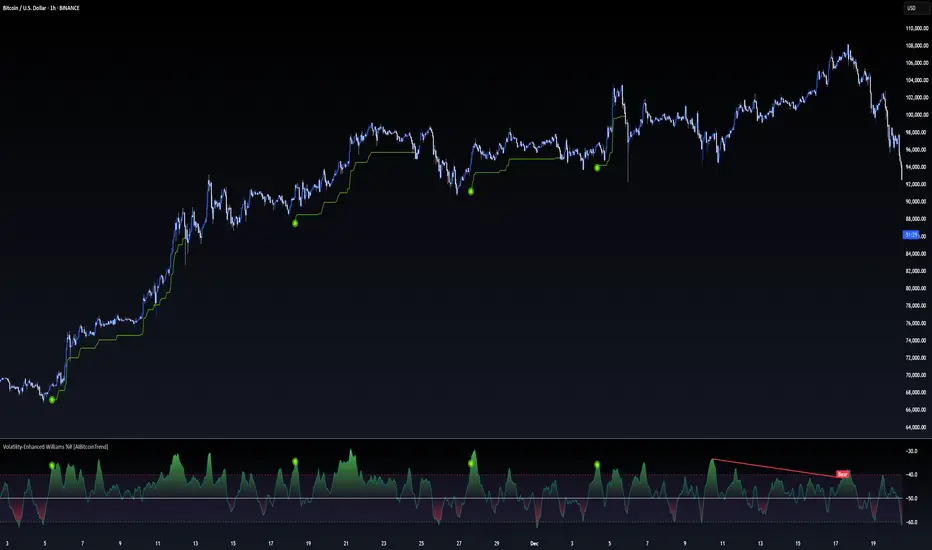
Volatility-Enhanced Williams %R [AIBitcoinTrend]👽 Volatility-Enhanced Williams %R (AIBitcoinTrend)
The Volatility-Enhanced Williams %R takes the classic Williams %R oscillator to the next level by incorporating volatility-adaptive smoothing, making it significantly more responsive to market dynamics. Unlike the traditional version, which uses a fixed calculation method, this indicator dynamically adjusts its smoothing factor based on market volatility, helping traders capture trends more effectively while filtering out noise.
Additionally, the indicator includes real-time divergence detection and an ATR-based trailing stop system, providing traders with enhanced risk management tools and early reversal signals.
👽 What Makes the Volatility-Enhanced Williams %R Unique?
Unlike the standard Williams %R, which applies a simple lookback-based formula, this version integrates adaptive smoothing and volatility-based filtering to refine its signals and reduce false breakouts.
✅ Volatility-Adaptive Smoothing – Adjusts dynamically based on standard deviation, enhancing signal accuracy.
✅ Real-Time Divergence Detection – Identifies bullish and bearish divergences for early trend reversal signals.
✅ Crossovers & Trailing Stops – Implements Williams %R crossovers with ATR-based trailing stops for intelligent trade management.
👽 The Math Behind the Indicator
👾 Volatility-Adaptive Smoothing
The indicator smooths the Williams %R calculation by applying an adaptive filtering mechanism, which adjusts its responsiveness based on market conditions. This helps to eliminate whipsaws and makes trend-following strategies more reliable.
The smoothing function is defined as:
clamp(x, lo, hi) => math.min(math.max(x, lo), hi)
adaptive(src, prev, len, divisor, minAlpha, maxAlpha) =>
vol = ta.stdev(src, len)
alpha = clamp(vol / divisor, minAlpha, maxAlpha)
prev + alpha * (src - prev)
Where:
Volatility Factor (vol) measures price dispersion using standard deviation.
Adaptive Alpha (alpha) dynamically adjusts smoothing strength.
Clamped Output ensures that the smoothing factor remains within a stable range.
👽 How Traders Can Use This Indicator
👾 Divergence Trading Strategy
Bullish Divergence Setup:
Price makes a lower low, while Williams %R forms a higher low.
Buy signal is confirmed when Williams %R reverses upward.
Bearish Divergence Setup:
Price makes a higher high, while Williams %R forms a lower high.
Sell signal is confirmed when Williams %R reverses downward.
👾 Trailing Stop & Signal-Based Trading
Bullish Setup:
✅ Williams %R crosses above trigger level → Buy signal.
✅ A bullish trailing stop is placed at Low - (ATR × Multiplier).
✅ Exit if price crosses below the stop.
Bearish Setup:
✅ Williams %R crosses below trigger level → Sell signal.
✅ A bearish trailing stop is placed at High + (ATR × Multiplier).
✅ Exit if price crosses above the stop.
👽 Why It’s Useful for Traders
Adaptive Filtering Mechanism – Avoids excessive noise while maintaining responsiveness.
Real-Time Divergence Alerts – Helps traders anticipate market reversals before they occur.
ATR-Based Risk Management – Stops dynamically adjust based on market volatility.
Multi-Market Compatibility – Works effectively across stocks, forex, crypto, and futures.
👽 Indicator Settings
Smoothing Factor – Controls how aggressively the indicator adapts to volatility.
Enable Divergence Analysis – Activates real-time divergence detection.
Lookback Period – Defines the number of bars for detecting pivot points.
Enable Crosses Signals – Turns on Williams %R crossover-based trade signals.
ATR Multiplier – Adjusts trailing stop sensitivity.
Disclaimer: This indicator is designed for educational purposes and does not constitute financial advice. Please consult a qualified financial advisor before making investment decisions.