Butterfly Harmonic Pattern [TradingFinder] Harmonic Detector🔵 Introduction
The Butterfly Harmonic Pattern is a sophisticated and highly regarded tool in technical analysis, utilized by traders to identify potential reversal points in the financial markets. This pattern is distinguished by its reliance on Fibonacci ratios and geometric configurations, which aid in predicting price movements with remarkable precision.
The origin of the Butterfly Harmonic Pattern can be traced back to the pioneering work of Bryce Gilmore, who is credited with discovering this pattern. Gilmore's extensive research and expertise in Fibonacci ratios laid the groundwork for the identification and application of this pattern in technical analysis.
The Butterfly pattern, like other harmonic patterns, is based on the principle that market movements are not random but follow specific structures and ratios.
The pattern is characterized by a distinct "M" shape in bullish scenarios and a "W" shape in bearish scenarios, each indicating a potential reversal point. These formations are identified by specific Fibonacci retracement and extension levels, making the Butterfly pattern a powerful tool for traders seeking to capitalize on market turning points.
The precise nature of the Butterfly pattern allows for the accurate prediction of target prices and the establishment of strategic entry and exit points, making it an indispensable component of a trader's analytical arsenal.
Bullish :
Bearish :
🔵 How to Use
Like other harmonic patterns, the Butterfly pattern is categorized based on how it forms at the end of an uptrend or downtrend. Unlike the Gartley and Bat patterns, the Butterfly pattern, similar to the Crab pattern, forms outside the wave 3 range at the end of a rally.
🟣 Types of Butterfly Harmonic Patterns
🟣 Bullish Butterfly Pattern
This pattern forms at the end of a downtrend and leads to a trend reversal from a downtrend to an uptrend.
🟣 Bearish Butterfly Pattern
In contrast to the Bullish Butterfly pattern, this pattern forms at the end of an uptrend and warns analysts of a trend reversal to a downtrend. In this case, traders are encouraged to shift their trading stance from buy trades to sell trades.
Advantages and Limitations of the Butterfly Pattern in Technical Analysis :
The Butterfly pattern is considered one of the precise and stable tools in financial market analysis. However, it is always important to pay special attention to the advantages and limitations of each pattern.
Here, we review the advantages and disadvantages of using the Butterfly harmonic pattern :
The main advantage of the Butterfly pattern is providing very accurate signals.
Using Fibonacci golden ratios and geometric rules, the Butterfly pattern identifies patterns accurately and systematically. (This high accuracy significantly helps investors in making trading decisions.)
Identifying this pattern requires expertise and experience in technical analysis.
Recognizing the Butterfly pattern might be complex for beginner traders. (Correct identification of the pattern necessitates mastery over geometric principles and Fibonacci ratios.)
The Butterfly harmonic pattern might issue false trading signals. (Traders usually combine the Butterfly pattern with other technical tools to confirm buy and sell signals.)
🔵 Setting
🟣 Logical Setting
ZigZag Pivot Period : You can adjust the period so that the harmonic patterns are adjusted according to the pivot period you want. This factor is the most important parameter in pattern recognition.
Show Valid Forma t: If this parameter is on "On" mode, only patterns will be displayed that they have exact format and no noise can be seen in them. If "Off" is, the patterns displayed that maybe are noisy and do not exactly correspond to the original pattern.
Show Formation Last Pivot Confirm : if Turned on, you can see this ability of patterns when their last pivot is formed. If this feature is off, it will see the patterns as soon as they are formed. The advantage of this option being clear is less formation of fielded patterns, and it is accompanied by the latest pattern seeing and a sharp reduction in reward to risk.
Period of Formation Last Pivot : Using this parameter you can determine that the last pivot is based on Pivot period.
🟣 Genaral Setting
Show : Enter "On" to display the template and "Off" to not display the template.
Color : Enter the desired color to draw the pattern in this parameter.
LineWidth : You can enter the number 1 or numbers higher than one to adjust the thickness of the drawing lines. This number must be an integer and increases with increasing thickness.
LabelSize : You can adjust the size of the labels by using the "size.auto", "size.tiny", "size.smal", "size.normal", "size.large" or "size.huge" entries.
🟣 Alert Setting
Alert : On / Off
Message Frequency : This string parameter defines the announcement frequency. Choices include: "All" (activates the alert every time the function is called), "Once Per Bar" (activates the alert only on the first call within the bar), and "Once Per Bar Close" (the alert is activated only by a call at the last script execution of the real-time bar upon closing). The default setting is "Once per Bar".
Show Alert Time by Time Zone : The date, hour, and minute you receive in alert messages can be based on any time zone you choose. For example, if you want New York time, you should enter "UTC-4". This input is set to the time zone "UTC" by default.
在脚本中搜索"zigzag"

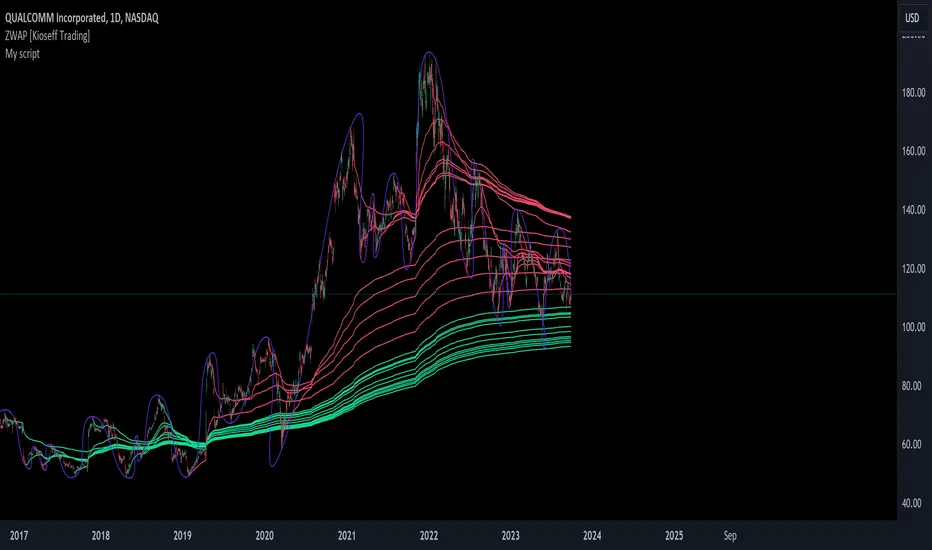
ZWAP (ZigZag Anchored VWAP) [Kioseff Trading]Hello!
Quick script showcasing the new polyline function for Pine Script!
Features
Up to 100 high/low pivot points auto anchored VWAP
Visible range auto anchored VWAP
Curved ZigZag (Adjustable!)
With the new polyline function, auto-anchored VWAP at specific price points is more viable.
When using line.new() only 500 lines can exist on the chart concurrently and, since VWAP is calculated on every update, a "proper" VWAP drawn using line.new() can extend 500 bars at most, to which no additional VWAP lines can be drawn after.
Of course, when using the plot() function a VWAP line will draw on every bar; however, this method isn't highly compatible with auto-anchoring VWAP lines.
However!
A polyline, from beginning to end irrespective of the number of coordinates used, constitutes 1 polyline; 100 can exist simultaneously with 10,000 xy coordinates per line.
The image above shows an attempt to draw the same auto-anchored VWAP lines using the line.new() function. Not an ideal outcome!
The image above shows the same attempt using the polyline.new() function!
Very nice (:
The image above shows the indicator auto anchoring to zig zag turning points.
Subsequent to a new anchoring, VWAP is calculated for the following bars - up to the current bar.
Thank you for checking this out; if you have any ideas to spice it up feel free to comment!
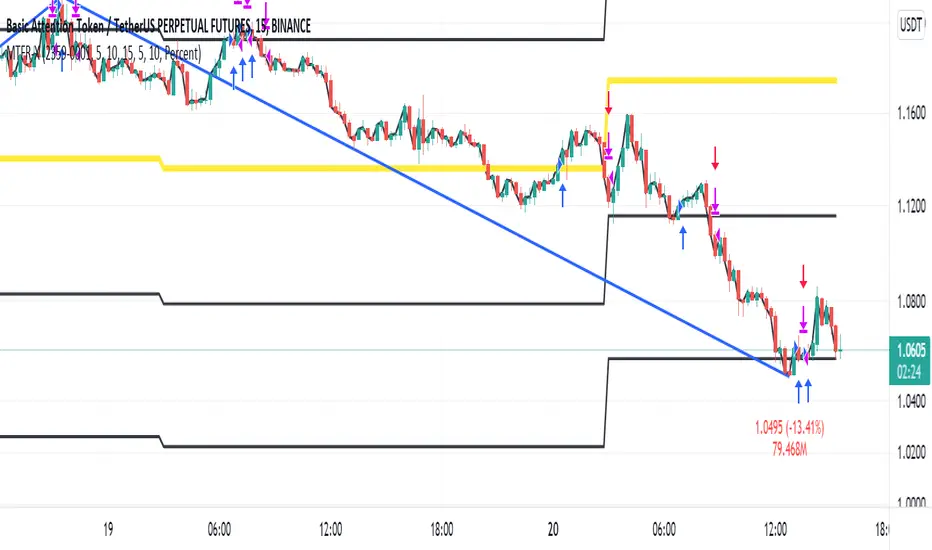
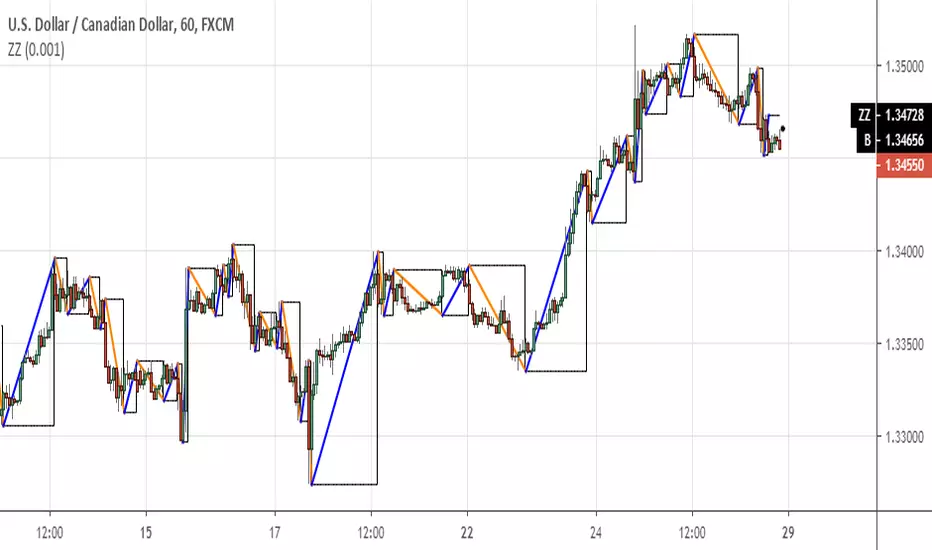
Intraday Grid trading exampleHello everyone,
This was a grid trading example for intraday trading.
Please be advised that every commodity have diferent kind of reaction and rate of change between periods therefore the percentages need to be adjusted acording to the commodities change %.
In order to specify the adjustment rate we add the Zig Zag in the script.
For Example ;
Last 3 days zigzag high points are %25 , %13 and %8 , the average %is about %9 therefore you have to put the adjustment ratios something like;
Z%1 = %3
Z%2 = %6
Z%3 = %9
Feel free to use the script with caution( it was not a investment advice), this was only a example of grid trading strategy on our trading platform.
Regards.
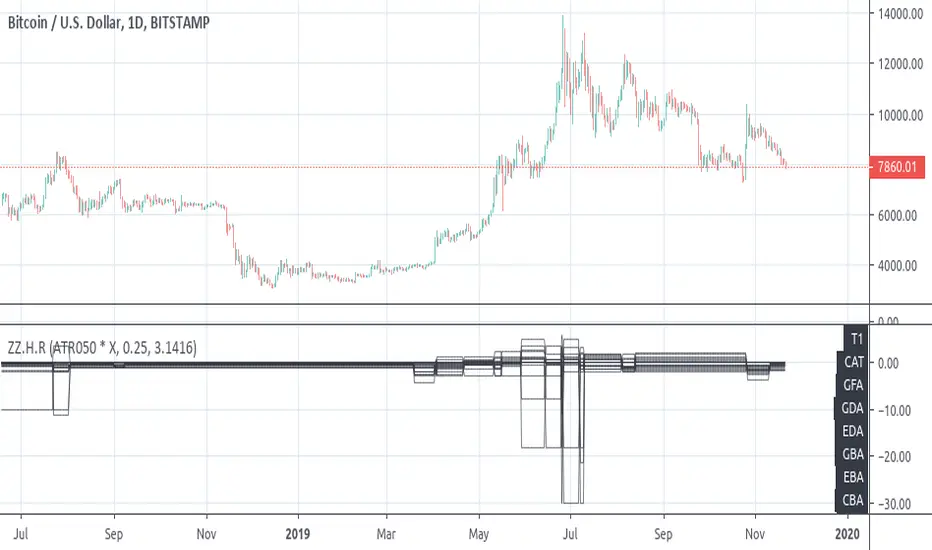
Jeges JigsThis is a combination of all my old indicators, with an added feature for trend lines (inspiration for this came from Wedge Maker script thanks to veryfid, I hope he doesn't mind).
This script looks for a period with increased volatility , as measured by ATR ( Average True Range ), then it looks for a high or a low in that area.
When price is above EMA (400 is default, can be changed), it looks for the highs and adds multiples of ATR to the high. Default values for multipliers are 3,9 and 27, meaning that the script will show 3xATR level above the high, 9xATR above the high and 27xATR above the high.
When price is below EMA it looks for the lows and subtracts multiples of ATR from the low.The script will show 3xATR level below the low, 9xATR below the low and 27xATR below the low.
Multipliers values can be changed as well, making it a versatile tool that shows potential levels of suppport/resistance based on the volatility .
Possible use cases:
Breakout trading, when price crosses a certain level, it may show potential profit targets for trades opened at a breakout.
Stoploss helper. Many traders use ATR for their stoplosses, 1 ATR below the swing low for long trades and 1 ATR above the swing high for short trades are common values used by many traders. In this case, the Lookback value comes handy, if we want to look maybe at a more recent value for swing high/low point.
It highlights ATR peaks, it also displays Bollinger bands of SMA400 (or Ema), breakouts for upper/lower bands.
Another thing you get is Parabolic SAR and Zigzag based on SAR.
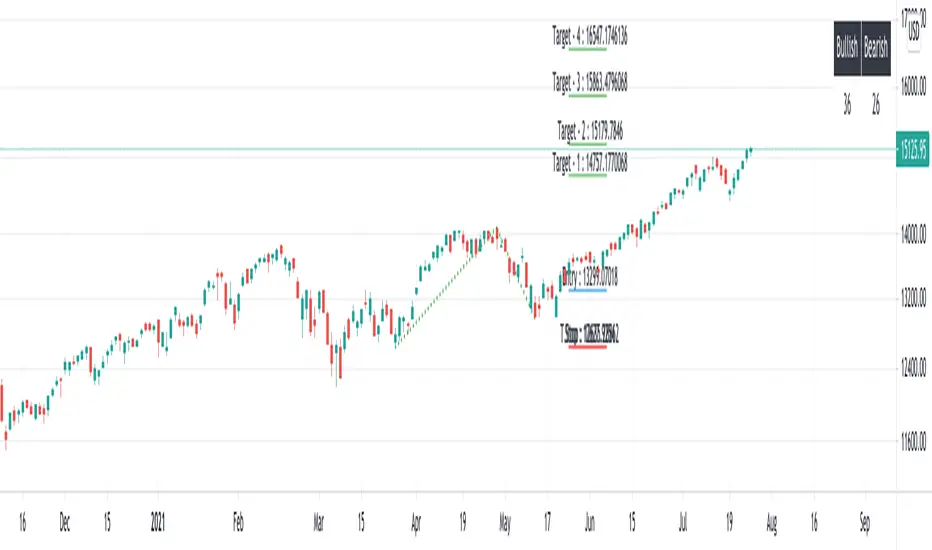
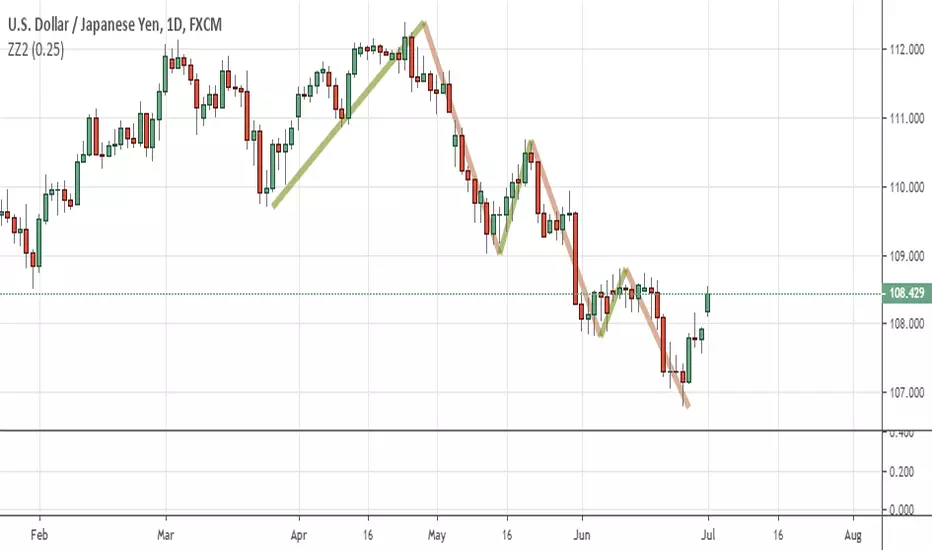
Elliot Wave - ImpulseLets dabble a bit into Elliot Waves.
This is a simple script which tries to identify Wave 1 and 2 of Elliot Impulese Wave and then projects for Wave 3.
Ratios are taken from below link: elliottwave-forecast.com - Section 3.1 Impulse
Wave 2 is 50%, 61.8%, 76.4%, or 85.4% of wave 1 - used for identifying the pattern.
Wave 3 is 161.8%, 200%, 261.8%, or 323.6% of wave 1-2 - used for setting the targets
Important input parameters
Length : Zigzag Length. Keep the numbers low if you are looking for smaller and shorter trades. Keep the numbers high if you are looking for longer and bigger trades.
Error Percent : Adjustments for ratios as it is not always possible to find exactly equal retracement ratio.
Entry Percent : Once Wave 2 is formed, entry is set after reversing 30% of wave 2. This number can be increased or decreased. Caution: Keeping the number too low may result in false signals.
Ignore Trend Direction : If unchecked, it will only look for pattern if Wave 1 has made a higher high. If not, it will ignore Wave 1 condition and only look at wave 1 to 2 ratio.
Handle Duplicates : Since, the labels are generated upon crossover of entry price, this crossover may happen multiple times. Or sometimes wave 2 can further extend and generate new signal with same wave 1. This parameter says how to handle such cases. Keep Last is set to default and is most preferred option.
ShowRatios and ShowWaves lets you display wave line and retracement ratios for each pivots
Easy System 420In this strategy, 15 indicators are used, each giving its results as a numerical value, which then is added or subtracted from the total points, gathered from all 15 indicators.
Many thanks to RafaelZioni for his great work making the EasySys1 script which i modified to create this script.
Onchart is drawn some of the indicators, but not all, a info panel is drawn showing the value each indicator has calculated. The info panel can be turned on or off.
Many of the indicator settings can be changed by user, and this is recommended, to tune the strategy to users chosen pair/timeframe.
Therefore any pair or timeframe can be used, the strategy tester results showing possible results, remember to set commission to match your broker. example chart settings here have common crypto exchange commission value: 0.25%
indicator list : SAR + STT + ZigZag + ROC + DMI + CCI + Weis + SMA + AO + MOM + Hist + BB + Ichimoku + HMA

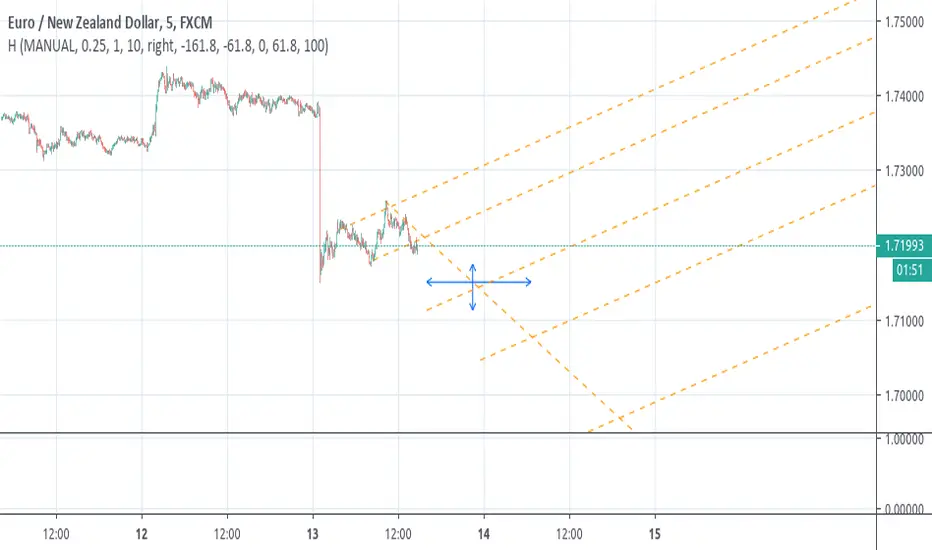
[RS][V4]ZigZag Percent Reversal - Helper - Retrace LevelsA helper script with multiple retrace level options.

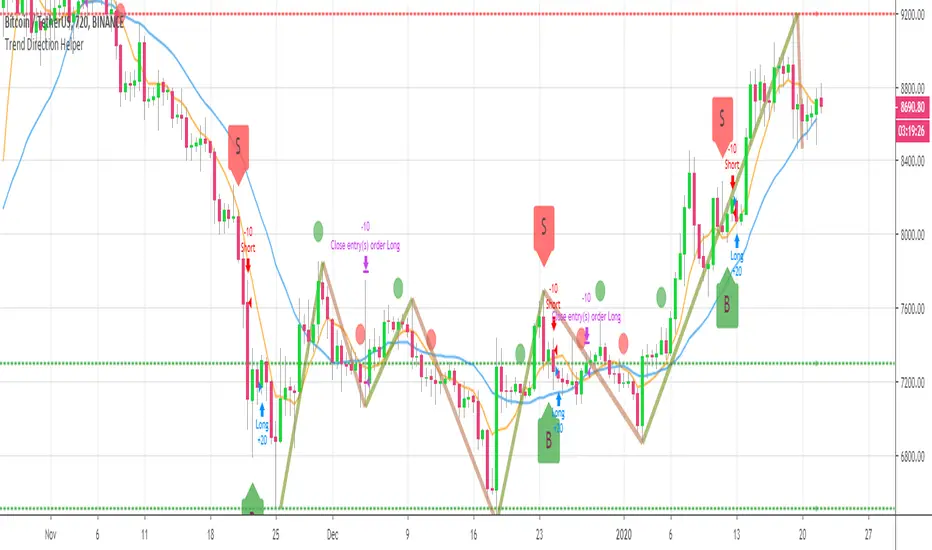
BEST Trend Direction Helper (Strategy Edition)Hello traders
A follower asked me to convert my Trend Direction Helper into a strategy
So blessed this indicator reached the 1400+ likes milestone - I can't believe how many people are trading with it
I based the setup as follow:
- Entries on those green/red labels
- exit whenever a Simple Moving Averages cross in the opposite direction happen
- possibility to filter only Longs/Shorts or both
Also...
The strategy includes the Zig Zag/Pivots high/low and other options from the indicator version. I only added a quick strategy component with a hard exit concept based on SMA cross
All the best fam and... HAPPY NEW YEAR !!!!!!!!!!!
Dave
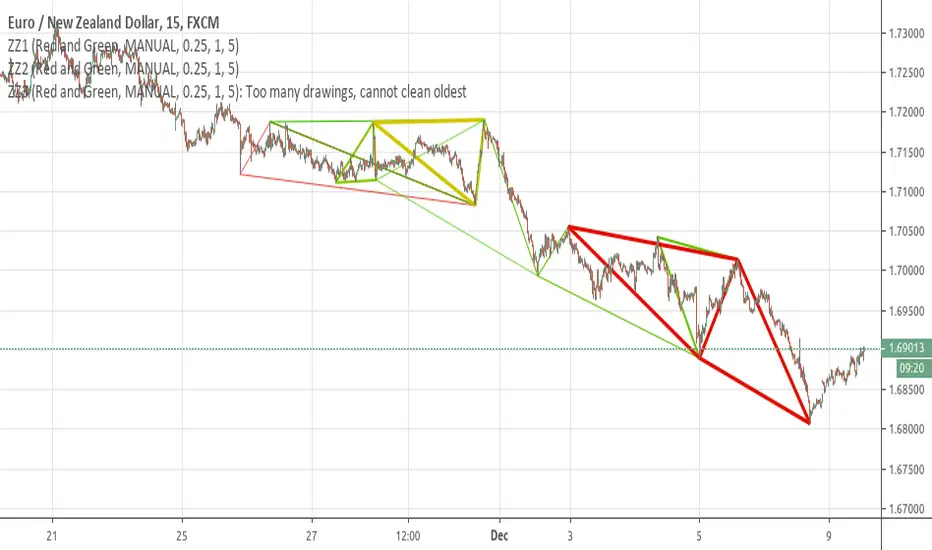
[RS]ZigZag Percent Reversal - Helper - Draw Patterns - Part 3Helper script to draw patterns on chart.
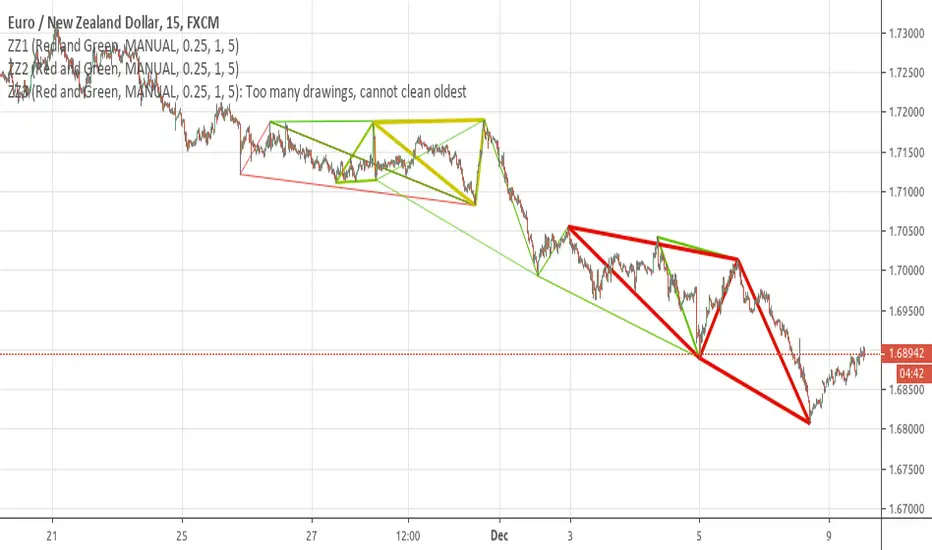
[RS]ZigZag Percent Reversal - Helper - Draw Patterns - Part 2Helper script to display patterns on chart.

[RS]ZigZag Percent Reversal - Helper - Draw Patterns - Part 1Helper script to display patterns on chart.
[RS][V4]ZigZag Percent Reversal - Helper - AntiSlopeEXPERIMENTAL:
A helper script to map the Anti derivative slopes.
Straightened Price CurveThis is another among zillions of attempts at a moving average of a security. More precisely, two attempts at one go). The zzoid function generates a zigzag-like MA that can adopt different forms. The stepline function creates, sure enough, a stepline.

Fractal FramerThis indicator constructs dynamic high/low price range levels, based on 3 point fractals. Trend lines are drawn (zigzag style) at fractal points when trend direction is clearly established.
This is a lagging indicator: fractals lag by one bar and trend lines can lag by many bars. However, its strength lays in objectively defining historic price action: e.g. support/resistance levels and waves within a trend.
See the comments at the beginning of the script for a complete description.


[CUSTOM] Valid Pullbacks with pendingTrendFollow the approach of Valid Pullback & Trend indicator, but I have customized to have a pending line waiting for confirmation of the root source code
Draws the pending line to the developing internal high/low
Once a new pivot is confirmed:
- The pendingTrend line is cleared
- The direction is remembered
- No additional blue lines are drawn until the next internal pivot forms in the opposite direction
Zig Zag ArmonyThis script try to help to identify flips and armonies using open and close values nstead hight and lows values.
For newbies, this script help to mark key levels for tendency continuation & breaking off
For flips and armony levels identification
3 levels recommended
30 Bars / Purple / line 5
15 Bars / Red / line 4
5 Bars / Black / line 3
Based on "Zig Zag High Low por Tr0sT"


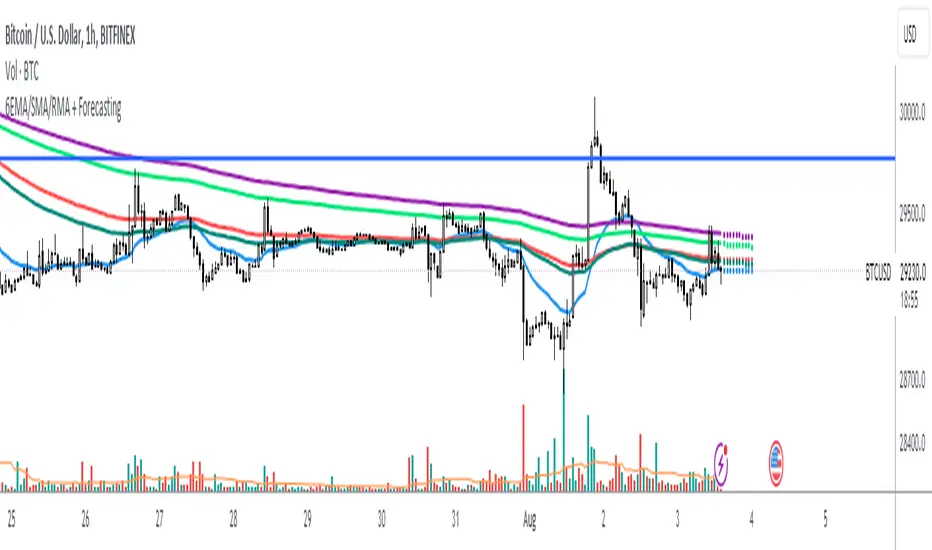
6 EMA/SMA/RMA + Forecasting 10 candles 6EMA/SMA/RMA + Forecasting 10 candles
The script allows the user to choose between different types of moving averages (SMA, EMA, RMA) using the soft_func_choice input.
The user can also choose between two types of forecasting: "Repetition" or "Linear Regression" using the type_of_forecast input.
For the linear regression forecast, the user can specify the number of candles to use in the linear regression calculation using the Linreglen input.
First Moving Average (MA) Calculation:
The script calculates the first MA based on the selected type (SMA, EMA, RMA) and plots it on the chart.
The user can customize the length and source of data for this MA.
If the selected forecast type is "Repetition," the script also calculates additional offset values for different repetitions of the MA.
Forecasting and Offset Calculation:
Depending on the chosen forecast type, the script calculates additional offset values for the MA. These offsets are used to forecast the future values of the MA.
The script calculates offsets for up to five repetitions (offset1, offset2, ..., offset5) for each MA.
If the forecast type is "Linear Regression," the script combines the MA's historical values with linear regression predictions to generate the forecasted values.
Plotting Additional Moving Averages:
The script allows the user to plot up to four additional MAs (Second MA, Third MA, Fourth MA, Fifth MA) with similar customizable settings for length and source of data.
Forecast Repetition:
If the forecast type is "Repetition," the script iterates through historical data and accumulates offset values, effectively simulating a repeated forecasting approach.
This repetition is controlled by a loop that adjusts the offset values based on historical price data.
Overall, this script provides a versatile tool for analyzing and forecasting multiple moving averages using various methods, allowing traders and analysts to experiment with different MA types and forecast strategies on their chosen price series.
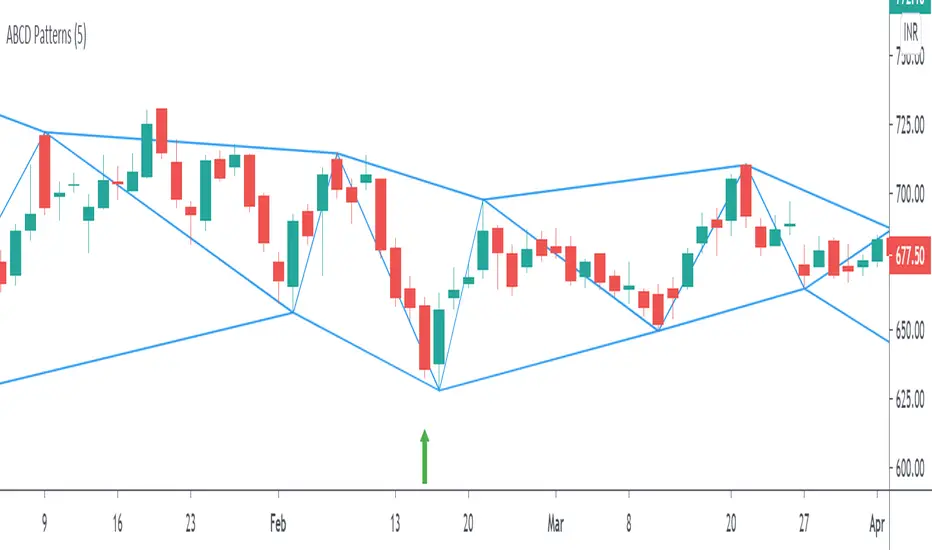
ABCD Harmonic PatternsShows Bullish and Bearish AB=CD Harmonic Patterns with Pivot High, Pivot Low and Pivot Line