Crypto Trend IndicatorThe Crypto Trend Indicator is a trend-following indicator specifically designed to identify bullish and bearish trends in the price of Bitcoin, and other cryptocurrencies. This indicator doesn't provide explicit instructions on when to buy or sell, but rather offers an understanding of whether the trend is bullish or bearish. It's important to note that this indicator is only useful for trend trading.
The band is a visual representation of the 30-day and 60-day Exponential Moving Average (EMA). When the 30-day EMA is above the 60-day EMA, the trend is bullish and the band is green. When the 30-day EMA is below the 60-day EMA, the trend is bearish and the band is red. When the 30-day EMA starts to converge with the 60-day EMA, the trend is neutral and the band is grey.
The line is a visual representation of the 20-week Simple Moving Average (SMA) in the daily timeframe. "Bull" and "Bear" signals are generated when the 20-day EMA is either above or below the 20-week SMA, in conjunction with a bullish or bearish trend. When the band is green and the 20-day EMA is above the 20-week SMA, a “Bull” signal emerges. When the band is red and the 20-day EMA is below the 20-week SMA, a “Bear” signal emerges. The 20-week SMA can potentially also function as a leading indicator, as substantial price deviations from the SMA typically indicate an overextended market.
While this indicator has traditionally identified bullish and bearish trends in various cryptocurrency assets, past performance does not guarantee future results. Therefore, it is advisable to supplement this indicator with other technical tools. For instance, range-bound indicators can greatly improve the decision-making process when planning for entries and exits points.
在脚本中搜索"市值60亿的股票"

Biddles OI Weighted Average PriceAhoy!
This script calculates Open Interested Weighted Average Price for the following lookback periods:
- 7, 30, 60
e.g. On the 1D chart, you will see OIWAP for the past 7, 30, and 60 days. It works on any timeframe though.
It works with any ticker that TV's OI indicator supports, and has ticker override if you are looking at an exchange that's unsupported, but for an asset that is.
e.g. If you're looking at Bybit's BTCUSDT.P which is unsupported- you can override to get OI data from Binance's BTCUSDT.P which is supported.
=====
Open-Sourced + Crowd Sourcing Goals
=====
I am open sourcing this in hopes we can work together to find interesting signal/observation, and make the script better.
The only way I could think of to calculate the OIWAP for the lookback periods was to manually factor in each period in the formula.
e.g. For the 60-period lookback, it's manually taking price and OI for each individual period.
I am also hoping other folks will make interesting observations.
With the few hours I've spent thus far, they seem to operate much like MA bands, with crossovers having similar implications.
But I feel like there are many other observations left unnoticed!
If you find any, hmu on twitter: @thalamu_
=====
Interesting Calculations in the Script, but not Plotted on the Chart
=====
There are calculations for up to 60 days of OIWAP taking change in OI rather than just OI.
There's one set for absolute value of change in OI, and one set for raw change in OI.
I didn't notice anything spectacularly interesting - but perhaps you will if you tinker with it!
=====
Find something cool? Have an improvement?
=====
Hmu on twitter: @thalamu_

RSI Candle Advanced V2RSI Advanced
As the period value is longer than 14, the RSI value sticks to the value of 50 and becomes useless.
Also, when the period value is less than 14, it moves excessively, so it is difficult for us to see the movement of the RSI .
So, using the period value and the RSI value as variables, I tried to make it easier to identify the RSI value through a new function expression.
This is how RSI Advanced was developed.
Period below 14 reduce the volatility of RSI , and period above 14 increase the volatility of RSI, allowing overbought and oversold zones to work properly and give you a better view of the trend.
By applying the custom algorithm so that the 'RSI Advanced' with period on a 5-minute timeframe has the same value as the 'original RSI' with period on a 60-minute timeframe.
As another example, an 'RSI Advanced' with a period in a 60-minute time frame has the same value as an 'original RSI' with a period in a 240-minute time frame.
Compare the difference in the RSI with a period value of 200 in the snapshot.
------------------------------------------------------------------------------------------
RSI Candlestick
RSI derives its value using only the closing price as a variable.
I solved the RSI equation in reverse and tried to include the high and low prices of candlesticks in the equation.
As a result, 'if the high or low was the closing price, the value of RSI would be like this' was implemented.
Just like when a candle comes down after setting a high price, an upper tail is formed when RSI Candle goes down after setting a high price!!
In divergence, we had to look only at the relationship between closing prices, but if we use RSI candles, we can find divergences in highs and highs, and lows and lows.
Existing indicators could not express "gap", but Version 2 made it possible to express "gap"!!!!!!
RSI can be displayed as candlesticks, bars and lines
Then enjoy my RSI!
----------------------------------------------------------------------------------------
RSI Advanced
기간값이 14보다 길어질수록 RSI값은 50값에 달라붙게 되어서 쓸모가 없어집니다.
또 기간값이 14보다 줄어들수록 과도하게 움직여서 우리는 RSI의 움직임을 보기가 힘듭니다.
그래서 기간 값과 RSI 값을 변수로 사용하여 새로운 함수 식을 통해 RSI 값을 식별하기 편하도록 해보았습니다.
이렇게 RSI Advanced가 개발되었습니다.
기간값이 14보다 낮으면 rsi의 변동폭이 줄어들고, 기간값이 14보다 크면 변동폭이 넓어져 과매수 및 과매도 영역이 제대로 작동하여 추세를 더 잘 볼 수 있습니다.
또한 저는 5분 타임프레임의 기간값이 168(=14*12)인 RSI가 주기 값이 14인 60분 타임프레임의 RSI와 동일한 값을 갖도록 적절한 함수 표현식을 적용하여 RSI를 변경했습니다.
다른 예로, 15분 시간 프레임에서 기간값이 56(=14*4)인 RSI는 60분 시간 프레임의 기간값이 14인 RSI와 동일한 값을 갖습니다.
기간값이 200인 RSI의 차이를 스냅샷에서 비교해보십시오.
-----------------------------
RSI Candlestick
RSI는 종가만을 변수로 사용하여 값을 도출해냅니다.
저는 RSI 식을 역으로 풀어내어서 캔들스틱의 고가와 저가, 시가를 식에 포함시켜보았습니다.
결과적으로, '만약 고가나 저가가 종가였다면 RSI의 값이 이럴것이다'를 구현해내었습니다.
캔들이 고가를 찍고 내려오면 윗꼬리가 생기듯 RSI Candle에서도 고가를 찍고 내려오면 윗꼬리가 생기는겁니다!!
다이버전스 또한 원래는 종가끼리의 관계만 봐야했지만 RSI 캔들을 이용한다면 고가와 고가, 저가와 저가에서도 다이버전스를 발견할 수 있습니다.
기존의 지표는 "갭"을 표현하지 못했지만 Version 2 에서는 "갭"을 표현할 수 있게 만들었습니다!!!!!!
그럼 잘 사용해주십시오!!!

PIVOT STRATEGY [INDIAN MARKET TIMING]
A Back-tested Profitable Strategy for Free!!
A PIVOT INTRADAY STRATEGY for 5 minute Time-Frame , that also explains the time condition for Indian Markets
The Timing can be changed to fit other markets, scroll down to "TIME CONDITION" to know more.
The commission is also included in the strategy .
The basic idea is when ,
1) Price crosses above ema1 ,indicated by pivot highest line in green color .
2) Price crosses below ema1 ,indicated by pivot lowest line in red color .
3) Candle high crosses above pivot highest , is the Long condition .
4) Candle low crosses below pivot lowest , is the Short condition .
5) Maximum Risk per trade for the intraday trade can be changed .
6) Default_qty_size is set to 60 contracts , which can be changed under settings → properties → order size .
7) ATR is used for trailing after entry, as mentioned in the inputs below.
// ═════════════════════════//
// ————————> INPUTS <————————— //
// ═════════════════════════//
Leftbars —————> Length of pivot highs and lows
Rightbars —————> Length of pivot highs and lows
Price Cross Ema —————> Added condition
ATR LONG —————> ATR stoploss trail for Long positions
ATR SHORT —————> ATR stoploss trail for Short positions
RISK —————> Maximum Risk per trade for the day
The strategy was back-tested on RELIANCE ,the input values and the results are mentioned under "BACKTEST RESULTS" below .
// ═════════════════════════ //
// ————————> PROPERTIES<——————— //
// ═════════════════════════ //
Default_qty_size ————> 60 contracts , which can be changed under settings
↓
properties
↓
order size
// ═══════════════════════════════//
// ————————> TIME CONDITION <————————— //
// ═══════════════════════════════//
The time can be changed in the script , Add it → click on ' { } ' → Pine editor→ making it a copy [right top corner} → Edit the line 25 .
The Indian Markets open at 9:15am and closes at 3:30pm .
The 'time_cond' specifies the time at which Entries should happen .
"Close All" function closes all the trades at 3pm, at the open of the next candle.
To change the time to close all trades , Go to Pine Editor → Edit the line 103 .
All open trades get closed at 3pm , because some brokers don't allow you to place fresh intraday orders after 3pm .
NSE:RELIANCE
// ═══════════════════════════════════════════════ //
// ————————> BACKTEST RESULTS ( 128 CLOSED TRADES )<————————— //
// ═══════════════════════════════════════════════ //
INPUTS can be changed for better back-test results.
The strategy applied to NIFTY ( 5 min Time-Frame and contract size 60 ) gives us 60% profitability y , as shown below
It was tested for a period a 6 months with a Profit Factor of 1.45 ,net Profit of 21,500Rs profit .
Sharpe Ratio : 0.311
Sortino Ratio : 0.727
The graph has a Linear Curve with consistent profits .
The INPUTS are as follows,
1) Leftbars ————————> 3
2) Rightbars ————————> 5
3) Price Cross Ema ——————> 150
4) ATR LONG ————————> 2.7
5) ATR SHORT ———————> 2.9
6) RISK —————————> 2500
7) Default qty size ——————> 60
NSE:RELIANCE
Save it to favorites.
Apply it to your charts Now !!
↓
FOLLOW US FOR MORE !
Thank me later ;)

RSI Trend Heatmap in Multi TimeframesRSI Trend Heatmap in Multi Timeframes
Description
Sometimes you want to look at the RSI Trend across multiple time frames.
You have to waste time browsing through them.
So we've put together every time frame you want to see in one indicator.
We have 10 layers of RSI Trend heatmap available for you.
You can set the timeframe as you want on the Settings page.
Description of Parameter RSI Setting ** You can change it by setting.
RSI Trend Length : (Default 50)
Source : (Default close)
RSI Sideways Length : (Default 2 = RSI between 48 .. 52)
Description of Parameter RSI Timeframe ** You can change it by setting.
""=None,
"M"=1Month, "2W"=2Weeks, "W"=1Week,
"3D"=3Days, "2D"=2Days, "D"=1Day,
"720"=12Hours, "480"=4Hours, "240"=4Hours, "180"=3Hours, "120"=2Hours,
"60"=60Minutes, "30"=30Minutes, "15"=15Minutes, "5"=5Minutes, "1"=1Minute
Default Configurate of RSI Timeframe (for a time frame of 1 hour to 1 day)
"W"= Timeframe 1 month shown in line 90-100 --> Represent Long Trend of RSI
---------------------------------------
"D2"= Timeframe 2 days shown in line 70-80 --> Represent Trend of RSI
"D"= Timeframe 1 day shown in line 60-70 --> Represent Trend of RSI
---------------------------------------
"240"= Timeframe 3 hours shown in line 40-50 --> Represent Signal Up/Signal Down/Divergence of RSI
"120"= Timeframe 2 hours shown in line 30-40 --> Represent Signal Up/Signal Down/Divergence of RSI
"60"= Timeframe 1 hour shown in line 20-30 --> Represent Signal Up/Signal Down/Divergence of RSI
"30"= Timeframe 30 minutes shown in line 10-20 --> Represent Signal Up/Signal Down/Divergence of RSI
"15"= Timeframe 15 minutes shown in line 00-10 --> Represent Signal Up/Signal Down/Divergence of RSI
Description of Colors
Dark Bule = Extreme Uptrend / Overbought / Bull Market (RSI > 67)
Light Bule = Uptrend (RSI between 50-52 .. 67)
Yellow = Sideways Trend / Trend Reversal (RSI between 48 .. 52) ** You can change it by setting.
Light Red = Downtrend (RSI between 33 .. 48-50)
Dark Red = Extreme Downtrend / Oversold / Bear Market (RSI < 33)
How to use
1. You must first know what the main trend of the RSI is (look at the 60-80 line). If it is red, it is a downtrend. and if it's blue shows that it is an uptrend
2. Throughout the period of the main trend There will always be a reversal of the sub-trend. (Can see from the 0-50 line), but eventually will return to follow the main trend.
3. Unless the sub trend persists for a long time until the main trend changes.

Runners & Laggers (scanner)Firstly, seems to me this may only work with crypto but I know nothing about the other sectors so i could be wrong. I was trying to think up a good way to find moving coins(other than by volume bc theres holes in the results when using it this way). Thought this was an interesting concept so decided to publish it as I've seen no others like it (though i did not extensively search for it. We need to start with a little Tradingview(TV) common knowledge. When there is no update of trades/volume in a candle TV does not print the candle. So when looking at (let's say) a 1 second chart, if the coin being observed by the user has no update from a trade in the time of that 1 sec candle it is skipped over. This means that a coin with a ton of volume might fill an entire 60 seconds with 60 candles and conversely with a low volume coin there could be as little as 0 1-second candles. BUT even for normally low volume coins, when a pump is beginning with the coin it could literally go from 0 1-second candles within a minute to 60 1-second candles within the next minute. ***NOTE: This DOES NOT show ANY information if the coin is going up or down but rather that a LOT more trading volume is occurring than normal.*** What this script does is scans (via request.security feature) up to 40 coins at a time and counts how many candles are printed within a user set timespan calculated in minute. 1 candle print per incremented timeframe that the chart is on. ie. if the chart is a 1 min chart it counts how many 1 min candles are printed. So, (as is in the captured image for the script) if you wanted to count how many 5 second candles are printed for each coin in 1 min then you would have to put the charts timeframe on 5sec and the setting titled 'Window of TIME(in minutes) to count bars' as 1.0 (which bc it's in minutes 1.0m = 60sec and bc 60s / 5s = 12 there would be 12 possible values that each coin can be at depending on how many bars are counted within that 1min/60sec. *** I will update to show an image of what I'm talking about here. Now, the exchange I'm scanning here is Kucoin's Margin Coins. There are 170 something coins total but I removed a few i didn't care for to make it a round 40 coins per set (there being 4 sets of 40 coins total=160 coins being scanned). To scan all 4 sets the indicator must be added 4 times to the chart and a different 'set' selected for each iteration of the script on the chart. Free users can only scan 3 at the most. All others can scan all 4 sets. In the script you can change the exchange and coins as necessary. If there done so and there are not 40 coins total just put '' '' in the extra coins spots that are not filled and the script will skip over these blankly filled spots. The suffix (traded pair) for the tickerID on all Kucoin's Margin Coin's is USDT so that's what i have inputted in the main function on line 46 (will need to be changed if that differs from the coins you want to scan. Next in the line of settings is 'Window of TIME(in minutes) to count bars' which has already been discussed. Following that is the setting "Table Shows" which the results are all in a table and the table will present the coins that have either "Passed" or "Failed" depending on which you choose. The next setting determines what passes or fails. If there are 12 possible rows for the coins to be in (as described above) then this setting is the "Pass/Fail Cutoff" level. So if you want to show all the coins that are in rows 11 and 12 (as in the image at top) then 11 should be selected here. At this point you will see all the coins that have a lot of volume in them. Finding coin names in the table that are usually not with a ton of volume will present your present movers. NOTE: coins like BTC and ETH will almost always be in these levels so it does not indicate anything different from the norm of these coins. Last setting is the ability to show the table on the main window or not. Hope you enjoy and find use in it. BTW this screener format is the same as the others I have published. If you like, check those out too. If you find difficulty using then refer to those as well as they have additional info in them on how to use the scanner and its format. Lastly, in the script is the ability to print the plots and labels but I commented them out bc its really just a jumbled mess. In the commented out sections there is a Random Color Function (provided by @hewhomustnotbenamed which was developed on the basis of Function-HSL-color by @RicardoSantos. All right, peace brothers....and sisters.
**** Also, I see how the "levels" could be confusing so I will put them into a % format soon (probably not today) so that the "Pass/Fail Cutoff" can be in % format so that if "passed" is chosen and 50% is chosen (in the new setting that will be changed) then it'll show you all the coins that have more than 50% of the bars printed within the time window chosen. Goodluck in all your trading adventures. ChasinAlts out.

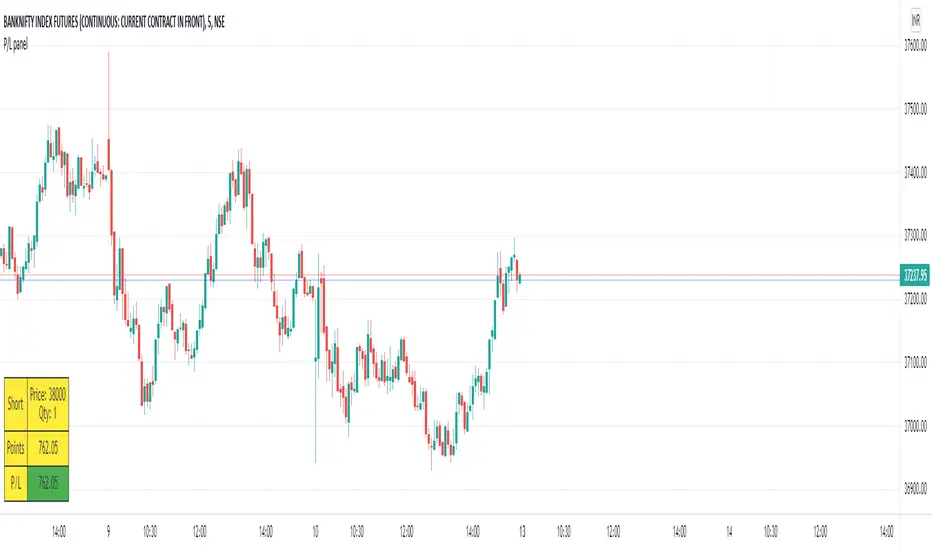
P/L panelThis is not a indicator or strategy.
I thought of having a table showing running profit or loss on chart from a specific price.
I tried to put the same in code and ended up with this code.
This is a table showing the running profit or loss from a manually specified price and quantity.
when you add the code, This table asks us to input the entry price and quantity.
It will calculate the running profit or loss with respect to running price and puts that in the table.
We will have to input two things.
1.) entry price: the price at which a position(long/short) is taken.
2.) Quantity: A +value need to be entered for Long position and -value for short position.
code detects whether its a long position or short position based on the quantity info.
for example if a LONG position is taken at a price 60 of 100 quantity,
then in price we need to enter 60
and in quantity 100 (+ve value)
for SHORT position at a price of 60 of 100 quantity,
in price we need to enter 60
and in quantity -100 (-ve value)
once the table is added to the chart.
Just double click on the table, it will open the settings tab and we can provide new inputs price/quantity/position.
positioning of table is optional and all possible positioning options are provided.
Advise further improvements required if any in this code.
This piece of code can be used along with any indicator.
For which we may need to use valuewhen() additionally.
Try it yourself and ping me if required.
RSI Candle with Advanced RSI fomulaRSI Advanced
As the period value is longer than 14, the RSI value sticks to the value of 50 and becomes useless.
Also, when the period value is less than 14, it moves excessively, so it is difficult for us to see the movement of the RSI.
So, using the period value and the RSI value as variables, I tried to make it easier to identify the RSI value through a new function expression.
This is how RSI Advanced was developed.
Period values below 14 reduce the volatility of RSI, and period values greater than 14 allow wider fluctuations, allowing overbought and oversold zones to work properly and give you a better view of the trend.
I also changed the RSI by applying the appropriate function expression so that the RSI with a period value of 168 (=14*12) on a 5 minute timeframe has the same value as the RSI on a 60 minute timeframe with a period value of 14.
As another example, an RSI with a period value of 56 (=14*4) in a 15-minute time frame has the same value as an RSI with a period value of 14 in a 60-minute time frame.
Compare the difference in the RSI with a period value of 200 in the snapshot.
------------------------------------------------------------------------------------------
RSI Candlestick
RSI derives its value using only the closing price as a variable. I solved the RSI equation in reverse and tried to include the high and low prices of candlesticks in the equation.
As a result, 'if the high or low was the closing price, the value of RSI would be like this' was implemented. Just like when a candle comes down after setting a high price, an upper tail is formed when RSI Candle goes down after setting a high price!!
In divergence, we had to look only at the relationship between closing prices, but if we use RSI candles, we can find divergences in highs and highs, and lows and lows.
Then enjoy my RSI!
----------------------------------------------------------------------------------------
RSI Advanced
기간값이 14보다 길어질수록 RSI값은 50값에 달라붙게되어서 쓸모가 없어집니다.
또 기간값이 14보다 줄어들수록 과도하게 움직여서 우리는 RSI의 움직임을 보기가 힘듭니다.
그래서 기간 값과 RSI 값을 변수로 사용하여 새로운 함수 식을 통해 RSI 값을 식별하기 편하도록 해보았습니다.
이렇게 RSI Advanced가 개발되었습니다.
기간값이 14보다 낮으면 rsi의 변동폭이 줄어들고, 기간값이 14보다 크면 변동폭이 넓어져 과매수 및 과매도 영역이 제대로 작동하여 추세를 더 잘 볼 수 있습니다.
또한 저는 5분 타임프레임의 기간값이 168(=14*12)인 RSI가 주기 값이 14인 60분 타임프레임의 RSI와 동일한 값을 갖도록 적절한 함수 표현식을 적용하여 RSI를 변경했습니다.
다른 예로, 15분 시간 프레임에서 기간값이 56(=14*4)인 RSI는 60분 시간 프레임의 기간값이 14인 RSI와 동일한 값을 갖습니다.
기간값이 200인 RSI의 차이를 스냅샷에서 비교해보십시오.
-----------------------------
RSI Candlestick
RSI는 종가만을 변수로 사용하여 값을 도출해냅니다. 저는 RSI 식을 역으로 풀어내어서 캔들스틱의 고가와 저가를 식에 포함시켜보았습니다.
결과적으로, '만약 고가나 저가가 종가였다면 RSI의 값이 이럴것이다'를 구현해내었습니다. 캔들이 고가를 찍고 내려오면 윗꼬리가 생기듯 RSI Candle에서도 고가를 찍고 내려오면 윗꼬리가 생기는겁니다!!
다이버전스 또한 원래는 종가끼리의 관계만 봐야했지만 RSI 캔들을 이용한다면 고가와 고가, 저가와 저가에서도 다이버전스를 발견할 수 있습니다.
그럼 잘 사용해주십시오!!!

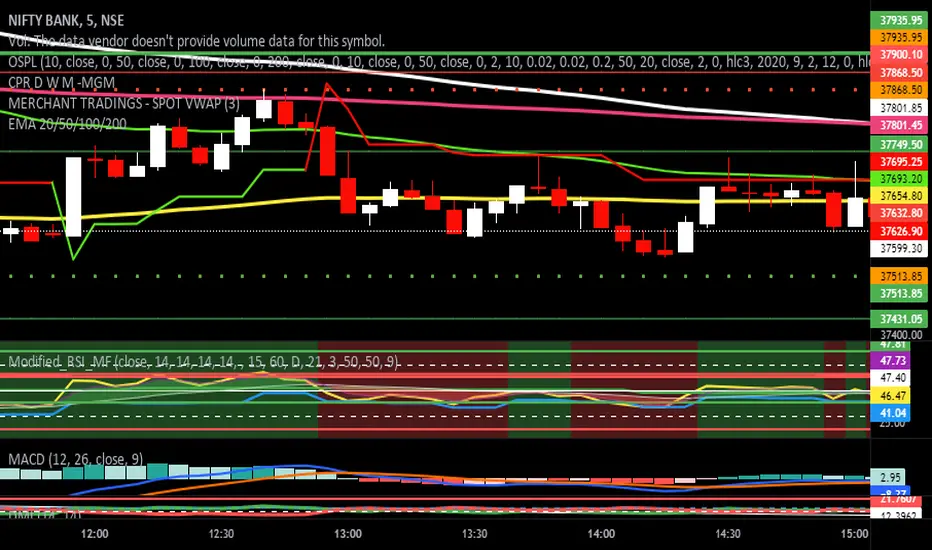
Modified RSI Multi-Time Frame (HM)Effective RSI with Multi-Timeframe with Hilema - Milega(HM) concept (HM=WMA -EMA). RSI Script is included with WMA and EMA band for RSI1 and it works very simple
i) When the RSI band turns to Green its a Buy signal. Normally whenever Bearish strength weakens and move towards the Bullish area, the WMA and EMA cross each other and that tends to provide a possible trend change. A trade at crossover normally provides a very good trading oppertunity. One can combine with some other Price action if needed for double confirmation.
ii)When RSI band turns to RED its a Sell signal. As explained in the point 1 , its a vice-versa where a crossover of WMA and EMA is perfect entry to get a good swing trade. Once can combine this tool with Price action for double confirmation.
iii) Using the Multi timeframe user could able to find the trend at higher timeframe to take double confirm on the trend strength and take a perfect oppertunity to take the trade.
By default, script uses the RSI with length 14, WMA 21 and EMA 3 which perfectly working for Index in NSE. Please change as per your requirement.
Apart from the above band, RSI is not have the different levels like 20/ 40 /50/60/80
Multi-timeframes currently set as
RSI1 - Same as Chart
RSI2 - 15 Min
RSI3 - 60 Min
RSI4 - Daily
Script has enabled the option to change the values for these timeframes as per the user requirement.
These ranges can be interpreted and acts as a probable swing points based on the trend and momentum.
40-60 - Neutral Range or Sideways
20 - 60 Bearish range
40 - 70 - Bullish range
Below 20 -- Over Sold Zone
Above 80 - over Bought zone
Also, the crossovers of the WMA and EMA on the RSI gives a very good momentum towards that trend.
[kai]Futility RatioAn indicator that measures movement inefficiency
Inefficient movement, that is, the range market becomes a high number, the limit is reached at about 60 and a trend occurs
When the range breaks and a trend occurs, the inefficiency drops to about 40 and many trends end.
The full-scale trend goes down further and goes down to about 25, which is evaluated as an efficient movement, the limit is reached and the trend ends.
As for how to use this Inge, the direction of the trend needs to be considered in other ways.
Create a position when you reach 60
Position closed or contrarian at 40 or 25
I assume the usage
動きの非効率性を測定するインジケーターです
非効率な動きをするつまりレンジ相場は高い数字になって、60程度で限界が訪れてトレンドが発生します
レンジがブレイクしトレンドが発生すると40程度まで非効率性は下がりって多くのトレンドは終了します
本格的なトレンドはさらに下がっていって効率的な動きと評価される25程度まで下がって限界が訪れてトレンドが終了します
このインジの使い方はトレンドの方向は他の方法で考える必要がありますが
60まで上がったときにポジション作成
40又は25でポジションクローズ又は逆張り
という使い方を想定しています

Waindrops [Makit0]█ OVERALL
Plot waindrops (custom volume profiles) on user defined periods, for each period you get high and low, it slices each period in half to get independent vwap, volume profile and the volume traded per price at each half.
It works on intraday charts only, up to 720m (12H). It can plot balanced or unbalanced waindrops, and volume profiles up to 24H sessions.
As example you can setup unbalanced periods to get independent volume profiles for the overnight and cash sessions on the futures market, or 24H periods to get the full session volume profile of EURUSD
The purpose of this indicator is twofold:
1 — from a Chartist point of view, to have an indicator which displays the volume in a more readable way
2 — from a Pine Coder point of view, to have an example of use for two very powerful tools on Pine Script:
• the recently updated drawing limit to 500 (from 50)
• the recently ability to use drawings arrays (lines and labels)
If you are new to Pine Script and you are learning how to code, I hope you read all the code and comments on this indicator, all is designed for you,
the variables and functions names, the sometimes too big explanations, the overall structure of the code, all is intended as an example on how to code
in Pine Script a specific indicator from a very good specification in form of white paper
If you wanna learn Pine Script form scratch just start HERE
In case you have any kind of problem with Pine Script please use some of the awesome resources at our disposal: USRMAN , REFMAN , AWESOMENESS , MAGIC
█ FEATURES
Waindrops are a different way of seeing the volume and price plotted in a chart, its a volume profile indicator where you can see the volume of each price level
plotted as a vertical histogram for each half of a custom period. By default the period is 60 so it plots an independent volume profile each 30m
You can think of each waindrop as an user defined candlestick or bar with four key values:
• high of the period
• low of the period
• left vwap (volume weighted average price of the first half period)
• right vwap (volume weighted average price of the second half period)
The waindrop can have 3 different colors (configurable by the user):
• GREEN: when the right vwap is higher than the left vwap (bullish sentiment )
• RED: when the right vwap is lower than the left vwap (bearish sentiment )
• BLUE: when the right vwap is equal than the left vwap ( neutral sentiment )
KEY FEATURES
• Help menu
• Custom periods
• Central bars
• Left/Right VWAPs
• Custom central bars and vwaps: color and pixels
• Highly configurable volume histogram: execution window, ticks, pixels, color, update frequency and fine tuning the neutral meaning
• Volume labels with custom size and color
• Tracking price dot to be able to see the current price when you hide your default candlesticks or bars
█ SETTINGS
Click here or set any impar period to see the HELP INFO : show the HELP INFO, if it is activated the indicator will not plot
PERIOD SIZE (max 2880 min) : waindrop size in minutes, default 60, max 2880 to allow the first half of a 48H period as a full session volume profile
BARS : show the central and vwap bars, default true
Central bars : show the central bars, default true
VWAP bars : show the left and right vwap bars, default true
Bars pixels : width of the bars in pixels, default 2
Bars color mode : bars color behavior
• BARS : gets the color from the 'Bars color' option on the settings panel
• HISTOGRAM : gets the color from the Bearish/Bullish/Neutral Histogram color options from the settings panel
Bars color : color for the central and vwap bars, default white
HISTOGRAM show the volume histogram, default true
Execution window (x24H) : last 24H periods where the volume funcionality will be plotted, default 5
Ticks per bar (max 50) : width in ticks of each histogram bar, default 2
Updates per period : number of times the histogram will update
• ONE : update at the last bar of the period
• TWO : update at the last bar of each half period
• FOUR : slice the period in 4 quarters and updates at the last bar of each of them
• EACH BAR : updates at the close of each bar
Pixels per bar : width in pixels of each histogram bar, default 4
Neutral Treshold (ticks) : delta in ticks between left and right vwaps to identify a waindrop as neutral, default 0
Bearish Histogram color : histogram color when right vwap is lower than left vwap, default red
Bullish Histogram color : histogram color when right vwap is higher than left vwap, default green
Neutral Histogram color : histogram color when the delta between right and left vwaps is equal or lower than the Neutral treshold, default blue
VOLUME LABELS : show volume labels
Volume labels color : color for the volume labels, default white
Volume Labels size : text size for the volume labels, choose between AUTO, TINY, SMALL, NORMAL or LARGE, default TINY
TRACK PRICE : show a yellow ball tracking the last price, default true
█ LIMITS
This indicator only works on intraday charts (minutes only) up to 12H (720m), the lower chart timeframe you can use is 1m
This indicator needs price, time and volume to work, it will not work on an index (there is no volume), the execution will not be allowed
The histogram (volume profile) can be plotted on 24H sessions as limit but you can plot several 24H sessions
█ ERRORS AND PERFORMANCE
Depending on the choosed settings, the script performance will be highly affected and it will experience errors
Two of the more common errors it can throw are:
• Calculation takes too long to execute
• Loop takes too long
The indicator performance is highly related to the underlying volatility (tick wise), the script takes each candlestick or bar and for each tick in it stores the price and volume, if the ticker in your chart has thousands and thousands of ticks per bar the indicator will throw an error for sure, it can not calculate in time such amount of ticks.
What all of that means? Simply put, this will throw error on the BITCOIN pair BTCUSD (high volatility with tick size 0.01) because it has too many ticks per bar, but lucky you it will work just fine on the futures contract BTC1! (tick size 5) because it has a lot less ticks per bar
There are some options you can fine tune to boost the script performance, the more demanding option in terms of resources consumption is Updates per period , by default is maxed out so lowering this setting will improve the performance in a high way.
If you wanna know more about how to improve the script performance, read the HELP INFO accessible from the settings panel
█ HOW-TO SETUP
The basic parameters to adjust are Period size , Ticks per bar and Pixels per bar
• Period size is the main setting, defines the waindrop size, to get a better looking histogram set bigger period and smaller chart timeframe
• Ticks per bar is the tricky one, adjust it differently for each underlying (ticker) volatility wise, for some you will need a low value, for others a high one.
To get a more accurate histogram set it as lower as you can (min value is 1)
• Pixels per bar allows you to adjust the width of each histogram bar, with it you can adjust the blank space between them or allow overlaping
You must play with these three parameters until you obtain the desired histogram: smoother, sharper, etc...
These are some of the different kind of charts you can setup thru the settings:
• Balanced Waindrops (default): charts with waindrops where the two halfs are of same size.
This is the default chart, just select a period (30m, 60m, 120m, 240m, pick your poison), adjust the histogram ticks and pixels and watch
• Unbalanced Waindrops: chart with waindrops where the two halfs are of different sizes.
Do you trade futures and want to plot a waindrop with the first half for the overnight session and the second half for the cash session? you got it;
just adjust the period to 1860 for any CME ticker (like ES1! for example) adjust the histogram ticks and pixels and watch
• Full Session Volume Profile: chart with waindrops where only the first half plots.
Do you use Volume profile to analize the market? Lucky you, now you can trick this one to plot it, just try a period of 780 on SPY, 2760 on ES1!, or 2880 on EURUSD
remember to adjust the histogram ticks and pixels for each underlying
• Only Bars: charts with only central and vwap bars plotted, simply deactivate the histogram and volume labels
• Only Histogram: charts with only the histogram plotted (volume profile charts), simply deactivate the bars and volume labels
• Only Volume: charts with only the raw volume numbers plotted, simply deactivate the bars and histogram
If you wanna know more about custom full session periods for different asset classes, read the HELP INFO accessible from the settings panel
EXAMPLES
Full Session Volume Profile on MES 5m chart:
Full Session Unbalanced Waindrop on MNQ 2m chart (left side Overnight session, right side Cash Session):
The following examples will have the exact same charts but on four different tickers representing a futures contract, a forex pair, an etf and a stock.
We are doing this to be able to see the different parameters we need for plotting the same kind of chart on different assets
The chart composition is as follows:
• Left side: Volume Labels chart (period 10)
• Upper Right side: Waindrops (period 60)
• Lower Right side: Full Session Volume Profile
The first example will specify the main parameters, the rest of the charts will have only the differences
MES :
• Left: Period size: 10, Bars: uncheck, Histogram: uncheck, Execution window: 1, Ticks per bar: 2, Updates per period: EACH BAR,
Pixels per bar: 4, Volume labels: check, Track price: check
• Upper Right: Period size: 60, Bars: check, Bars color mode: HISTOGRAM, Histogram: check, Execution window: 2, Ticks per bar: 2,
Updates per period: EACH BAR, Pixels per bar: 4, Volume labels: uncheck, Track price: check
• Lower Right: Period size: 2760, Bars: uncheck, Histogram: check, Execution window: 1, Ticks per bar: 1, Updates per period: EACH BAR,
Pixels per bar: 2, Volume labels: uncheck, Track price: check
EURUSD :
• Upper Right: Ticks per bar: 10
• Lower Right: Period size: 2880, Ticks per bar: 1, Pixels per bar: 1
SPY :
• Left: Ticks per bar: 3
• Upper Right: Ticks per bar: 5, Pixels per bar: 3
• Lower Right: Period size: 780, Ticks per bar: 2, Pixels per bar: 2
AAPL :
• Left: Ticks per bar: 2
• Upper Right: Ticks per bar: 6, Pixels per bar: 3
• Lower Right: Period size: 780, Ticks per bar: 1, Pixels per bar: 2
█ THANKS TO
PineCoders for all they do, all the tools and help they provide and their involvement in making a better community
scarf for the idea of coding a waindrops like indicator, I did not know something like that existed at all
All the Pine Coders, Pine Pros and Pine Wizards, people who share their work and knowledge for the sake of it and helping others, I'm very grateful indeed
I'm learning at each step of the way from you all, thanks for this awesome community;
Opensource and shared knowledge: this is the way! (said with canned voice from inside my helmet :D)
█ NOTE
This description was formatted following THIS guidelines
═════════════════════════════════════════════════════════════════════════
I sincerely hope you enjoy reading and using this work as much as I enjoyed developing it :D
GOOD LUCK AND HAPPY TRADING!

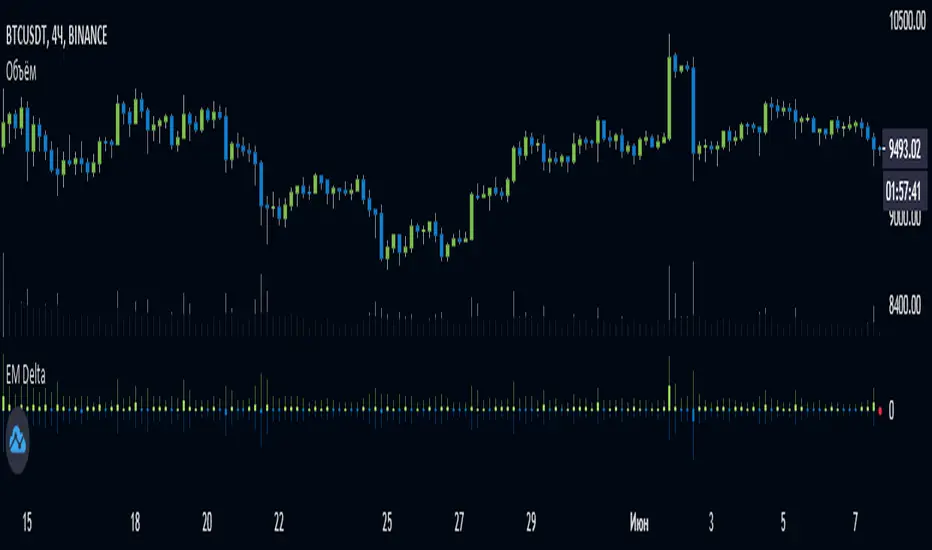
EulerMethod: DeltaEN
Shows the Integral Volume Delta (IVD)
It is a detailed OBV. Each bar sums up the volume for bars of a shorter timeframe.
For example, inside a 1M bar, every 12h bar is added up, and inside a 1h bar, every 1min bar is added. Thus, a conditional volume delta inside the bar is obtained.
The indicator for each bar shows the volume of purchases (positive), sales (negative) and the difference — IVD
The delta histogram is thicker than the volume histograms
Settings detalisation
M — 6 hours, 12 hours and 1 day for the M timeframe (720 by default)
W — 4 hours, 6 hours and 12 hours for the W timeframe (240 by default)
D — 30 minutes, 1 hour and 2 hours for the D timeframe (60 by default)
H — 1 minute, 5 minutes and 15 minutes for timeframes [1h, D) (default is 1)
For timeframes of 15m and less, the calculation is carried out by minute bars
VSA mode
The classic OBV adds volume to the cumulative sum under the condition Сlose (n) > Close (n-1) and subtracts it under the condition Close (n) < Close (n-1)
When VSA mode is disabled, all volumes are summed up under these conditions.
When the VSA approximation is turned on, the volume per bar of detail is divided by the factor (Close - Low) / (High - Low)
That is, it takes into account the spread per bar and closing relative to the spread. VSA is enabled by default
A/D mode
Shows the cumulative Accumulation / Distribution Index
The delta of the detail bar is multiplied by (High + Low + Close) / 3 bars, the result is added to the cumulative sum
No additional price conversions required due to integral summation
Index line view is customizable
EM Delta does not receive intermediate values in real time.
To see the result, wait until the bar closes or switch to a smaller timeframe
RU
Показывает Интегральную Дельту Объёма (ИДО)
Представляет собой детализированный OBV. В каждом баре суммируется объём за бары меньшего таймфрейма.
Например, внутри 1М-бара суммируется каждый 12h-бар, а внутри 1h — каждый 1m-бар. Таким образом получается условная дельта объёма внутри бара
Индикатор на каждый бар показывает объём покупок (положительный), объём продаж (отрицательный) и разницу — ИДО
Гистограмма дельты толще гистограмм объёмов
Настройки детализации внутри бара
M — 6 часов, 12 часов и 1 день для таймфрейма M (по-умолчанию 720)
W — 4 часа, 6 часов и 12 часов для таймфрейма W (по-умолчанию 240)
D — 30 минут, 1 час и 2 часа для таймфрейма D (по-умолчанию 60)
H — 1 минута, 5 минут и 15 минут для таймфреймов [1h, D) (по-умолчанию 1)
Для таймфреймов 15m и меньше расчёт ведётся по минутным барам
Режим VSA
Классический OBV прибавляет объём к кумулятивной сумме при условии Сlose(n) > Close(n-1) и отнимает при условии Close(n) < Close(n-1)
При отключении режима VSA все объёмы суммируются по этим условиям
При включённой VSA-аппроксимации объём за бар детализации делится по фактору (Close - Low) / (High - Low)
То есть учитывает спред за бар и закрытие относительно спреда. По-умолчанию режим VSA включен
Режим A/D
Показывает кумулятивный индекс Накопления/Распределения
Дельта бара детализации умножается на (High + Low + Close) / 3 бара, результат прибавляется к кумулятивной сумме
Дополнительные преобразования цены не требуются ввиду интегрального суммирования
Вид линии индекса настраивается
EM Delta не получает промежуточные значения в реальном времени.
Чтобы увидеть результат, дождитесь закрытия бара или перейдите на меньший таймфрейм
ICHIMOKU MTFMultiple Time Frame Version of Ichimoku Kinko Hyo Indicator.
Created in 1940's by Goichi Hosoda withe the help of University students in Japan.
Ichimoku is one of the best trend following indicators that works nearly perfect in all markets and time frames.
Ichimoku is originally an built in indicator in Tradingview but there are some problems like:
the indicator hast 5 lines but you can change only 4 parameters in the settings menu of Tradingview Charts which you could only control 3 of the lines effectively. A second problem is that Tradingview preferred to use English titles for the ICHIMOKU lines instead of giving them the most common original Japanese ones. (So I rewrite the indicator)
Kijun Sen (blue line): Also called standard line or base line, this is calculated by averaging the highest high and the lowest low for the past 26 periods.
Tenkan Sen (red line): This is also known as the turning line and is derived by averaging the highest high and the lowest low for the past nine periods.
Chikou Span (Plum line): This is called the lagging line. It is today’s closing price plotted 26 periods behind.
Senkou SpanA (green line): The first Senkou line is calculated by averaging the Tenkan Sen and the Kijun Sen and plotted 26 periods ahead.
Senkou SpanB (purple line):
The second Senkou line is determined by averaging the highest high and the lowest low for the past 52 periods and plotted 26 periods ahead.
PERSONALLY I ADVISE YOU TO USE ICHIMOKU WITH DEAFULT LENGTHS (9,26,26,52,26) IN ORDER FOR STOCK MARKETS AND FOREX MARKETS
FOR CRYPTO YOU'D BETTER USE:
10,30,30,60,30 OR 20,60,60,120,60
THE TRICKY THING IS THAT KEEPING THE 1-3-3-6-3 RATIO CONSTANT IS NECESSARY
Here's a link of my Youtube video explaining ICHIMOKU but unfortunately only in TURKISH:
www.youtube.com
Developed by: Goichi Hosoda
Here's the link to a complete list of all my indicators:
tr.tradingview.com
Ichimoku kullanımı anlattığım detaylı video serisini linkten izleyebilirsiniz:
www.youtube.com
İndikatörü geliştiren: Goichi Hosoda

ICHIMOKU Kinko Hyo by KIVANC fr3762Created in 1940's by Goichi Hosoda withe the help of University students in Japan.
Ichimoku is one of the best trend following indicators that works nearly perfect in all markets and time frames.
Ichimoku is originally an built in indicator in Tradingview but there are some problems like:
the indicator hast 5 lines but you can change only 4 parameters in the settings menu of Tradingview Charts which you could only control 3 of the lines effectively. A second problem is that Tradingview preferred to use English titles for the ICHIMOKU lines instead of giving them the most common original Japanese ones. (So I rewrite the indicator)
Kijun Sen (blue line): Also called standard line or base line, this is calculated by averaging the highest high and the lowest low for the past 26 periods.
Tenkan Sen (red line): This is also known as the turning line and is derived by averaging the highest high and the lowest low for the past nine periods.
Chikou Span (Plum line): This is called the lagging line. It is today’s closing price plotted 26 periods behind.
Senkou SpanA (green line): The first Senkou line is calculated by averaging the Tenkan Sen and the Kijun Sen and plotted 26 periods ahead.
Senkou SpanB (purple line):
The second Senkou line is determined by averaging the highest high and the lowest low for the past 52 periods and plotted 26 periods ahead.
PERSONALLY I ADVISE YOU TO USE ICHIMOKU WITH DEAFULT LENGTHS (9,26,26,52,26) IN ORDER FOR STOCK MARKETS AND FOREX MARKETS
FOR CRYPTO YOU'D BETTER USE:
10,30,30,60,30 OR 20,60,60,120,60
THE TRICKY THING IS THAT KEEPING THE 1-3-3-6-3 RATIO CONSTANT IS NECESSARY
Here's a link of my Youtube video explaining ICHIMOKU but unfortunately only in TURKISH:
www.youtube.com
Developed by: Goichi Hosoda

Money Flow Index + AlertsThis study is based on the work of TV user Beasley Savage ( ) and all credit goes to them.
Changes I've made:
1. Added a visual symbol of an overbought/oversold threshold cross in the form of a red/green circle, respectively. Sometimes it can be hard to see when a cross actually occurs, and if your scaling isn't set up properly you can get misleading visuals. This way removes all doubt. Bear in mind they aren't meant as trading signals, so DO NOT use them as such. Research the MFI if you're unsure, but I use them as an early warning and that particular market/stock is added to my watchlist.
2. Added 60/40 lines as the MFI respects these incredibly well in trends. E.g. in a solid uptrend the MFI won't go below 40, and vice versa. Use the idea of support and resistance levels on the indicator and it'll be a great help. I've coloured the zones. Strong uptrends should stay above 60, strong downtrends should stay below 40. The zone in between 40-60 I've called the transition zone. MFI often stays here in consolidation periods, and in the last leg of a cycle/trend the MFI will often drop into this zone after being above 60 or below 40. This is a great sign that you should get out and start looking to reverse your position. Hopefully it helps to spot divergences as well.
3. Added alerts based on an overbought/oversold cross. Also added an alert for when either condition is triggered, so hopefully that's useful for those struggling with low alert limits. Feel free to change the overbought/oversold levels, the alerts + crossover visual are set to adapt.
Like any indicator, don't use this one alone. It works best paired with indicators/techniques that contradict it. You'll often see a OB/OS cross, and price will continue on it's way for many weeks more. But MFI is a great tool for identifying upcoming trend changes.
Any queries please comment or PM me.
Cheers,
RJR

PT Magic - BTC/ETH Trigger Trend ChangesThis Script shows you how BTC/ETH Percentage change in trends affect coins you trade.
- For ETH market please change BTC in Setting for ETH
What you need it PT Magic:
{
"Name": "BTC1h", // UNIQUE market trend name (to be referenced by your triggers below)
"Platform": "CoinMarketCap", // Platform to grab prices from (Allowed values are: CoinMarketCap, Exchange)
"MaxMarkets": 1, // Number of markets/pairs to analyze sorted by 24h volume
"TrendMinutes": 60 // Number of minutes to build a trend (1440 = 24h, 720 = 12h, 60 = 1h)
},
{
"Name": "ETH1h", // UNIQUE market trend name (to be referenced by your triggers below)
"Platform": "CoinMarketCap", // Platform to grab prices from (Allowed values are: CoinMarketCap, Exchange)
"MaxMarkets": 2, // Number of markets/pairs to analyze sorted by 24h volume
"IgnoredMarkets": "BTC",
"TrendMinutes": 60 // Number of minutes to build a trend (1440 = 24h, 720 = 12h, 60 = 1h)
},

VWAP forex Yesterday Hi/Low update fix This script is an updte fix of an earlier script that stopped functioning when TradingView updated Pine script. This script plots Forex (24 hour session) VWAP, yesterday's high, low, open and close (HLOC),
the day before's HLOC -
Also plots higher timeframe 20 emas
1 minute 5, 15, 60 period 20 ema
5 minute 15, 60 period 20 ema
15 minute 60, 120 , 240 period 20 ema
60 minute 120, 240 period 20 ema
120 minute 240, D period 20 ema
240 minute D period 20 ema
Also signals inside bars (high is less than or equal to the previous bar's high and the low is greater than or equal to the previous low) the : true inside bars have a maroon triangle below the bar as well as a ">" above the bar.
If subsequest bars are inside the last bar before the last true inside bar they also are marked with an ">"
This is probably a slight variation from the way Leaf_West plots the inside bars.
It appears that he marks all bars that are inside the original bar until one a bar has a high or low
outside the original bar. But I would need to see an example on his charts.
The Time Session Glitch and the Fix FX_IDC, COINBASE and BITSTAMP:
The script will correctly default to 1700 hrs to 1700hrs EDT/EST session for FXCM.
Strangely some securities appear to erroneously start their session at 1200 hrs ie. My guess is that they are somehow tied to GMT+0 instead of New York time (GMT+5). See this for yourself by selecting EURUSD using the FXCM exchange (FX:EURUSD) and then EURUSD from the IDC exchange (FX_IDC:EURUSD). The FX-IDC session opening range starts 5 hours before it actually should at 1700 hrs EDT/EST. To correct for this I have implemented an automatic fix (default) and a user selected "5 hour time shift adjust. ment needed on some securities".
There is also a 4 hour time shift button which might be necessary when New York reverts from Eastern Standard Time to Eastern Daylight Time (1 hour difference) in March (and then back again in November). In the default auto adjust mode you will need to select the 1 hour time shift. That is if this glitch still exists at that time.
I have looked at other scripts, other than my own and where the script is available, that need to use information about the opening bar and all have the same time shift issue
COINBASE and BITSTAMP open at 0000 hours GMT. Since I use lines instead of circles or crosses I had to make a small adjustment to plot the lines correctly.
If it needs work let me know.
Jayy

VWAP forex Yesterday Hi/Low switchThis script plots VWAP, yesterday's high, low, open and close (HLOC), the day before's HLOC -
Also plots higher timeframe 20 emas including:
1 minute 5, 15, 60 period 20 ema
5 minute 15, 60 period 20 ema
15 minute 60, 120 , 240 period 20 ema
60 minute 120, 240 period 20 ema
120 minute 240, D period 20 ema
240 minute D period 20 ema
Also signals inside bars (high is less than or equal to the previous
bar's high and the low is greater than or equal to the previous low) the : true inside bars have a maroon triangle below the bar as well as a ">" above the bar.
If subsequent bars are inside the last bar before the last true inside bar they also are marked with an ">"
If you have suggestions let me know.
Jayy

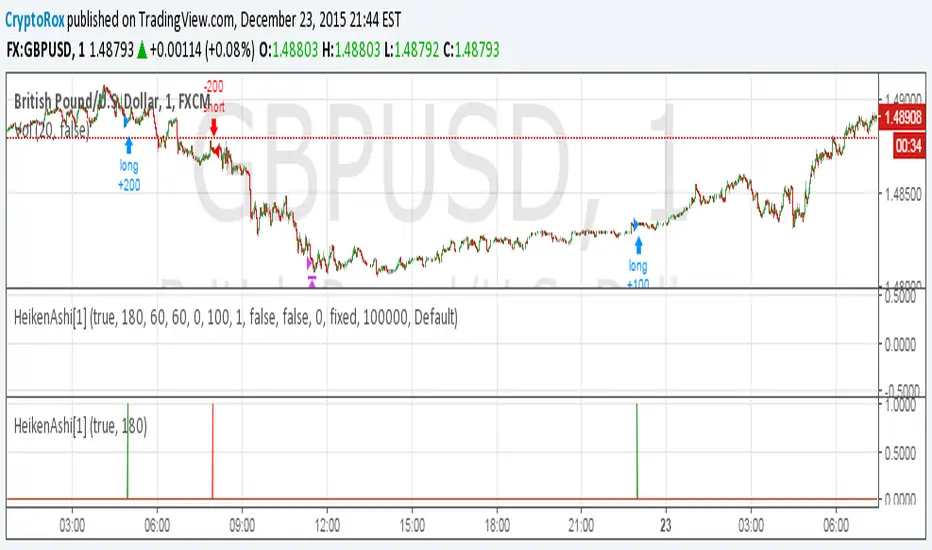
HeikenAshi[1]This is the alert script so you can automate this strategy using AutoView:
Make sure to use
crossing down value 0.9 once per bar (on condition) for this.
For the alert Message if you're using AutoView:
Long GBPUSD
c=order b=short
c=position b=short l=200 t=market
b=long q=0.01 l=200 t=market tp=60 sl=60
Short GBPUSD
c=order b=long
c=position b=long l=200 t=market
b=short q=0.01 l=200 t=market tp=60 sl=60
⭐ Silver HUD v14.6 ⭐Silver HUD v14.6 is an enhanced Pine Script v5 indicator for micro silver futures (SIL) trading on TradingView, featuring a compact 2-column bottom-right HUD with weighted scoring across 5 engines (trend, flow, momentum, PB, turbo), 2H structure arbitration, divergence detection, volume surge analysis, BUY/SELL arrows, and risk warnings. Expanded from v14.5 with dedicated DIV/VOL rows for better signal context on 5m charts.
Multi-Engine Scoring
Trend Engine
EMA20/50 alignment + VWAP direction (1.001%/0.999% thresholds): UP/DOWN/MIXED scores 100/60/20.
Flow Engine
CCIOBV (CCI20 + OBV EMA13 sync) + QQE (RSI14 smoothed with trailing volatility): dual UP/DOWN = strong flow (100), mixed (60).
Momentum
RSI14/MFI14 >55 (UP=100), <45 (DOWN=100), else NEUTRAL (60).
PB (Pullback)
EMA20 deviation: -0.4% to +1.2% = OK (100), ≥1.2% CHASE (70/40), DEEP (30/80 for long/short).
Turbo
ATR14 percentile (>70 EXPANDING, <30 FADE) + BB20 width percentile (<20 SQ): SQ+EXPANDING=BREAKOUT (100).
Weighted Totals
BUY: flow(30%)+mom(25%)+PB(25%)+trend(10%)+turbo(10%); SELL adjusts turbo(20%)/PB(15%). Thresholds: BUY≥75, SELL≥72.
Advanced Features
2H Arbitration
Swing HH/HL/LL/LH detection resolves BUY/SELL conflicts; UP (HH/HL) favors longs, DOWN (LL/LH) shorts.
Divergence
RSI-based: price HH without RSI HH = BEAR DIV; price LL without RSI LL = BULL DIV.
Volume Surge
2x 20-SMA or 80th percentile: BULL/BEAR SURGE (directional), SURGE (neutral).
Signals & Risk
Raw triggers filtered (no DEEP PB BUY, no DOWN trend BUY, UP flow required); final uses 2H tiebreaker. RISK flags DIV, surges, DEEP PB, trend conflicts, score ties. Tiny BUY/SELL arrows on raw signals.
HUD Layout
14-row table: TREND/FLOW/MOM/PB/TURBO/FINAL/BUY*/SELL*/2H/DIV/VOL/RISK/Threshold. Stars rate scores (★★★★★=90+), color-coded statuses, gold FINAL. Perfect for SIL scalpers needing confluence + risk at a glance.

Volume Pressure OscillatorThe Volume Pressure Oscillator (VPO) is a momentum-based indicator that measures the directional pressure of cumulative volume delta (CVD) combined with price efficiency. It oscillates between 0 and 100, with readings above 50 indicating net buying pressure and readings below 50 indicating net selling pressure.
The indicator is designed to identify the strength and sustainability of volume-driven trends while remaining responsive during consolidation periods.
How the Indicator Works
The VPO analyzes volume flow by examining price action at lower timeframes to build a Cumulative Volume Delta (CVD). For each chart bar, the indicator looks at intrabar price movements to classify volume as either buying volume or selling volume. These classifications are accumulated into a running total that tracks net directional volume.
The indicator then measures the momentum of this CVD over both short-term and longer-term periods, providing responsiveness to recent changes while maintaining awareness of the broader trend. These momentum readings are normalized using percentile ranking, which creates a stable 0-100 scale that works consistently across different instruments and market conditions.
A key feature is the extreme zone persistence mechanism. When the indicator enters extreme zones (above 80 or below 20), it maintains elevated readings as long as volume pressure continues in the same direction. This allows the VPO to stay in extreme zones during strong trends rather than quickly reverting to neutral, making it useful for identifying sustained volume pressure rather than just temporary spikes.
What Makes This Indicator Different
While many indicators measure volume or volume delta, the VPO specifically measures how aggressively CVD is currently changing and whether that pressure is being sustained. It's the difference between knowing "more volume has accumulated on the buy side" versus "buying pressure is intensifying right now and shows signs of continuation."
1. Focus on CVD Momentum, Not CVD Levels
Most CVD indicators display the cumulative volume delta as a line that trends up or down indefinitely. The VPO is fundamentally different - it measures the slope of CVD rather than the absolute level. This transforms CVD from an unbounded cumulative metric into a bounded 0-100 oscillator that shows the intensity and direction of current volume pressure, not just the historical accumulation.
2. Designed to Stay in Extremes During Trends
Unlike traditional oscillators that treat extreme readings (above 80 or below 20) as overbought/oversold reversal signals, the VPO is engineered to oscillate within extreme zones during strong trends. When sustained buying or selling pressure exists, the indicator remains elevated (e.g., 80-95 or 5-20) rather than quickly reverting to neutral. This makes it useful for trend continuation identification rather than exclusively for reversal trading.
3. Percentile-Based Normalization
The VPO uses percentile ranking over a lookback window, which provides consistent behavior across different instruments, timeframes, and volatility regimes without constant recalibration.
4. Dual-Timeframe Momentum Synthesis
The indicator simultaneously considers short-term CVD momentum (responsive to recent changes) and longer-term CVD momentum (tracking trend direction), weighted and combined with a slow-moving trend bias. This multi-timeframe approach helps it stay responsive in ranging markets while maintaining context during trends.
How to Use the Indicator
Understanding the Zones:
80-100 (Strong Buying Pressure): CVD momentum is strongly positive. In trending markets, the indicator oscillates within this zone rather than immediately reverting to neutral. This suggests sustained accumulation and trend continuation probability.
60-80 (Moderate Buying): Positive volume pressure but not extreme. Suitable for identifying pullback entry opportunities within uptrends.
40-60 (Neutral Zone): Volume pressure is balanced or unclear. No strong directional edge from volume. Often seen during consolidation or trend transitions.
20-40 (Moderate Selling): Negative volume pressure developing. May indicate distribution or downtrend continuation setups.
0-20 (Strong Selling Pressure): CVD momentum is strongly negative. During downtrends, sustained readings in this zone suggest continued distribution and downside follow-through probability.
Practical Applications:
Trend Confirmation: When price makes new highs/lows, check if VPO confirms with similarly elevated readings. Divergences (price making new highs while VPO fails to reach prior highs) may indicate weakening momentum.
Range Trading: During consolidation, the VPO typically oscillates between 30-70. Readings toward the low end of the range (30-40) may present accumulation opportunities, while readings at the high end (60-70) may indicate distribution zones.
Extreme Persistence: If VPO reaches 90+ or drops below 10, this indicates exceptional volume pressure. Rather than fading these extremes immediately, monitor whether the indicator stays elevated. Sustained extreme readings suggest strong trend continuation potential.
Context with Price Action: The VPO is most effective when combined with price action or other orderflow indicators. Use the indicator to gauge whether volume is confirming or contradicting.
What the Indicator Does NOT Do:
It does not provide specific entry or exit signals
It does not predict future price direction
It does not guarantee profitable trades
It should not be used as a standalone trading system
Settings Explanation
Momentum Period (Default: 14)
This parameter controls the lookback period for CVD rate-of-change calculations.
Lower values (5-10): Make the indicator more responsive to recent volume changes. Useful for shorter-term trading and more active oscillation. May produce more whipsaws in choppy markets.
Default value (14): Provides balanced responsiveness while filtering out most noise. Suitable for swing trading and daily timeframe analysis.
Higher values (20-50): Create smoother readings and focus on longer-term volume trends. Better for position trading and reducing false signals, but with slower reaction to genuine changes in volume pressure.
Important Notes:
This indicator requires intrabar data to function properly. On some instruments or timeframes where lower timeframe data is not available, the indicator may not display.
The indicator uses request.security_lower_tf() which has a limit of intrabars. On higher timeframes, this provides extensive history, but on very low timeframes (<1-minute charts), the indicator may only cover limited historical bars.
Volume data quality varies by exchange and instrument. The indicator's effectiveness depends on accurate volume reporting from the data feed.

Smart Adaptive Double Patterns [The_lurker]Smart Adaptive Double Patterns
This is an advanced technical indicator that combines two of the strongest and most renowned classical price reversal patterns:
✅ Double Bottom Pattern — a bullish reversal pattern that forms after a downtrend
✅ Double Top Pattern — a bearish reversal pattern that forms after an uptrend
The indicator does not merely detect patterns — it provides a fully integrated, intelligent system that includes:
✅ Precise quality scoring for each pattern using 5 technical criteria
✅ Automatic price target calculation at three levels (Conservative, Balanced, Aggressive)
✅ Multi-layer dynamic filtering to avoid false signals
✅ Live pattern tracking from formation to target achievement or failure
✅ Comprehensive alert system covering all possible trading scenarios
🎯 Why Is This Indicator Unique?
1️⃣ High Detection Accuracy
Unlike traditional indicators that rely on simple rules, this one applies 5 strict structural conditions to confirm pattern validity:
A clear trend must precede the pattern
High symmetry between the two bottoms or two tops
No break of critical price levels during formation
Logical spacing between key points
Technical confirmation from ADX, ATR, and Volume
2️⃣ Advanced Quality Scoring System
Each pattern is scored out of 100 based on 5 weighted criteria:
Symmetry (30%): How closely the two bottoms or tops match
Trend Strength (20%): Strength of the prior trend
Volume Behavior (20%): Trading activity at critical points
Pattern Depth (15%): Vertical distance between neckline and bottom/top
Structural Integrity (15%): Full compliance with structural rules
3️⃣ Smart Target Management
Separate targets for bullish (Double Bottom) and bearish (Double Top) patterns
Separate projections for success and failure cases
Multiple options: Conservative (0.618) / Balanced (1.0) / Aggressive (1.618)
Live tracking with dynamic moving lines
4️⃣ Professional Failure Handling
Failed patterns are not ignored — they are turned into counter-trend opportunities:
Failed Double Bottom → triggers a bearish signal with downside targets
Failed Double Top → triggers a bullish signal with upside targets
Automatic color change for clear visual distinction
5️⃣ Full Customization Flexibility
Enable/disable each pattern independently
22+ adjustable settings
Unique colors for each pattern and quality level
Full bilingual support (Arabic / English)
📐 Pattern Details
🟦 Double Bottom Pattern
Sequence of points:
🔹 Point 1: Peak marking the start of a strong downtrend
🔹 Point 2 (Bottom 1): First low — first key bounce
🔹 Point 3: Intermediate high — forms the neckline (resistance)
🔹 Point 4 (Bottom 2): Second low — should closely match Bottom 1
🔹 Point 5: Breakout point — pattern confirmation
Mandatory Conditions:
✅ Clear downtrend before Point 2
✅ Bottoms 2 & 4 nearly identical (≤1.5% difference by default)
✅ Point 3 higher than both bottoms
✅ Neither bottom is broken during formation
✅ Sufficient time between points (≥10 candles by default)
✅ Success Scenario
→ Price breaks above the neckline (Point 3)
→ Point 5 is plotted at breakout candle
→ Dashed vertical line drawn from Point 5 to target
→ Horizontal dashed line tracks price toward target
→ Dashboard shows: Pattern Type | Quality | Rating | Target | Status
→ When target hits: line turns green + ✅ appears
🎯 Target Calculation
Pattern Height = Point 3 − Point 4
• Conservative: Point 3 + (Height × 0.618 × Quality Factor)
• Balanced: Point 3 + (Height × 1.0 × Quality Factor)
• Aggressive: Point 3 + (Height × 1.618 × Quality Factor)
❌ Failure Scenario
→ Price breaks below both Bottom 1 or Bottom 2 before neckline breakout
Visual Changes:
All lines turn red
Red ✖ appears at breakdown candle
Neckline stops expanding
Red dashed vertical line from breakdown point to bearish target
Red horizontal tracking line follows price
Dashboard updates to:
⚠ Failed Bottom – Bearish
→ Shows new bearish target
→ Indicates target mode for failure case
→ Status: Bearish Reversal
→ Fully red display
🟥 Double Top Pattern
Sequence of points:
🔹 Point 1: Trough marking the start of a strong uptrend
🔹 Point 2 (Top 1): First peak — first key resistance
🔹 Point 3: Intermediate low — forms the neckline (support)
🔹 Point 4 (Top 2): Second peak — should closely match Top 1
🔹 Point 5: Breakdown point — pattern confirmation
Mandatory Conditions:
✅ Clear uptrend before Point 2
✅ Tops 2 & 4 nearly identical (≤1.5% difference by default)
✅ Point 3 lower than both tops
✅ Neither top is breached during formation
✅ Sufficient time between points (≥10 candles by default)
✅ Success Scenario
→ Price breaks below the neckline (Point 3)
→ Point 5 is plotted at breakdown candle
→ Dashed vertical line drawn to target
→ Horizontal tracking line moves with price
→ Dashboard updates accordingly
→ Green line + ✅ on hit
🎯 Target Calculation
Pattern Height = Point 4 − Point 3
• Conservative: Point 3 − (Height × 0.618 × Quality Factor)
• Balanced: Point 3 − (Height × 1.0 × Quality Factor)
• Aggressive: Point 3 − (Height × 1.618 × Quality Factor)
❌ Failure Scenario
→ Price breaks above either Top 1 or Top 2 before neckline breakdown
Visual Changes:
All lines turn cyan (light blue)
Cyan ✖ appears at breakout candle
Neckline stops expanding
Cyan dashed vertical line to bullish target
Cyan horizontal tracking line follows price
Dashboard updates to:
⚠ Failed Top – Bullish
→ Shows new bullish target
→ Indicates target mode for failure case
→ Status: Bullish Reversal
→ Fully cyan display
🎯 Upside Target (after Double Top failure)
Max Top = max(Point 2, Point 4)
Height = Max Top − Point 3
• Conservative: Max Top + (Height × 0.618)
• Balanced: Max Top + (Height × 1.0)
• Aggressive: Max Top + (Height × 1.618)
📊 Quality Scoring System (0–100)
1️⃣ Symmetry (30%)
Measures price match between the two bottoms or two tops.
High score (25–30): Near-perfect symmetry → very strong pattern
Medium (15–24): Good match → reliable signal
Low (5–14): Weak symmetry → use caution
Zero: No symmetry → invalid pattern
2️⃣ Trend Strength (20%)
Uses ADX and DI indicators.
20 pts: Strong trend confirmed (e.g., ADX ≥ 20 + correct DI alignment)
10 pts: Trend filter disabled
6 pts: Weak or sideways trend
3️⃣ Volume Behavior (20%)
Declining volume on second touch is a positive sign (shows exhaustion).
15–20 pts: Clear volume drop → strong signal
10 pts: Neutral volume
6 pts: Rising volume → higher risk of continuation
4️⃣ Pattern Depth (15%)
Deeper patterns = stronger reversals.
12–15 pts: Deep → high reversal power
8–11 pts: Medium → acceptable
<8 pts: Shallow → weak signal
5️⃣ Structural Integrity (15%)
Checks logical structure (e.g., Point 1 > Point 3 in Double Bottom).
12–15 pts: Ideal structure
8–11 pts: Minor flaws
<8 pts: Poor setup
📈 Final Quality Rating & Colors
• 85–100 → ⭐ Excellent
→ Double Bottom: Cyan #00BCD4
→ Double Top: Light Red #FF5252
• 75–84 → ✨ Very Good
• 65–74 → ✓ Good
• 60–64 → ○ Acceptable
→ All use Amber #FFC107
• <60 → ❌ Rejected (not shown)
→ Gray #9E9E9E
🔧 Dynamic Filters
1️⃣ ATR Filter (Volatility Check)
Rejects patterns in abnormally high volatility periods.
→ If current ATR > 1.8 × 50-period ATR MA → pattern rejected
✅ Recommended for crypto, small caps
❌ Optional for calm markets (gold, bonds)
2️⃣ ADX Filter (Trend Confirmation)
Ensures a real trend exists before the pattern.
→ If ADX < 14 (70% of default 20) → pattern rejected
✅ Strongly recommended (keep ON)
3️⃣ Volume Filter (Behavior Validation)
Not used to reject patterns, but strongly affects quality score.
✅ Best for liquid markets (Forex majors, large stocks)
❌ Optional for illiquid assets
⚙️ Key Settings Explained
🔘 General Settings
• Language: Arabic / English
• Show Previous Patterns: Yes / No
→ “No” keeps chart clean; “Yes” for historical review
🔘 Pattern Selection
• Enable Double Bottom: ✅ / ❌
• Enable Double Top: ✅ / ❌
→ Use combinations:
✅✅ → Full reversal scanning
✅❌ → Long setups only
❌✅ → Short setups only
❌❌ → Indicator OFF
🔘 Detection Parameters
• Pivots Left (1–20): Higher = more reliable, fewer patterns
• Pivots Right (1–20): Lower = faster signals
• Min Width (5–100): Min candles between Bottom/Top 1 & 2
• Tolerance % (0.1%–5%): Max allowed price difference
• Min Arm (5–50): Min candles between pivot & neckline
• Min Trend (5–50): Min candles in prior trend
• Trend Lookback (50–500): How far back to detect trend start
• Extension Multiplier (1.0–5.0): How long to wait for breakout
🔘 Quality Settings
• Min Quality Score (0–100):
→ Conservative: 75–85
→ Balanced: 60–70
→ Flexible: 50–55
• Custom Weights: Adjust based on market (e.g., increase Volume weight in Forex)
🔘 Target Settings
• Bottom Bullish Target: Conservative / Balanced / Aggressive
• Bottom Bearish Target: (used on failure)
• Top Bearish Target: Conservative / Balanced / Aggressive
• Top Bullish Target: (used on failure)
🔘 Visual Settings
• Label Size: Small / Normal / Large / Huge
• Pattern Colors: Fully customizable
• Table: Show/Hide + Size (Small/Normal/Large) + Position (Top-Right / Top-Left / Bottom-Right / Bottom-Left)
• Fill Transparency: 70%–95% (default: 85%)
🔔 Alert System (8 Independent Alerts)
📌 Double Bottom Alerts
Bullish Breakout → “Double Bottom Breakout – Bullish!”
Bullish Target Hit → “Bullish Target Achieved!”
Failure (Bearish) → “Double Bottom Failed – Bearish!”
Bearish Target Hit → “Bearish Target Achieved (Failure)!”
📌 Double Top Alerts
Bearish Breakdown → “Double Top Breakdown – Bearish!”
Bearish Target Hit → “Bearish Target Achieved!”
Failure (Bullish) → “Double Top Failed – Bullish!”
Bullish Target Hit → “Bullish Target Achieved (Failure)!”
Each alert can be enabled/disabled independently and supports pop-ups, emails, or webhooks.
⚠️ Disclaimer:
This indicator is for educational and analytical purposes only. It does not constitute financial, investment, or trading advice. Use it in conjunction with your own strategy and risk management. Neither TradingView nor the developer is liable for any financial decisions or losses.

Bollinger Bands HTF Hardcoded (Len 20 / Dev 2) [CHE]Bollinger Bands HTF Hardcoded (Len 20 / Dev 2) — Higher-timeframe BB emulation with bucket-based length scaling and on-chart diagnostics
Summary
This indicator emulates higher-timeframe Bollinger Bands directly on the current chart by scaling a fixed base length (20) via a timeframe-to-bucket multiplier map. It avoids cross-timeframe requests and instead applies the “HTF feel” by using a longer effective lookback on lower timeframes. Bands use the classic deviation of 2 and the original color scheme (Basis blue, Upper red, Lower green, blue fill). An on-chart table reports the resolved bucket, multiplier, and effective length.
Pine version: v6
Overlay: true
Primary outputs: Basis (SMA), Upper/Lower bands, background fill, optional info table
Motivation: Why this design?
Cross-timeframe Bollinger Bands typically rely on `request.security`, which can introduce complexity, mixed-bar alignment issues, and potential repaint paths depending on how users consume signals intrabar. This design offers a deterministic alternative: a single-series calculation on the chart timeframe, with a hardcoded “HTF emulation” achieved by scaling the BB length according to coarse higher-timeframe buckets. The result is a smoother, slower band structure on low timeframes without external timeframe calls.
What’s different vs. standard approaches?
Baseline: Standard Bollinger Bands with a fixed user length on the current timeframe, or true HTF bands via `request.security`.
Architecture differences:
Fixed base parameters: Length = 20, Deviation = 2.
Bucket mapping derived from the chart timeframe (or manually overridden).
No `request.security`; all computations occur on the current series.
Effective length is “20 × multiplier”, where multiplier approximates aggregation into the chosen bucket.
Diagnostics table for transparency (bucket, multiplier, resolved length, bandwidth).
Practical effect: On lower timeframes, the effective length becomes much larger, behaving like a higher-timeframe Bollinger structure (smoother basis and wider stability), while remaining purely local to the chart series.
How it works (technical)
The script first resolves a target bucket (“Auto” or a manual selection such as 60/240/1D/…/12M). It then computes a multiplier that approximates how many current bars fit into that bucket (e.g., 1m→60m uses mult≈60, 5m→60m uses mult≈12). The effective Bollinger length becomes:
`bb_len = 20 mult` (clamped to at least 1)
Using the effective length, it calculates:
`basis = ta.sma(src, bb_len)`
`dev = 2 ta.stdev(src, bb_len)`
`upper = basis + dev`
`lower = basis - dev`
A “bandwidth” diagnostic is also computed as `(upper-lower) / basis` (guarded against division by zero) and shown in the table as a percentage. A persistent table object is created/deleted based on the visibility toggle and updated only on the last bar for performance.
Parameter Guide
Source — Input series for the bands — Default: Close
Use close for classic behavior; smoother sources reduce responsiveness.
Bucket — HTF bucket selection — Default: Auto
Auto derives a bucket from the chart timeframe; manual selection forces the intended target bucket.
Offset — Plot offset — Default: 0
Shifts plots forward/back for visual alignment, displayed in the data window.
Table X / Table Y — Table anchor — Default: Right / Top
Places the diagnostics table in one of nine anchor points.
Table Size — Table text size — Default: Normal
Use small on dense charts, large for presentations.
Dark Mode — Table theme — Default: Enabled
Switches table palette for readability against chart background.
Show Table — Toggle diagnostics table — Default: Enabled
Disable for a cleaner chart.
Reading & Interpretation
Basis (blue): The moving average centerline of the bands (SMA of effective length).
Upper (red) / Lower (green): ±2 standard deviations around the basis using the same effective length.
Fill (blue tint): Visual band zone to quickly see compression/expansion.
Interpretation staples:
Price riding the upper band suggests strong bullish pressure; riding the lower band suggests strong bearish pressure.
Band expansion indicates rising volatility; contraction indicates volatility compression.
Mean reversion setups often key off the basis and re-entries from outside bands, while breakout/trend setups often key off sustained band rides.
Diagnostics table:
HTF Tag: Human-readable label showing the current timeframe → bucket mapping.
Bucket: The resolved target bucket (Auto result or manual selection).
Multiplier: The integer factor applied to the base length.
Len/Dev: Shows base length (20) and the effective length result plus deviation (2).
Bandwidth: Normalized width of the band (percent), useful for spotting squeezes.
Practical Workflows & Combinations
HTF context on LTF charts: Use this as “slow structure” bands on 1m–15m charts without requesting HTF data.
Squeeze detection: Watch bandwidth shrink to historically low levels, then look for break/hold outside bands.
Trend filtering: Favor long bias when price stays above the basis and repeatedly respects it; favor short bias when below.
Confluence: Combine with market structure (swing highs/lows), volume tools, or a trend filter (e.g., a longer MA) for confirmation.
Behavior, Constraints & Performance
Repaint/confirmation: No cross-timeframe requests. Values can still evolve intrabar and settle on close, as with any indicator computed on live bars.
History requirements: Very large effective lengths need sufficient historical bars; expect a warm-up period after loading or switching symbols/timeframes.
Known limits: Because the method approximates HTF behavior by scaling lookback, it is not identical to true HTF Bollinger Bands computed on aggregated candles. In particular, volatility and mean can differ slightly versus a real HTF series.
Sensible Defaults & Quick Tuning
Default workflow:
Bucket: Auto
Source: Close
Table: On (until you trust the mapping), then optionally off
If bands feel too slow on your timeframe: choose a smaller bucket (e.g., 60 instead of 240).
If bands feel too reactive/noisy: choose a larger bucket (e.g., 1D or 3D).
If chart looks cluttered: hide the table; keep only the bands and fill.
What this indicator is—and isn’t
This is a Bollinger Band visualization layer that emulates higher-timeframe “slowness” via deterministic length scaling. It is not a complete trading system and does not include entries, exits, sizing, or risk management. Use it as context alongside your execution rules and protective stops.
Disclaimer
The content provided, including all code and materials, is strictly for educational and informational purposes only. It is not intended as, and should not be interpreted as, financial advice, a recommendation to buy or sell any financial instrument, or an offer of any financial product or service. All strategies, tools, and examples discussed are provided for illustrative purposes to demonstrate coding techniques and the functionality of Pine Script within a trading context.
Any results from strategies or tools provided are hypothetical, and past performance is not indicative of future results. Trading and investing involve high risk, including the potential loss of principal, and may not be suitable for all individuals. Before making any trading decisions, please consult with a qualified financial professional to understand the risks involved.
By using this script, you acknowledge and agree that any trading decisions are made solely at your discretion and risk.
Do not use this indicator on Heikin-Ashi, Renko, Kagi, Point-and-Figure, or Range charts, as these chart types can produce unrealistic results for signal markers and alerts.
Best regards and happy trading
Chervolino.
