[LunaOwl] 智慧型RSI (Smart RSI - a handy tool with less noise)Relative Strength Index is a common technical analysis tool, it is classified as a momentum oscillator, measuring the velocity and magnitude of directional price movements. it is most typically used on a 14-period timeframe, measured on a scale from 0 to 100, with high and low levels marked at 70 and 30.
相對強弱指標是常見的技術分析工具,它被歸類為動量振盪器,用於測量定向價格運動的速度和幅度,通常會使用14期數,擺盪範圍在0到100間,超買超賣分別標記成70、30。
after simple improvement and addition of logical judgment, it becomes a passive judge from subjective judgments, avoid the shortcomings of peoples in watching passivation, and the trade can be more consistent.
經過簡單的改良與添加邏輯判斷,能夠使RSI指標的使用,從主觀的判斷成為被動的確認指標,有效避免人們判斷指標鈍化的主觀缺失,並能夠使得交易更加一致。
--------------------------*
1) parameter
RSI period 1 - default is 14, same as general RSI.
RSI period 2 - default is 5, due to its own formula, the amplitude of the oscillator will become larger and more agile or fast. When the parameter is small.
exponential moving avg of RSI - using the result of RSI period 1 as the source of Ema's formula, the default length is 14, which can filter the excessive agility of RSI period 2 to reduce noise, and compared to using the baseline as the criterion for long and short judgments, The characteristics of exponential moving avg are more suitable to become flexible filtering standards.
Overbought - default is 70, you can set your overbought level.
Oversold - same as above, the default is 30.
2) Options
Open Candle color(開啟蠟燭線趨勢) - choose whether to start the color of the candle.
Open background color(開啟指標背景色) - the default is false, you can turn on.
--------------------------*
1. 設置參數
RSI期數1:預設值是14,是普通的RSI指標。
RSI期數2:預設值是5,由於RSI公式的算法,造成參數愈小擺盪幅度就會變大,反應比較快。
指數平均化的RSI期數1:將RSI期數1的結果帶入指數移動平均公式,預設值14,它能過濾RSI期數2過度敏捷的缺點,減少雜訊,相較於單純使用基準線作為多空判斷標準,用EMA的判斷標準更加因時制宜。
超買線:預設值是70,可以隨意調。
超賣線:預設值是30,一樣的。
2. 設定選項
開啟蠟燭線趨勢:顧名思義。已經幫您開好了。
開啟指標背景色:顏色太淺的話可以調深一點。
--------------------------*
ver.2- adjust new style design and create two options.
修改2: 調整新的樣式設計與建立兩個選項。
--------------------------*
ver.3- Create alert condition. maybe I should refer to the Alert Creation Framework,
there is also room for improvement.
修改3: 建立快訊選項。我應該參考警報創建框架,還有進步空間。
--------------------------*
Indicator Style - 指標樣式
The design uses casual light color style, light gray between overbought and oversold.
--------------------------*
Market Example - 市場範例
1. Bitcoin/Tether, Binance, 1 day
2. Bitcoin/USD, Coinbase, 4 hour
3. EUR/USD, Forex Market, 4 hour
4. GBP/USD, Forex Market, 30 min
5. TAIEX, Taiwan SE Weighted Index, 1 week
--------------------------*
postscript - 後記感想
The purpose of publishing Chinese Scripts is to make Pine close to more Chinese user.
I hope English skills enhancement...staggered writing makes me feel hard.
發布中文腳本的目的,是希望可以讓 Pine 親近更多中文圈的使用者。希望我的英語進步,中英文交錯撰寫有一些困難。
--------------------------*
If you find my works useful, you can give me encouragement. I can buy more books to sophisticated themselves.
如果您發現我的作品有用,可以給我鼓勵。讓我可以買更多書籍來精進自己。
在脚本中搜索"收集一只股票30个交易日的成交量、开盘价、最高价和最低价和收盘价"

MacD (Future Known or Unknown) StrategyThis indicator/strategy is to be used as a way to baseline the top potential any strategy could have with other strategies and indicators.
What I have created literally shows the BEST moves possible you could have made in my opinion for SHORTING or LONGING using only the MacD values of the 4 hour while on the 30 minute chart.
To use this, try checking out XBTUSD on the 30 minute chart . It will work under different time frames but works best on the 30 minute chart in my opinion. It WILL NOT WORK Above 2 hours time frame.
DO NOT TRADE WITH THIS indicator . I can't emphasize this enough. These results only work because of the lookahead_on parameter. A lot of scam indicators and strategies use this to trick people on tradingView into buying their scripts.
This code is OPEN SOURCE and as such there is nothing to hide and no scam!
I like to use this as a comparison tool for how good I 'could' have traded and at what points those were. By knowing where the perfect trading positions are, you can create real indicators and scripts that try to find patterns in those positions.
This also shows that IF you could know the direction the MacD was going what amazing results you could get ^_~.
This is meant purely for entertainment purposes and for comparing against your own scripts.
I've included the options in the settings to allow ONLY LONG or ONLY SHORTS. By default it attempts both buy attempts. You can also change your starting ($) amount and commission percentage that is taken per trade as well.
Also included in the options is the ability to set the back testing time frame to see how it performs during just certain time periods.
Finally a color explanation
Red - MacD 4 hour going down
Green - MacD 4 hour going up
Purple - MacD 4 hour going down (from an up position)
Yellow - MacD 4 hour going up (from a down position)
Notice the program will always buy right before it turns into a yellow color since it knows the future.
In the options you can turn off 'use the future' to see the horrible results if you trade the moment you know which direction the MacD 4 hour is actually going. I will revise this script in the future with attempts to work without knowing the future as play options to get better results.
If you have any questions or comments, please do not hesitate to ask!

(JS)DMI BarsAlright - so this is my own version of John Carter's "10x Bars"... I have done multiple things that are different from his version so they are slightly different..
So first of all the main indicator is based off of the ADX and the DMI;
For those who aren't familiar with it, Directional Movement is what you'd pull up under "built-in's" from the indicators tab (if you want to check it out).
The standard interpretation of this however, is when the ADX is above 20 that suggests the trend is strong, whereas under 20 suggests it is weak.
Also, when the D+ is above the D- that suggests a bullish trend, and D- above D+ suggests a bearish trend.
These bars take away the need to have it at the bottom of your screen, and places the data on the bars on your chart instead.
=========================================================================================================================================
So here's what the colors stand for -
Yellow - The ADX is under 20, no strength in trend
Shades of green occur when the ADX is above 20 and there's a bullish trend (D+ higher than D-)
Bright Green (Lime) - Bullish trend, D+ above 30
Green - Bullish Trend
Yellow Green - Bullish trend, D+ below 15
Shades of red occur when the ADX is above 20 and there's a bearish trend (D- higher than D+)
Bright Red - Bearish trend, D- above 30
Red - Bearish Trend
Orange - Bearish trend, D- below 15
=========================================================================================================================================
I have also added multiple time frame labels (label script used is the one created by Ricardo Santos)
These labels are color coded the same as the bars/candles, and they appear off to the right of your screen using every built in time increment from TradingView.
The purpose is to show you in real time, and on any chart resolution, what the current trend is on every individual time frame.
So using just one single chart you'll see your current resolutions candles, but also on the labels you'll see:
1 Minute
3 Minute
5 Minute
15 Minute
30 Minute
45 Minute
1 Hour
2 Hour
3 Hour
4 Hour
Daily
Weekly
Monthly
There is an input I added that allows you to adjust where your labels appear on the side of your screen as well!
=========================================================================================================================================
Now onto the volume spike portion of the indicator. This will plot a blue dot under each bar that has a spike in volume which meets your specified criteria.
I have 500% as the default setting.
What that means is that this indicator looks back and gets the 50 bar volume average and then applies dots where volume is 500% above average.
=========================================================================================================================================
Now finally, the reversal arrows. This is another simple to understand concept that I first read in John Carter's book "Mastering the Trade" that he calls "HOLP/LOHP".
I have added the ability to change the look back period you'd like the indicator to watch for highs and lows on.
What that stands for is 'High of Low Period' and 'Low of High Period', and it is used like this-
Whenever a bar makes a new high the indicator watches the low on that highest bar. Then when a bar afterwards makes a lower low then the one on the high bar,
a reversal arrow is given. Apply this same concept in the other direction in for the highs on the lowest bars.
=========================================================================================================================================
Now, I didn't want to make a "set" or have a bunch of different indicators out there that are all intended for the same package, so I took the time to put them together,
and if there's a part of it you don't care for they can easily be turned off in the settings.
Enjoy!

ADX +- DiThis Adx +-Di is just a complete version of what the ADX is supposed to signal.
So you have:
15 (contraction), 20 (threshold), 30 (expansion), 40 (resistance) levels.
Below 20 the price is not trending
Above 30 the price is trending
Below 15 price has been in contraction for too long
Between 20 and 30 price is in a "transition zone".
I finally added a "Resistance" level (40), which has to be adapted to best represent the historical levels where price usually encounters resistance, and where the price can be declared "overtrending", which means a return to lower levels is likely to happen.
I've chosen mild colors, and set the Adx Color to White, because I use black background, you can easily change that.
Enjoy
-Maurice

ICHIMOKU MTFMultiple Time Frame Version of Ichimoku Kinko Hyo Indicator.
Created in 1940's by Goichi Hosoda withe the help of University students in Japan.
Ichimoku is one of the best trend following indicators that works nearly perfect in all markets and time frames.
Ichimoku is originally an built in indicator in Tradingview but there are some problems like:
the indicator hast 5 lines but you can change only 4 parameters in the settings menu of Tradingview Charts which you could only control 3 of the lines effectively. A second problem is that Tradingview preferred to use English titles for the ICHIMOKU lines instead of giving them the most common original Japanese ones. (So I rewrite the indicator)
Kijun Sen (blue line): Also called standard line or base line, this is calculated by averaging the highest high and the lowest low for the past 26 periods.
Tenkan Sen (red line): This is also known as the turning line and is derived by averaging the highest high and the lowest low for the past nine periods.
Chikou Span (Plum line): This is called the lagging line. It is today’s closing price plotted 26 periods behind.
Senkou SpanA (green line): The first Senkou line is calculated by averaging the Tenkan Sen and the Kijun Sen and plotted 26 periods ahead.
Senkou SpanB (purple line):
The second Senkou line is determined by averaging the highest high and the lowest low for the past 52 periods and plotted 26 periods ahead.
PERSONALLY I ADVISE YOU TO USE ICHIMOKU WITH DEAFULT LENGTHS (9,26,26,52,26) IN ORDER FOR STOCK MARKETS AND FOREX MARKETS
FOR CRYPTO YOU'D BETTER USE:
10,30,30,60,30 OR 20,60,60,120,60
THE TRICKY THING IS THAT KEEPING THE 1-3-3-6-3 RATIO CONSTANT IS NECESSARY
Here's a link of my Youtube video explaining ICHIMOKU but unfortunately only in TURKISH:
www.youtube.com
Developed by: Goichi Hosoda
Here's the link to a complete list of all my indicators:
tr.tradingview.com
Ichimoku kullanımı anlattığım detaylı video serisini linkten izleyebilirsiniz:
www.youtube.com
İndikatörü geliştiren: Goichi Hosoda

ICHIMOKU Kinko Hyo by KIVANC fr3762Created in 1940's by Goichi Hosoda withe the help of University students in Japan.
Ichimoku is one of the best trend following indicators that works nearly perfect in all markets and time frames.
Ichimoku is originally an built in indicator in Tradingview but there are some problems like:
the indicator hast 5 lines but you can change only 4 parameters in the settings menu of Tradingview Charts which you could only control 3 of the lines effectively. A second problem is that Tradingview preferred to use English titles for the ICHIMOKU lines instead of giving them the most common original Japanese ones. (So I rewrite the indicator)
Kijun Sen (blue line): Also called standard line or base line, this is calculated by averaging the highest high and the lowest low for the past 26 periods.
Tenkan Sen (red line): This is also known as the turning line and is derived by averaging the highest high and the lowest low for the past nine periods.
Chikou Span (Plum line): This is called the lagging line. It is today’s closing price plotted 26 periods behind.
Senkou SpanA (green line): The first Senkou line is calculated by averaging the Tenkan Sen and the Kijun Sen and plotted 26 periods ahead.
Senkou SpanB (purple line):
The second Senkou line is determined by averaging the highest high and the lowest low for the past 52 periods and plotted 26 periods ahead.
PERSONALLY I ADVISE YOU TO USE ICHIMOKU WITH DEAFULT LENGTHS (9,26,26,52,26) IN ORDER FOR STOCK MARKETS AND FOREX MARKETS
FOR CRYPTO YOU'D BETTER USE:
10,30,30,60,30 OR 20,60,60,120,60
THE TRICKY THING IS THAT KEEPING THE 1-3-3-6-3 RATIO CONSTANT IS NECESSARY
Here's a link of my Youtube video explaining ICHIMOKU but unfortunately only in TURKISH:
www.youtube.com
Developed by: Goichi Hosoda

RSI Multi-TimeframeThe Relative Strength Index (RSI) is an extremely useful oscillating momentum indicator that was developed by J. Welles Wilder and is one of the most widely used indicators in technical analysis.
HOW IS IT USED ?
In the classic view, a security is thought to be overbought when its RSI reading is above 70 and oversold when its RSI reading falls below 30. This makes it a good indicator for mean-reversion systems. Wilder recommended using the 70 and 30 levels as overbought and oversold levels respectively. When the RSI moves up over the 30 line it is considered a possible bullish reversal while a move down below the 70 line is considered a possible bearish reversal.
When the RSI is above 70 it is a potential exit signal if you are in a long position and when it is below 30 it is a potential exit signal if you are in a short position. Some traders use extreme readings for entry points in the direction of the long-term trend. Thus, if the long-term trend is bullish, then you'd wait for the RSI to reach oversold territory, which would be a potential entry point for a long position. Conversely, if the long-term trend is bearish, then overbought conditions could be a potential point to short the security.
I added the possibility to add on the chart a 2nd timeframe for confirmation.
If you found this script useful, a tip is always welcome... :)

Ichimoku Cloud w/SelIchimoku Cloud with selection for:
Regular:
conversionPeriods = 9,
basePeriods = 26
laggingSpan2Periods = 52,
displacement = 26
Crypto:
conversionPeriods = 10,
basePeriods = 30,
laggingSpan2Periods = 60,
displacement = 30
Crypto Doubled:
conversionPeriods = 20,
basePeriods = 60,
laggingSpan2Periods = 120,
displacement = 30

CM_Ultimate RSI Multi Time FrameAvailable Options on Inputs Tab!!!
RSI with ability to change first RSI to a different Time Frame.(Defaults To Current Chart Time Frame).
Ability To Turn On/Off Background Highlighting if First RSI is Above/Below 70 or 30 Lines.
Ability To Turn On/Off Background Highlighting When First RSI Crosses Above 30 Or Below 70.
Ability To Turn On/Off "B" Or "S" When First RSI Crosses Above 30 Or Below 70.
Ability To Turn On/Off Mid -Line Plot.
Option To Plot 2nd RSI to show different Time Frames on same chart!!!
Ability To Use Different Look Back Period If You Plot 2nd RSI.

Opening Range Breakout with 2 Profit Targets.Opening Range Breakout with 2 Profit Targets.
Updated Indicator now works on all Symbols with Many Different Session Options.
***Known PineScript Issue…While the Opening Range is being Formed the lines only adjust for that individual bar. Just reset Indicator after Opening Range Completes.
***All Times are Based on New York Time
Session Options Forex U.S. Banks Open (8:00), Gold U.S. Open (8:20), Oil U.S. Open (9:00), U.S. Cash Session - Stocks (9:30), NY Forex Open (17:00) , Europe Open (02:00), or if you choose Setting 0 the Session Runs from 00:00 to 00:00 (Midnight to Midnight).
***Ability to use 60 minute Opening Range, 30 minute, 15 minute, and many other options.
***However you can manually change the times in the Inputs Tab to adjust for any session you prefer. This is useful for Day Light Savings Adjustments. Also the default times work if your charts are set to EST Time. If you use A different time zone in your settings you need to Adjust the times in the inputs tab.
Initially Opening Range High and Low plot as Yellow Lines. If Price Goes Above Opening Range then Line Turns Green. If Price Goes Below Opening Range Line Turns Red.
By default the First Profit Target is 1/2 the Width of the Opening Range and the 2nd Profit Target is 1 Times the Opening Range. However these are Adjustable in the Inputs Tab.
By Default the Opening Range Length is 1 Hour. However, you can Change the Opening Range Length to 15 min, 30 min, 2 hours etc. in the Inputs Tab.
Plots a 1 Above or Below Candle when 1st Profit Target is Achieved, and a 2 when 2nd Profit Target is Achieved.

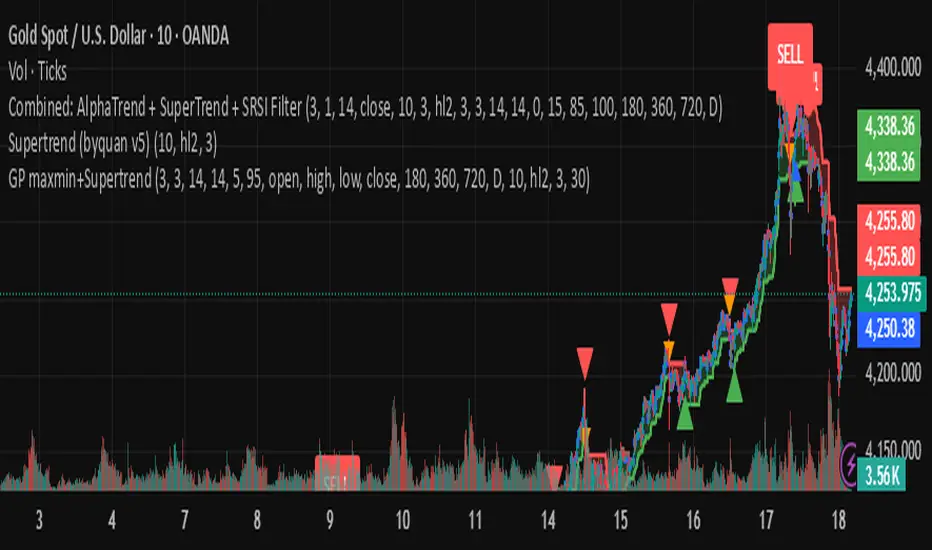
byquan GP maxmin+Supertrend🔍 Overview
The GP MaxMin + Supertrend indicator is an advanced trend-following tool that combines the power of the Supertrend indicator with a multi-timeframe Stochastic RSI (SRSI) filter.
It aims to generate high-confidence buy and sell signals by confirming Supertrend breakouts only when the market’s momentum (based on SRSI) supports them.
In other words:
Supertrend gives you trend direction,
and SRSI ensures you only trade when the market is ready to move.
⚙️ How It Works
The indicator operates in three main layers:
1. SRSI Channel Analysis
It calculates Stochastic RSI values on four price sources:
Open
High
Low
Close
From these, it extracts both minimum (oversold) and maximum (overbought) SRSI readings.
To make the signal more robust, the script collects SRSI data from four different timeframes:
3 hours (180 minutes)
6 hours (360 minutes)
12 hours (720 minutes)
1 day
These multi-timeframe readings are averaged and normalized between 0 and 100.
Key thresholds:
Below 5 → Oversold zone (potential BUY zone)
Above 95 → Overbought zone (potential SELL zone)
2. Supertrend Core
The indicator uses a standard Supertrend logic:
ATR Period: 10
ATR Multiplier: 3.0
It dynamically plots the Supertrend line that shifts between bullish and bearish zones.
When the price crosses the Supertrend line, a trend change is detected:
From bearish to bullish → Buy signal
From bullish to bearish → Sell signal
3. SRSI-Based Signal Filtering
To avoid false breakouts, the Supertrend signals are filtered through the SRSI logic.
Here’s how it works:
When the market becomes oversold, the script records that event.
If a Supertrend Buy signal appears within a certain number of bars (default = 30) after that oversold event → the signal is validated.
The same applies for Sell signals after an overbought event.
This creates a smart “confirmation window,” ensuring that only those Supertrend signals that align with market momentum are displayed.
🧭 How to Use It
✅ Step 1: Add to Your Chart
Copy and paste the script into a new Pine Script editor window in TradingView, then click “Add to chart.”
✅ Step 2: Configure Parameters
SRSI Settings
K, D, RSI Length, S Length: Standard SRSI parameters.
Alert Min Level and Alert Max Level: Define overbought/oversold zones (default 5 and 95).
Timeframes: You can adjust the four MTF levels if you want faster or slower momentum confirmation.
Supertrend Settings
ATR Period: A higher value smooths the trend.
ATR Multiplier: Controls signal sensitivity (lower = more signals, higher = fewer).
Filter Settings
Signal Filter Window: Defines how long after an overbought/oversold event a Supertrend signal remains valid (default = 30 bars).
✅ Step 3: Interpret Signals
Signal Type Condition Interpretation
Buy Supertrend flips to bullish and SRSI was recently oversold Start of an uptrend
Sell Supertrend flips to bearish and SRSI was recently overbought Start of a downtrend
Each signal is marked on the chart:
🟢 Green “Buy” label → potential long entry
🔴 Red “Sell” label → potential short entry
You can also enable or disable background highlighting to visually track bullish/bearish zones.
✅ Step 4: Set Alerts
You can create alerts using the built-in alert condition:
SRSI-Filtered SuperTrend Signal Triggered!
This triggers whenever a filtered Buy or Sell signal appears.
💡 Trading Tips
Combine this indicator with price action or volume confirmation for best results.
Adjust the filter window to fit your preferred timeframe (short-term vs swing trading).
Avoid trading against higher-timeframe Supertrend direction.
⚖️ Advantages
✅ Filters out false Supertrend signals
✅ Uses multi-timeframe momentum confirmation
✅ Clean visual layout with clear entry markers
✅ Supports alerts for automation or notifications
⚠️ Limitations
⚠️ The indicator is computationally heavy due to multi-timeframe requests.
⚠️ It’s a confirmation tool — not a standalone strategy.
⚠️ Results depend on correct parameter tuning for your market and timeframe.
📈 Summary
The GP MaxMin + Supertrend is a hybrid indicator that blends trend detection with momentum filtering.
It helps traders:
Avoid false breakouts
Enter trades at better timing
Stay aligned with both trend and momentum
Perfect for swing traders, crypto traders, and anyone who wants cleaner Supertrend signals with deeper confirmation logic.
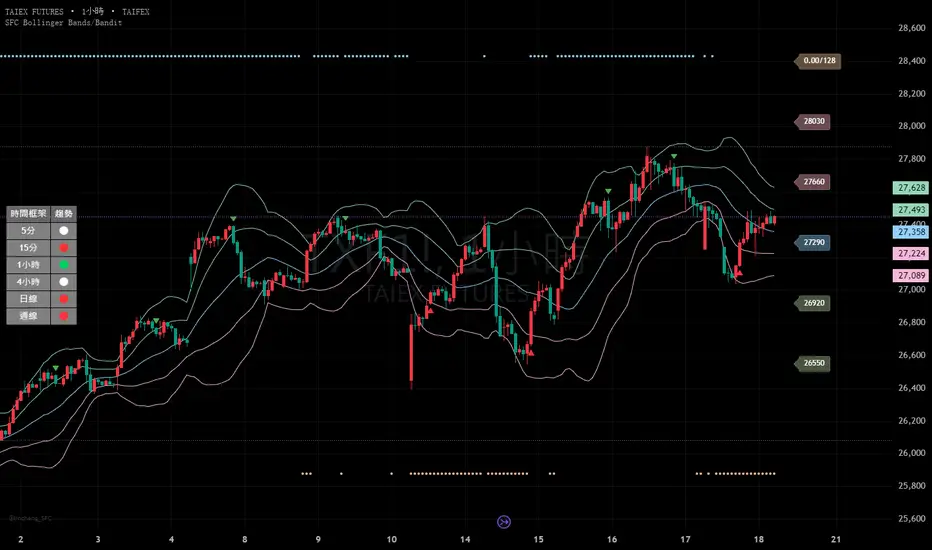
SFC Bollinger Band and Bandit概述 (Overview)
SFC 布林通道與海盜策略 (SFC Bollinger Band and Bandit Strategy) 是一個基於 Pine Script™ v6 的技術分析指標,結合布林通道 (Bollinger Bands)、移動平均線 (Moving Averages) 以及布林海盜 (Bollinger Bandit) 交易策略,旨在為交易者提供多時間框架的趨勢分析與進出場訊號。該腳本支援風險管理功能,並提供視覺化圖表與交易訊號提示,適用於多種金融市場。
This script, written in Pine Script™ v6, combines Bollinger Bands, Moving Averages, and the Bollinger Bandit strategy to provide traders with multi-timeframe trend analysis and entry/exit signals. It includes risk management features and visualizes data through charts and trading signals, suitable for various financial markets.
功能特點 (Key Features)
布林通道 (Bollinger Bands)
提供可調整的標準差參數 (σ1, σ2),支援多層布林通道顯示。
進場訊號基於價格穿越布林通道上下軌,並結合連續K線確認機制。
Provides adjustable standard deviation parameters (σ1, σ2) for multi-layer Bollinger Bands display.
Entry signals are based on price crossing the upper/lower bands, combined with a consecutive bar confirmation mechanism.
移動平均線 (Moving Averages)
支援簡單移動平均線 (SMA) 或指數移動平均線 (EMA),可自訂快、中、慢線週期。
Supports Simple Moving Average (SMA) or Exponential Moving Average (EMA) with customizable fast, medium, and slow line periods.
布林海盜策略 (Bollinger Bandit Strategy)
基於變動率 (ROC) 與布林通道動態止損,提供做多與做空訊號。
包含動態止損均線與平倉天數設定,增強交易靈活性。
Utilizes Rate of Change (ROC) and Bollinger Bands with dynamic stop-loss for long and short signals.
Includes dynamic stop-loss moving average and liquidation days for enhanced trading flexibility.
多時間框架分析 (Multi-Timeframe Analysis)
支援六個時間框架 (5分、15分、1小時、4小時、日線、週線) 的趨勢分析。
通過表格顯示各時間框架的連續上漲/下跌趨勢,輔助交易決策。
Supports trend analysis across six timeframes (5m, 15m, 1h, 4h, daily, weekly).
Displays consecutive up/down trends in a table to aid decision-making.
風險管理 (Risk Management)
提供基於 ATR 或布林通道的停利/停損設定。
自動計算交易手數,根據報價貨幣匯率調整風險敞口。
Offers take-profit/stop-loss settings based on ATR or Bollinger Bands.
Automatically calculates trading lots, adjusting risk exposure based on quote currency exchange rates.
視覺化與提示 (Visualization and Alerts)
繪製布林通道、移動平均線、海盜策略動態止損線及交易訊號。
提供多時間框架趨勢表格、交易手數標籤及浮水印。
支援交易訊號快訊,方便即時監控。
Plots Bollinger Bands, Moving Averages, Bandit strategy stop-loss lines, and trading signals.
Includes multi-timeframe trend tables, trading lot labels, and watermark.
Supports alert conditions for real-time trade monitoring.
使用說明 (Usage Instructions)
設置參數 (Parameter Setup)
布林通道 (Bollinger Bands): 可調整週期 (預設21)、標準差 (σ1=1, σ2=2) 及停利/停損依據 (ATR 或 BAND)。
移動平均線 (Moving Averages): 可選擇顯示快線 (10)、中線 (20)、慢線 (60),並切換 SMA/EMA。
布林海盜 (Bollinger Bandit): 調整通道週期 (50)、平倉均線週期 (50) 及 ROC 週期 (30)。
時間框架 (Timeframes): 自訂六個時間框架,預設為 5分、15分、1小時、4小時、日線、週線。
Adjust Bollinger Band period (default 21), standard deviations (σ1=1, σ2=2), and take-profit/stop-loss basis (ATR or BAND).
Configure Moving Averages (fast=10, medium=20, slow=60) and toggle SMA/EMA.
Set Bollinger Bandit parameters: channel period (50), liquidation MA period (50), ROC period (30).
Customize six timeframes (default: 5m, 15m, 1h, 4h, daily, weekly).
交易訊號 (Trading Signals)
買入訊號 (Buy): 價格穿越下軌且滿足連續K線條件。
賣出訊號 (Sell): 價格穿越上軌且滿足連續K線條件。
海盜策略訊號: 基於 ROC 與布林通道穿越,結合動態止損。
Buy signal: Price crosses below lower band with consecutive bar confirmation.
Sell signal: Price crosses above upper band with consecutive bar confirmation.
Bandit strategy signals: Based on ROC and band crossings with dynamic stop-loss.
視覺化 (Visualization)
布林通道以不同顏色顯示上下軌與中軌。
移動平均線以快、中、慢線區分顏色。
趨勢表格顯示各時間框架的趨勢狀態 (🔴上漲, 🟢下跌, ⚪中性)。
海盜策略顯示動態止損線與交易狀態。
Bollinger Bands display upper, lower, and middle bands in distinct colors.
Moving Averages use different colors for fast, medium, and slow lines.
Trend table shows timeframe trends (🔴 up, 🟢 down, ⚪ neutral).
Bandit strategy displays dynamic stop-loss and trading status.
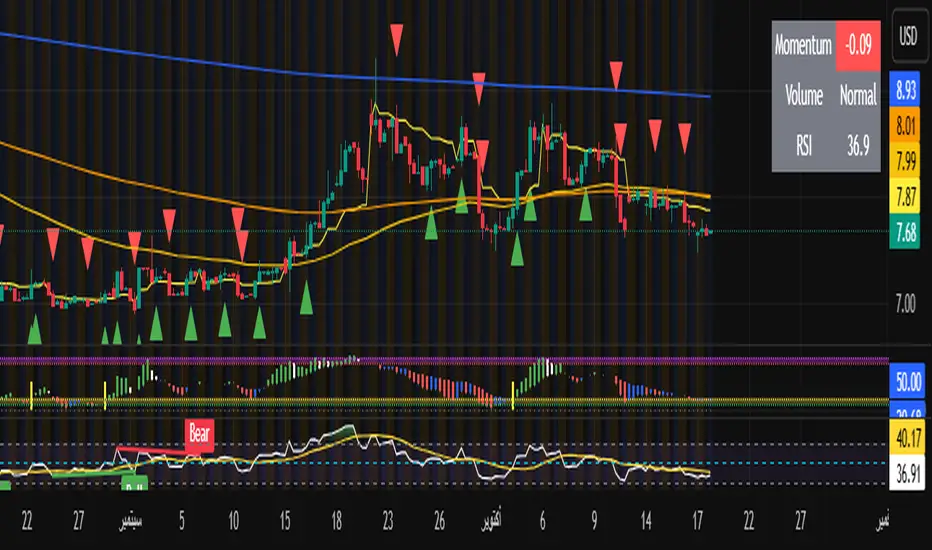
High Momentum Entry//@version=5
indicator("High Momentum Entry", overlay=true)
// Settings
momentum_period = input.int(5, "Momentum Period")
volume_multiplier = input.float(1.3, "Volume Multiplier", minval=1.0, maxval=3.0)
rsi_period = input.int(14, "RSI Period")
// Calculate Momentum
momentum = ta.mom(close, momentum_period)
momentum_ma = ta.sma(momentum, 3)
// Volume Surge
avg_volume = ta.sma(volume, 20)
high_volume = volume > avg_volume * volume_multiplier
// RSI for confirmation
rsi = ta.rsi(close, rsi_period)
// Price Movement
price_rising = close > close
price_falling = close < close
// High Momentum Buy
momentum_positive = momentum > 0
momentum_increasing = momentum > momentum
momentum_strong = momentum > momentum_ma
rsi_good_buy = rsi > 40 and rsi < 70
high_momentum_buy = momentum_positive and momentum_increasing and momentum_strong and high_volume and price_rising and rsi_good_buy
// High Momentum Sell
momentum_negative = momentum < 0
momentum_decreasing = momentum < momentum
momentum_weak = momentum < momentum_ma
rsi_good_sell = rsi > 30 and rsi < 60
high_momentum_sell = momentum_negative and momentum_decreasing and momentum_weak and high_volume and price_falling and rsi_good_sell
// Plot Signals
plotshape(high_momentum_buy, title="Buy Signal", location=location.belowbar, color=color.new(color.green, 0), style=shape.triangleup, size=size.small, text="")
plotshape(high_momentum_sell, title="Sell Signal", location=location.abovebar, color=color.new(color.red, 0), style=shape.triangledown, size=size.small, text="")
// Background for high volume
bgcolor(high_volume ? color.new(color.blue, 95) : na, title="High Volume")
// Simple Info Table
var table info = table.new(position.top_right, 2, 3)
if barstate.islast
table.cell(info, 0, 0, "Momentum", bgcolor=color.gray, text_color=color.white)
mom_color = momentum > 0 ? color.green : color.red
table.cell(info, 1, 0, str.tostring(math.round(momentum, 2)), bgcolor=mom_color, text_color=color.white)
table.cell(info, 0, 1, "Volume", bgcolor=color.gray, text_color=color.white)
vol_color = high_volume ? color.orange : color.gray
table.cell(info, 1, 1, high_volume ? "HIGH" : "Normal", bgcolor=vol_color, text_color=color.white)
table.cell(info, 0, 2, "RSI", bgcolor=color.gray, text_color=color.white)
rsi_color = rsi < 30 ? color.green : rsi > 70 ? color.red : color.gray
table.cell(info, 1, 2, str.tostring(math.round(rsi, 1)), bgcolor=rsi_color, text_color=color.white)
// Alerts
alertcondition(high_momentum_buy, "High Momentum Entry", "Strong Bullish Momentum")
alertcondition(high_momentum_sell, "High Momentum Exit", "Strong Bearish Momentum")
Ripster Labels + Air Gaps (v6)What it shows (on one chart)
EMA Clouds (current timeframe)
Plots EMA 8/12/21/34/50/200 with three cloud fills:
12–21 = “fast” cloud
34–50 = “mid” cloud
50–200 = “base” cloud
Cloud color: green when the faster EMA is above the slower (bullish), red/maroon/orange when below (bearish).
Toggle lines vs. clouds via A) EMA Clouds settings.
MTF Rails (higher-TF EMAs)
For three higher timeframes (defaults 30m / 60m / 240m), draws two EMAs each (defaults 34 & 50).
These are stepline-like rails you can visually use as higher-TF supports/resistances.
Configure in B) MTF Rails (turn on/off, change TFs/lengths/colors).
Relative Volume Box (RVol)
Small table (top-center) showing:
Candle Vol (formatted K/M/B if enabled)
RVol = current bar volume / SMA 20 of volume (as a %)
Color scale: blue (<100%), yellow (100–150%), red (>150%).
Settings in C) RVol Box.
DTR vs ATR Box
Daily True Range (DTR = day high − day low) vs ATR(14) on the daily timeframe, with DTR as % of ATR.
Placed at top-right; toggle in D) DTR/ATR Box.
Ripster Trend Label (10m 12/50)
Looks at a separate timeframe (default 10m): EMA 12 vs EMA 50.
Bottom-right table cell shows “10m Trend ↑/↓/Sideways” (green/red/gray).
Configure in E) Ripster Trend Labels (TF and lengths).
Air Gaps (single EMA per TF)
Three horizontal, auto-extending lines showing an EMA from 30m / 60m / 240m (default length 12).
“Air gaps” are the price spaces between these lines—often lighter-resistance zones for price.
Start point logic:
All Bars = draw from the chart’s left
Start of Day = draw from today’s first bar
Bars Offset = draw from N bars back (default 100)
Settings in F) Air Gaps (TFs, length, draw-from, bars-back).
Inputs & where to tweak
A) EMA Clouds
Show EMA Clouds: master toggle
Source: close (default)
Lengths: 8/12/21/34/50/200
Show EMA lines: toggle plotted lines (clouds remain)
B) MTF Rails
Show MTF Rails
TF1/TF2/TF3 (defaults 30/60/240)
EMA A/B (defaults 34/50)
C) RVol Box
Show box
Format as K/M/B: K=1e3, M=1e6, B=1e9
D) DTR/ATR Box
Show DTR/ATR
ATR len: default 14 (daily)
E) Ripster Trend Labels
Show labels
Trend TF: default 10 (10-minute)
Trend EMA Fast/Slow: default 12/50
F) Air Gaps
Show Air Gap lines
TF1/TF2/TF3 (30/60/240)
EMA length: default 12
Draw from: All Bars | Start of Day | Bars Offset
Bars back: used if Draw from = Bars Offset
How it makes decisions
Cloud bias = sign of (faster EMA − slower EMA) for each cloud pair.
Example: 12>21 → fast cloud is bullish (green); 34>50 → mid cloud bullish (teal).
10m trend label = sign of (EMA12−EMA50) on the Trend TF (default 10m).
RVol = volume / sma(volume, 20); formatted as a percent and color-coded.
Practical read of the screen
Fast cloud flips (12/21) often mark short-term momentum changes; mid cloud flips (34/50) reflect swing bias.
Air Gap lines from higher TFs frequently act as support/resistance. Larger spaces between lines = “air gaps” where price can move with less friction.
RVol color tells you how “real” a move is: red/yellow often confirms momentum; blue warns of thin/liquidy bars.
DTR vs ATR shows if today’s range is stretched vs recent norm.
Design choices (why your prior errors are gone)
Removed multiline ?: chains → replaced by if/else (Pine v6 is picky about line continuations).
Moved fill() calls outside of local if blocks (Pine limitation).
ta.change(time("D")) != 0 makes the if condition boolean.
Declared G_drawFrom / G_barsBack before startX() so identifiers exist.

RSI + Stochastic Combo (fixed) by howhaber# RSI + Stochastic Indicator
**Summary**
This indicator combines RSI and Stochastic to generate BUY and SELL signals in oversold or overbought market conditions. It merges both indicators for higher accuracy, reducing false signals. Includes visual signals on the chart, alerts, and an info label for quick analysis.
---
## 📈 How the Indicator Works
### RSI Component
- Calculates standard RSI based on the specified period (`rsiLen`).
- Indicates oversold (< 30) or overbought (> 70) conditions.
### Stochastic Component
- Manually calculated to avoid compatibility issues.
- Measures the current price position relative to the price range (highs/lows) over the selected period.
- Smoothed using two SMA filters (%K and %D).
### Signal Logic
**BUY Signal**:
- %K crosses above %D (`ta.crossover(k, d)`).
- %K < 20 (oversold market).
- RSI < specified threshold (default < 40).
**SELL Signal**:
- %K crosses below %D (`ta.crossunder(k, d)`).
- %K > 80 (overbought market).
- RSI > specified threshold (default > 60).
---
## 📍 What's Displayed on the Chart
- 🟢 **Green arrow** below the bar → BUY signal.
- 🔴 **Red arrow** above the bar → SELL signal.
- **In a separate window**:
- RSI line (blue).
- Stochastic %K (orange).
- Stochastic %D (purple).
- Reference levels: 30/70 (RSI), 20/80 (Stochastic).
---
## 🔔 Alerts
- **RSI+Stoch BUY**: Notification on BUY signal.
- **RSI+Stoch SELL**: Notification on SELL signal.
Receive alerts via email, Telegram, or directly on the platform.
---
## 🧩 Additional Feature
- Info label on the last bar, displaying:
- Current RSI value.
- %K and %D values.
- Facilitates quick visual checks of the indicator's current state.
---
## 💡 Interpretation
- **Oversold market** (confirmed by RSI and Stochastic): Likely upward reversal.
- **Overbought market** (confirmed by RSI and Stochastic): Likely downward reversal.
- Combining both reduces false signals and improves accuracy in choppy markets.
---
## ⚠️ Important Note
This indicator is not financial advice. It is designed for technical analysis and educational purposes. Combine it with other tools like trend analysis, volume, and price patterns for better results.

Logit RSI [AdaptiveRSI]The traditional 0–100 RSI scale makes statistical overlays, such as Bollinger Bands or even moving averages, technically invalid. This script solves this issue by placing RSI on an unbounded, continuous scale, enabling these tools to work as intended.
The Logit function takes bounded data, such as RSI values ranging from 0 to 100, and maps them onto an unbounded scale ranging from negative infinity (−∞) to positive infinity (+∞).
An RSI reading of 50 becomes 0 on the Logit scale, indicating a balanced market. Readings above 50 map to positive Logit values (price above Wilder’s EMA / RSI above 50), while readings below 50 map to negative values (price below Wilder’s EMA / RSI below 50).
For the detailed formula, which calculates RSI as a scaled distance from Wilder’s EMA, check the RSI
: alternative derivation script.
The main issue with the 0–100 RSI scale is that different lookback periods produce very different distributions of RSI values. The histograms below illustrate how often RSIs of various lengths spend time within each 5-point range.
On RSI(2), the tallest bars appear at the edges (0–5 and 95–100), meaning short-term RSI spends most of its time at the extremes. For longer lookbacks, the bars cluster around the center and rarely reach 70 or 30.
This behavior makes it difficult to generalize the two most common RSI techniques:
Fixed 70/30 thresholds: These overbought and oversold levels only make sense for short- or mid-range lookbacks (around the low teens). For very short periods, RSI spends most of its time above or below these levels, while for long-term lookbacks, RSI rarely reaches them.
Bollinger Bands (±2 standard deviations): When applied directly to RSI, the bands often extend beyond the 0–100 limits (especially for short-term lookbacks) making them mathematically invalid. While the issue is less visible on longer settings, it remains conceptually incorrect.
To address this, we apply the Logit Transform :
Logit RSI = LN(RSI / (100 − RSI))
The transformed data fits a smooth bell-shaped curve, allowing statistical tools like Bollinger Bands to function properly for the first time.
Why Logit RSI Matters:
Makes RSI statistically consistent across all lookback periods.
Greatly improves the visual clarity of short-term RSIs
Allows proper use of volatility tools (like Bollinger Bands) on RSI.
Replaces arbitrary 70/30 levels with data-driven thresholds.
Simplifies RSI interpretation for both short- and long-term analysis.
INPUTS:
RSI Length — set the RSI lookback period used in calculations.
RSI Type — choose between Regular RSI or Logit RSI .
Plot Bollinger Bands — ON/OFF toggle to overlay statistical envelopes around RSI or Logit RSI.
SMA and Standard Deviation Length — defines the lookback period for both the SMA (Bollinger Bands midline) and Standard Deviation calculations.
Standard Deviation Multiplier — controls the width of the Bollinger Bands (e.g., 2.0 for ±2σ).
While simple, the Logit transformation represents an unexplored yet powerful mathematically grounded improvement to the classic RSI.
It offers traders a structured, intuitive, and statistically consistent way to use RSI across all timeframes.
I welcome your feedback, suggestions, and code improvements—especially regarding performance and efficiency. Your insights are greatly appreciated.

STRIKE BOXThis **“STRIKE BOX”** Pine Script is used by traders to visually define and track the **New York Opening Range (OR)** — one of the most important time windows in intraday trading — and to monitor how price behaves relative to that range throughout the rest of the session.
Here’s the breakdown of what it’s used for and why traders care:
---
### 🕘 **Purpose**
The script automatically identifies and plots:
1. **The New York Opening Range (8:00–9:30 AM NY time)** – where institutional volume begins to surge.
2. **The Trading Session (9:30–17:00 NY time)** – the official U.S. stock market hours.
It marks the **high and low of the opening range** and then watches for **breakouts** or **retests** during the rest of the day.
---
### 💡 **Why traders use this**
1. **Identify key liquidity zones**
* The high and low of the opening range often represent **areas of trapped traders**, **liquidity pools**, and **institutional positioning**.
* Price tends to **revisit or react strongly** around these levels.
2. **Find breakout or reversal opportunities**
* Traders wait for price to **break above or below** the OR to confirm **directional bias** for the day.
* For example:
* A break above the OR high = possible bullish continuation.
* A break below the OR low = possible bearish momentum.
* If price fails to break and stays inside the range, that signals a **choppy or consolidating market**.
3. **Define risk and targets easily**
* The OR gives **natural stop-loss and take-profit zones**.
* A trader can buy near the OR low and target the OR high, or vice versa.
4. **Filter trades during high-volume hours**
* The New York session overlaps with London for a bit — this is when **most daily volume and volatility** occur.
* Many traders only want to trade inside or just after this opening period.
---
### 📊 **How this script helps**
* It **automatically draws lines** for the OR high and low.
* It plots **vertical dashed lines** marking when the OR starts and ends.
* It **detects when price breaks the OR** (sets `High_Break` or `Low_Break` to true).
* It provides clear **visual zones** for decision-making instead of manually drawing them every day.
---
### 🧠 In short
Traders use this to:
* See where the **New York Opening Range** formed.
* Watch for **breakouts or fakeouts** beyond that range.
* Align their trades with **institutional market flow**.
* Keep charts **clean and systematic** rather than guessing daily key levels.
---

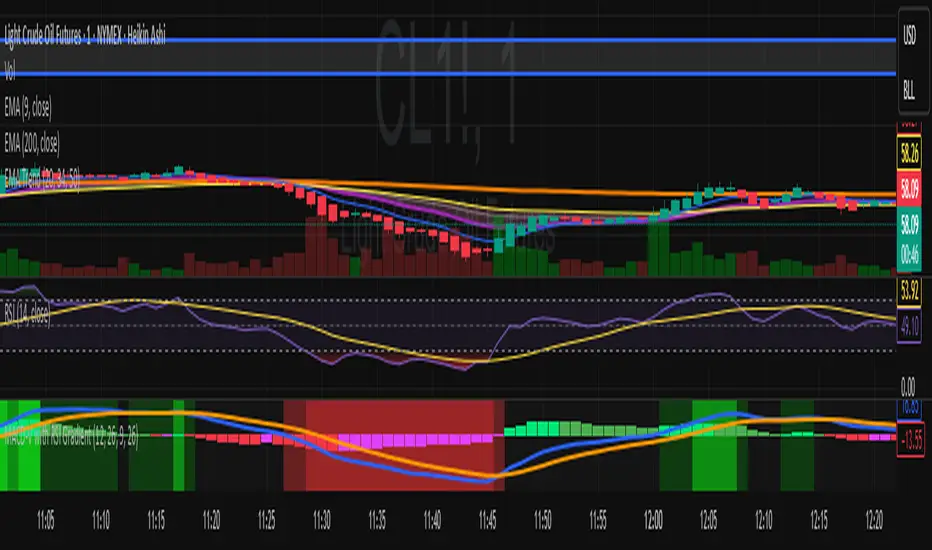
MACD-V with RSI Gradient## Overview
MACD-V is a volatility-adjusted momentum indicator that normalizes MACD using ATR. This version adds a dynamic RSI-based background gradient to highlight momentum zones visually.
## Features
- **MACD-V Line**: EMA-based momentum normalized by ATR
- **Signal Line**: EMA of MACD-V
- **Histogram**: Color-coded based on slope and polarity
- **RSI Gradient Background**: Shading from bright green (RSI > 75) to bright red (RSI < 30), with intermediate tones for momentum context
## Use Case
Designed for 30-minute oil futures charts, this indicator helps identify:
- Trend strength and reversals
- Momentum zones using RSI shading
- Pullback opportunities and exhaustion zones
## Inputs
- Fast EMA (default: 12)
- Slow EMA (default: 26)
- Signal EMA (default: 9)
- ATR Length (default: 26)
## Notes
- RSI shading is purely visual—no alerts are wired in yet
- Histogram renders behind MACD-V and Signal lines for clarity
- Colors are tuned for dark charts
## Credits
The MACD-v is an indicator created in 2015 by Alex Spiroglou
and presented to the public in 2022
as a paper called: "𝗠𝗔𝗖𝗗-𝘃: 𝗩𝗼𝗹𝗮𝘁𝗶𝗹𝗶𝘁𝘆 𝗡𝗼𝗿𝗺𝗮𝗹𝗶𝘀𝗲𝗱 𝗠𝗼𝗺𝗲𝗻𝘁𝘂𝗺"
It received the following Awards:
1. “𝐅𝐨𝐮𝐧𝐝𝐞𝐫𝐬 𝐀𝐰𝐚𝐫𝐝” (2022),
for advances in Active Investment Management
from the National Association of Active Investment Managers (NAAIM)
2. “𝐂𝐡𝐚𝐫𝐥𝐞𝐬 𝐇. 𝐃𝐨𝐰 𝐀𝐰𝐚𝐫𝐝” (2022)
for outstanding research in Technical Analysis,
from the Chartered Market Technicians Association (CMTA)
The RSI Gradient was my idea, but quite frankly, if I go looking around I suppose I'll find that others had the same idea.
This is the first time I've ever published any code, so if I stepped on anyone's toes. I'm sorry.

MACD-V with RSI Gradient## Overview
MACD-V is a volatility-adjusted momentum indicator that normalizes MACD using ATR. This version adds a dynamic RSI-based background gradient to highlight momentum zones visually.
## Features
- **MACD-V Line**: EMA-based momentum normalized by ATR
- **Signal Line**: EMA of MACD-V
- **Histogram**: Color-coded based on slope and polarity
- **RSI Gradient Background**: Shading from bright green (RSI > 75) to bright red (RSI < 30), with intermediate tones for momentum context
## Use Case
Designed for 30-minute oil futures charts, this indicator helps identify:
- Trend strength and reversals
- Momentum zones using RSI shading
- Pullback opportunities and exhaustion zones
## Inputs
- Fast EMA (default: 12)
- Slow EMA (default: 26)
- Signal EMA (default: 9)
- ATR Length (default: 26)
## Notes
- RSI shading is purely visual—no alerts are wired in yet
- Histogram renders behind MACD-V and Signal lines for clarity
- Colors are tuned for dark charts
## Credits
Developed by Mark (SylvaRocks), optimized for tactical clarity and scalping precision.
Mark the New York trading session hours(纽约交易时间段标注)Apply background shading for New York time.
(纽约时间背景着色)
04:00 ~ 09:00
09:00 ~ 09:30
09:30 ~ 12:00
No shading needed after 12 AM as I'll be asleep.
(12点我睡觉了就不着色了。)
IB range + Breakout fibsThe IB High / Low + Auto-Fib indicator automatically plots the Initial Balance range and a Fibonacci projection for each trading day.
Define your IB start and end times (e.g., 09:30–10:30).
The indicator marks the IB High and IB Low from that session and extends them to the session close.
It keeps the last N days visible for context.
When price breaks outside the IB range, it automatically plots a Fibonacci retracement/extension from the opposite IB side to the breakout, using levels 0, 0.236, 0.382, 0.5, 0.618, 0.88, 1.
The Fib updates dynamically as the breakout extends, and labels are neatly aligned on the right side of the chart for clarity.
Ideal for traders who monitor Initial Balance breaks, range expansions, and Fibonacci reaction levels throughout the trading session.

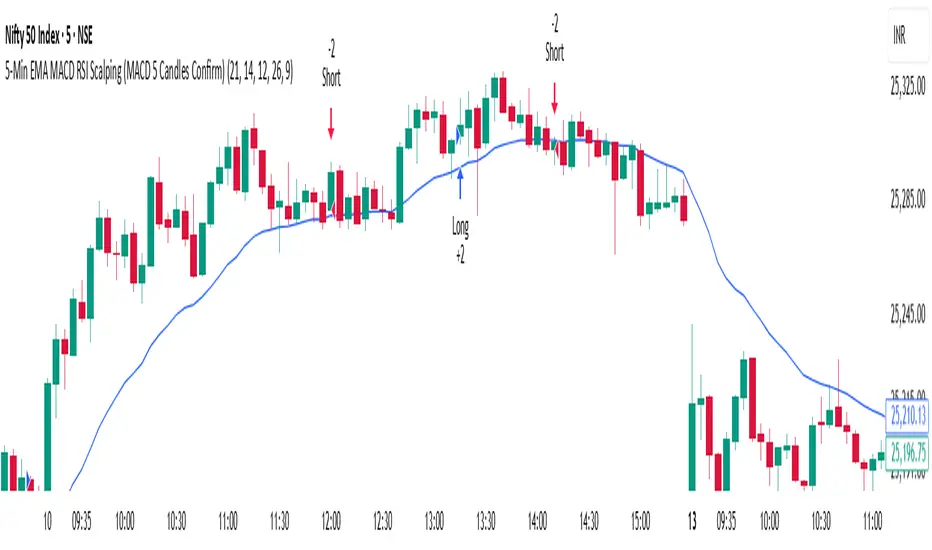
5-Min EMA MACD RSI Scalping (MACD 5 Candles Confirm) - BVK 🔹 5-Min EMA MACD RSI Scalping Strategy – Full Description
The 5-Min EMA MACD RSI Scalping Strategy is a powerful intraday trading technique designed for quick trades on lower timeframes, mainly the 5-minute chart. It combines trend confirmation (EMA), momentum analysis (MACD), and overbought/oversold signals (RSI) to capture short, high-probability price moves in both bullish and bearish markets.
⚙️ Indicators Used:
Exponential Moving Averages (EMA)
EMA 9 – Fast-moving average for entry trigger.
EMA 21 – Medium-term average for trend confirmation.
When EMA 9 crosses above EMA 21 → Bullish bias.
When EMA 9 crosses below EMA 21 → Bearish bias.
MACD (12, 26, 9)
Confirms momentum and possible entry zones.
Bullish confirmation: MACD line crosses above signal line.
Bearish confirmation: MACD line crosses below signal line.
RSI (14-period)
Filters out false signals.
Buy zone: RSI rising above 40–50.
Sell zone: RSI falling below 60–50.
Avoid trades when RSI is near 70 (overbought) or 30 (oversold).
💡 Entry Rules:
Buy Setup (Long Trade):
EMA 9 crosses above EMA 21.
MACD line crosses above signal line (positive momentum).
RSI is above 50 but below 70 (confirming strength).
Enter trade at candle close.
Sell Setup (Short Trade):
EMA 9 crosses below EMA 21.
MACD line crosses below signal line.
RSI is below 50 but above 30 (confirming weakness).
Enter trade at candle close.
🎯 Exit Rules:
Take Profit: 1.5x to 2x of risk or near the opposite EMA crossover.
Stop Loss: Below/above recent swing low/high or 0.3–0.5% away from entry.
Optional trailing stop using EMA 9 for dynamic exits.
📊 Best Timeframes & Assets:
Works best on 5-minute charts.
Suitable for Forex, Indices, Cryptocurrency, and Stocks with good liquidity.
Avoid major news events or low-volume sessions.
⚠️ Tips for Best Results:
Trade only during high-volume market sessions (e.g., London/New York overlap).
Always confirm trend direction on higher timeframes (15m or 1H).
Avoid overtrading—wait for clear signal confluence (EMA + MACD + RSI).
🧠 Strategy Summary:
“EMA gives you the trend, MACD gives you momentum, and RSI keeps you disciplined.”
This strategy is simple yet effective for traders who prefer quick in-and-out trades within minutes, offering a structured approach to scalping with reduced emotional bias.
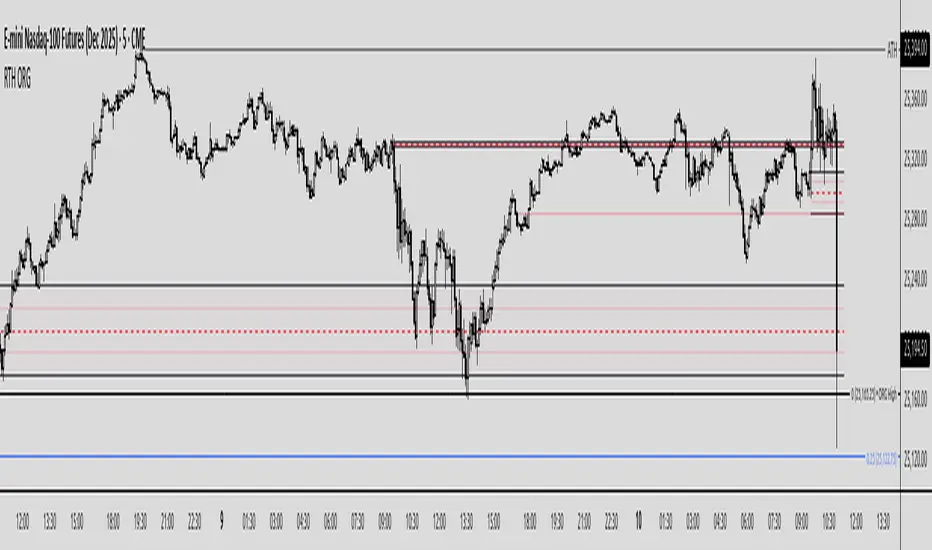
Regular Trading Hours Opening Range Gap (RTH ORG)### Regular Trading Hours (RTH) Gap Indicator with Quartile Levels
**Overview**
Discover overnight gaps in index futures like ES, YM, and NQ, or stocks like SPY, with this enhanced Pine Script v6 indicator. It visualizes the critical gap between the previous RTH close (4:15 PM ET for futures, 4:00 PM for SPY) and the next RTH open (9:30 AM ET), helping traders spot potential price sensitivity formed during after-hours trading.
**Key Features**
- **Standard Gap Boxes**: Semi-transparent boxes highlight the gap range, with optional text labels showing day-of-week and "RTH" identifier.
- **Midpoint Line**: A customizable dashed line at the 50% level, with price labels for quick reference.
- **New: Quartile Lines (25% & 75%)**: Dotted lines (default width 1) mark the quarter and three-quarter points within the gap, ideal for finer intraday analysis. Toggle on/off, adjust style/color/width, and add labels.
- **High-Low Gap Variant**: Optional boxes and midlines for gaps between the prior close's high/low and the open's high/low—perfect for wick-based overlaps on lower timeframes (5-min or below recommended).
- **RTH Close Lines**: Extend previous close levels with dotted lines and price tags.
- **Customization Galore**: Extend elements right, limit historical displays (default: 3 gaps), no-plot sessions (e.g., avoid weekends), and time offsets for non-US indices.
**How to Use**
Apply to 15-min or lower charts for best results. Toggle "extend right" for ongoing levels. SPY auto-adjusts for its 4 PM close.
Tested on major indices—enhance your gap trading strategy today! Questions? Drop a comment.
Thanks to twingall for supplying the original code.
Thanks to The Inner Circle Trader (ICT) for the logical and systematic application.
6 minutes ago
Release Notes
### Regular Trading Hours (RTH) Gap Indicator with Quartile Levels
**Overview**
Discover overnight gaps in index futures like ES, YM, and NQ, or stocks like SPY, with this enhanced Pine Script v6 indicator. It visualizes the critical gap between the previous RTH close (4:15 PM ET for futures, 4:00 PM for SPY) and the next RTH open (9:30 AM ET), helping traders spot potential price sensitivity formed during after-hours trading.
**Key Features**
- **Standard Gap Boxes**: Semi-transparent boxes highlight the gap range, with optional text labels showing day-of-week and "RTH" identifier.
- **Midpoint Line**: A customizable dashed line at the 50% level, with price labels for quick reference.
- **New: Quartile Lines (25% & 75%)**: Dotted lines (default width 1) mark the quarter and three-quarter points within the gap, ideal for finer intraday analysis. Toggle on/off, adjust style/color/width, and add labels.
- **High-Low Gap Variant**: Optional boxes and midlines for gaps between the prior close's high/low and the open's high/low—perfect for wick-based overlaps on lower timeframes (5-min or below recommended).
- **RTH Close Lines**: Extend previous close levels with dotted lines and price tags.
- **Customization Galore**: Extend elements right, limit historical displays (default: 3 gaps), no-plot sessions (e.g., avoid weekends), and time offsets for non-US indices.
**How to Use**
Apply to 15-min or lower charts for best results. Toggle "extend right" for ongoing levels. SPY auto-adjusts for its 4 PM close.
Tested on major indices—enhance your gap trading strategy today! Questions? Drop a comment.
Thanks to twingall for supplying the original code.
Thanks to The Inner Circle Trader (ICT) for the logical and systematic application.
+++ 2025.10.13 added new labels / fixed bugs