ATM Option Selling StrategyATM Option Selling Strategy – Explained
This strategy is designed for intraday option selling based on the 9/15 EMA crossover, 50/80 MA trend filter, and RSI 50 level. It ensures that all trades are exited before market close (3:24 PM IST).
. Indicators Used:
9 EMA & 15 EMA → For short-term trend identification.
50 MA & 80 MA → To determine the overall trend.
RSI (14) → To confirm momentum (above or below 50 level).
2. Entry Conditions:
🔴 Sell ATM Call (CE) when:
Price is below 50 & 80 MA (Bearish trend).
9 EMA crosses below 15 EMA (Short-term trend turns bearish).
RSI is below 50 (Momentum confirms weakness).
🟢 Sell ATM Put (PE) when:
Price is above 50 & 80 MA (Bullish trend).
9 EMA crosses above 15 EMA (Short-term trend turns bullish).
RSI is above 50 (Momentum confirms strength).
3. Position Sizing & Risk Management:
Sell 375 quantity per trade (Lot size).
50-Point Stop Loss → If option premium moves against us by 50 points, exit.
50-Point Take Profit → If option premium moves in our favor by 50 points, book profit.
Exit all trades at 3:24 PM IST → No overnight positions.
4. Exit Conditions:
✅ Stop Loss or Take Profit Hits → Automatically exits based on a 50-point move.
✅ Time-Based Exit at 3:24 PM → Ensures no open positions at market close.
Why This Works?
✔ Trend Confirmation → 50/80 MA ensures we only sell options in the direction of the market trend.
✔ Momentum Confirmation → RSI prevents entering weak trades.
✔ Controlled Risk → SL and TP protect against large losses.
✔ No Overnight Risk → All trades close before market close.
在脚本中搜索"油价调整最新消息:国内油价今日24时上调"

Universal Ratio Trend Matrix [InvestorUnknown]The Universal Ratio Trend Matrix is designed for trend analysis on asset/asset ratios, supporting up to 40 different assets. Its primary purpose is to help identify which assets are outperforming others within a selection, providing a broad overview of market trends through a matrix of ratios. The indicator automatically expands the matrix based on the number of assets chosen, simplifying the process of comparing multiple assets in terms of performance.
Key features include the ability to choose from a narrow selection of indicators to perform the ratio trend analysis, allowing users to apply well-defined metrics to their comparison.
Drawback: Due to the computational intensity involved in calculating ratios across many assets, the indicator has a limitation related to loading speed. TradingView has time limits for calculations, and for users on the basic (free) plan, this could result in frequent errors due to exceeded time limits. To use the indicator effectively, users with any paid plans should run it on timeframes higher than 8h (the lowest timeframe on which it managed to load with 40 assets), as lower timeframes may not reliably load.
Indicators:
RSI_raw: Simple function to calculate the Relative Strength Index (RSI) of a source (asset price).
RSI_sma: Calculates RSI followed by a Simple Moving Average (SMA).
RSI_ema: Calculates RSI followed by an Exponential Moving Average (EMA).
CCI: Calculates the Commodity Channel Index (CCI).
Fisher: Implements the Fisher Transform to normalize prices.
Utility Functions:
f_remove_exchange_name: Strips the exchange name from asset tickers (e.g., "INDEX:BTCUSD" to "BTCUSD").
f_remove_exchange_name(simple string name) =>
string parts = str.split(name, ":")
string result = array.size(parts) > 1 ? array.get(parts, 1) : name
result
f_get_price: Retrieves the closing price of a given asset ticker using request.security().
f_constant_src: Checks if the source data is constant by comparing multiple consecutive values.
Inputs:
General settings allow users to select the number of tickers for analysis (used_assets) and choose the trend indicator (RSI, CCI, Fisher, etc.).
Table settings customize how trend scores are displayed in terms of text size, header visibility, highlighting options, and top-performing asset identification.
The script includes inputs for up to 40 assets, allowing the user to select various cryptocurrencies (e.g., BTCUSD, ETHUSD, SOLUSD) or other assets for trend analysis.
Price Arrays:
Price values for each asset are stored in variables (price_a1 to price_a40) initialized as na. These prices are updated only for the number of assets specified by the user (used_assets).
Trend scores for each asset are stored in separate arrays
// declare price variables as "na"
var float price_a1 = na, var float price_a2 = na, var float price_a3 = na, var float price_a4 = na, var float price_a5 = na
var float price_a6 = na, var float price_a7 = na, var float price_a8 = na, var float price_a9 = na, var float price_a10 = na
var float price_a11 = na, var float price_a12 = na, var float price_a13 = na, var float price_a14 = na, var float price_a15 = na
var float price_a16 = na, var float price_a17 = na, var float price_a18 = na, var float price_a19 = na, var float price_a20 = na
var float price_a21 = na, var float price_a22 = na, var float price_a23 = na, var float price_a24 = na, var float price_a25 = na
var float price_a26 = na, var float price_a27 = na, var float price_a28 = na, var float price_a29 = na, var float price_a30 = na
var float price_a31 = na, var float price_a32 = na, var float price_a33 = na, var float price_a34 = na, var float price_a35 = na
var float price_a36 = na, var float price_a37 = na, var float price_a38 = na, var float price_a39 = na, var float price_a40 = na
// create "empty" arrays to store trend scores
var a1_array = array.new_int(40, 0), var a2_array = array.new_int(40, 0), var a3_array = array.new_int(40, 0), var a4_array = array.new_int(40, 0)
var a5_array = array.new_int(40, 0), var a6_array = array.new_int(40, 0), var a7_array = array.new_int(40, 0), var a8_array = array.new_int(40, 0)
var a9_array = array.new_int(40, 0), var a10_array = array.new_int(40, 0), var a11_array = array.new_int(40, 0), var a12_array = array.new_int(40, 0)
var a13_array = array.new_int(40, 0), var a14_array = array.new_int(40, 0), var a15_array = array.new_int(40, 0), var a16_array = array.new_int(40, 0)
var a17_array = array.new_int(40, 0), var a18_array = array.new_int(40, 0), var a19_array = array.new_int(40, 0), var a20_array = array.new_int(40, 0)
var a21_array = array.new_int(40, 0), var a22_array = array.new_int(40, 0), var a23_array = array.new_int(40, 0), var a24_array = array.new_int(40, 0)
var a25_array = array.new_int(40, 0), var a26_array = array.new_int(40, 0), var a27_array = array.new_int(40, 0), var a28_array = array.new_int(40, 0)
var a29_array = array.new_int(40, 0), var a30_array = array.new_int(40, 0), var a31_array = array.new_int(40, 0), var a32_array = array.new_int(40, 0)
var a33_array = array.new_int(40, 0), var a34_array = array.new_int(40, 0), var a35_array = array.new_int(40, 0), var a36_array = array.new_int(40, 0)
var a37_array = array.new_int(40, 0), var a38_array = array.new_int(40, 0), var a39_array = array.new_int(40, 0), var a40_array = array.new_int(40, 0)
f_get_price(simple string ticker) =>
request.security(ticker, "", close)
// Prices for each USED asset
f_get_asset_price(asset_number, ticker) =>
if (used_assets >= asset_number)
f_get_price(ticker)
else
na
// overwrite empty variables with the prices if "used_assets" is greater or equal to the asset number
if barstate.isconfirmed // use barstate.isconfirmed to avoid "na prices" and calculation errors that result in empty cells in the table
price_a1 := f_get_asset_price(1, asset1), price_a2 := f_get_asset_price(2, asset2), price_a3 := f_get_asset_price(3, asset3), price_a4 := f_get_asset_price(4, asset4)
price_a5 := f_get_asset_price(5, asset5), price_a6 := f_get_asset_price(6, asset6), price_a7 := f_get_asset_price(7, asset7), price_a8 := f_get_asset_price(8, asset8)
price_a9 := f_get_asset_price(9, asset9), price_a10 := f_get_asset_price(10, asset10), price_a11 := f_get_asset_price(11, asset11), price_a12 := f_get_asset_price(12, asset12)
price_a13 := f_get_asset_price(13, asset13), price_a14 := f_get_asset_price(14, asset14), price_a15 := f_get_asset_price(15, asset15), price_a16 := f_get_asset_price(16, asset16)
price_a17 := f_get_asset_price(17, asset17), price_a18 := f_get_asset_price(18, asset18), price_a19 := f_get_asset_price(19, asset19), price_a20 := f_get_asset_price(20, asset20)
price_a21 := f_get_asset_price(21, asset21), price_a22 := f_get_asset_price(22, asset22), price_a23 := f_get_asset_price(23, asset23), price_a24 := f_get_asset_price(24, asset24)
price_a25 := f_get_asset_price(25, asset25), price_a26 := f_get_asset_price(26, asset26), price_a27 := f_get_asset_price(27, asset27), price_a28 := f_get_asset_price(28, asset28)
price_a29 := f_get_asset_price(29, asset29), price_a30 := f_get_asset_price(30, asset30), price_a31 := f_get_asset_price(31, asset31), price_a32 := f_get_asset_price(32, asset32)
price_a33 := f_get_asset_price(33, asset33), price_a34 := f_get_asset_price(34, asset34), price_a35 := f_get_asset_price(35, asset35), price_a36 := f_get_asset_price(36, asset36)
price_a37 := f_get_asset_price(37, asset37), price_a38 := f_get_asset_price(38, asset38), price_a39 := f_get_asset_price(39, asset39), price_a40 := f_get_asset_price(40, asset40)
Universal Indicator Calculation (f_calc_score):
This function allows switching between different trend indicators (RSI, CCI, Fisher) for flexibility.
It uses a switch-case structure to calculate the indicator score, where a positive trend is denoted by 1 and a negative trend by 0. Each indicator has its own logic to determine whether the asset is trending up or down.
// use switch to allow "universality" in indicator selection
f_calc_score(source, trend_indicator, int_1, int_2) =>
int score = na
if (not f_constant_src(source)) and source > 0.0 // Skip if you are using the same assets for ratio (for example BTC/BTC)
x = switch trend_indicator
"RSI (Raw)" => RSI_raw(source, int_1)
"RSI (SMA)" => RSI_sma(source, int_1, int_2)
"RSI (EMA)" => RSI_ema(source, int_1, int_2)
"CCI" => CCI(source, int_1)
"Fisher" => Fisher(source, int_1)
y = switch trend_indicator
"RSI (Raw)" => x > 50 ? 1 : 0
"RSI (SMA)" => x > 50 ? 1 : 0
"RSI (EMA)" => x > 50 ? 1 : 0
"CCI" => x > 0 ? 1 : 0
"Fisher" => x > x ? 1 : 0
score := y
else
score := 0
score
Array Setting Function (f_array_set):
This function populates an array with scores calculated for each asset based on a base price (p_base) divided by the prices of the individual assets.
It processes multiple assets (up to 40), calling the f_calc_score function for each.
// function to set values into the arrays
f_array_set(a_array, p_base) =>
array.set(a_array, 0, f_calc_score(p_base / price_a1, trend_indicator, int_1, int_2))
array.set(a_array, 1, f_calc_score(p_base / price_a2, trend_indicator, int_1, int_2))
array.set(a_array, 2, f_calc_score(p_base / price_a3, trend_indicator, int_1, int_2))
array.set(a_array, 3, f_calc_score(p_base / price_a4, trend_indicator, int_1, int_2))
array.set(a_array, 4, f_calc_score(p_base / price_a5, trend_indicator, int_1, int_2))
array.set(a_array, 5, f_calc_score(p_base / price_a6, trend_indicator, int_1, int_2))
array.set(a_array, 6, f_calc_score(p_base / price_a7, trend_indicator, int_1, int_2))
array.set(a_array, 7, f_calc_score(p_base / price_a8, trend_indicator, int_1, int_2))
array.set(a_array, 8, f_calc_score(p_base / price_a9, trend_indicator, int_1, int_2))
array.set(a_array, 9, f_calc_score(p_base / price_a10, trend_indicator, int_1, int_2))
array.set(a_array, 10, f_calc_score(p_base / price_a11, trend_indicator, int_1, int_2))
array.set(a_array, 11, f_calc_score(p_base / price_a12, trend_indicator, int_1, int_2))
array.set(a_array, 12, f_calc_score(p_base / price_a13, trend_indicator, int_1, int_2))
array.set(a_array, 13, f_calc_score(p_base / price_a14, trend_indicator, int_1, int_2))
array.set(a_array, 14, f_calc_score(p_base / price_a15, trend_indicator, int_1, int_2))
array.set(a_array, 15, f_calc_score(p_base / price_a16, trend_indicator, int_1, int_2))
array.set(a_array, 16, f_calc_score(p_base / price_a17, trend_indicator, int_1, int_2))
array.set(a_array, 17, f_calc_score(p_base / price_a18, trend_indicator, int_1, int_2))
array.set(a_array, 18, f_calc_score(p_base / price_a19, trend_indicator, int_1, int_2))
array.set(a_array, 19, f_calc_score(p_base / price_a20, trend_indicator, int_1, int_2))
array.set(a_array, 20, f_calc_score(p_base / price_a21, trend_indicator, int_1, int_2))
array.set(a_array, 21, f_calc_score(p_base / price_a22, trend_indicator, int_1, int_2))
array.set(a_array, 22, f_calc_score(p_base / price_a23, trend_indicator, int_1, int_2))
array.set(a_array, 23, f_calc_score(p_base / price_a24, trend_indicator, int_1, int_2))
array.set(a_array, 24, f_calc_score(p_base / price_a25, trend_indicator, int_1, int_2))
array.set(a_array, 25, f_calc_score(p_base / price_a26, trend_indicator, int_1, int_2))
array.set(a_array, 26, f_calc_score(p_base / price_a27, trend_indicator, int_1, int_2))
array.set(a_array, 27, f_calc_score(p_base / price_a28, trend_indicator, int_1, int_2))
array.set(a_array, 28, f_calc_score(p_base / price_a29, trend_indicator, int_1, int_2))
array.set(a_array, 29, f_calc_score(p_base / price_a30, trend_indicator, int_1, int_2))
array.set(a_array, 30, f_calc_score(p_base / price_a31, trend_indicator, int_1, int_2))
array.set(a_array, 31, f_calc_score(p_base / price_a32, trend_indicator, int_1, int_2))
array.set(a_array, 32, f_calc_score(p_base / price_a33, trend_indicator, int_1, int_2))
array.set(a_array, 33, f_calc_score(p_base / price_a34, trend_indicator, int_1, int_2))
array.set(a_array, 34, f_calc_score(p_base / price_a35, trend_indicator, int_1, int_2))
array.set(a_array, 35, f_calc_score(p_base / price_a36, trend_indicator, int_1, int_2))
array.set(a_array, 36, f_calc_score(p_base / price_a37, trend_indicator, int_1, int_2))
array.set(a_array, 37, f_calc_score(p_base / price_a38, trend_indicator, int_1, int_2))
array.set(a_array, 38, f_calc_score(p_base / price_a39, trend_indicator, int_1, int_2))
array.set(a_array, 39, f_calc_score(p_base / price_a40, trend_indicator, int_1, int_2))
a_array
Conditional Array Setting (f_arrayset):
This function checks if the number of used assets is greater than or equal to a specified number before populating the arrays.
// only set values into arrays for USED assets
f_arrayset(asset_number, a_array, p_base) =>
if (used_assets >= asset_number)
f_array_set(a_array, p_base)
else
na
Main Logic
The main logic initializes arrays to store scores for each asset. Each array corresponds to one asset's performance score.
Setting Trend Values: The code calls f_arrayset for each asset, populating the respective arrays with calculated scores based on the asset prices.
Combining Arrays: A combined_array is created to hold all the scores from individual asset arrays. This array facilitates further analysis, allowing for an overview of the performance scores of all assets at once.
// create a combined array (work-around since pinescript doesn't support having array of arrays)
var combined_array = array.new_int(40 * 40, 0)
if barstate.islast
for i = 0 to 39
array.set(combined_array, i, array.get(a1_array, i))
array.set(combined_array, i + (40 * 1), array.get(a2_array, i))
array.set(combined_array, i + (40 * 2), array.get(a3_array, i))
array.set(combined_array, i + (40 * 3), array.get(a4_array, i))
array.set(combined_array, i + (40 * 4), array.get(a5_array, i))
array.set(combined_array, i + (40 * 5), array.get(a6_array, i))
array.set(combined_array, i + (40 * 6), array.get(a7_array, i))
array.set(combined_array, i + (40 * 7), array.get(a8_array, i))
array.set(combined_array, i + (40 * 8), array.get(a9_array, i))
array.set(combined_array, i + (40 * 9), array.get(a10_array, i))
array.set(combined_array, i + (40 * 10), array.get(a11_array, i))
array.set(combined_array, i + (40 * 11), array.get(a12_array, i))
array.set(combined_array, i + (40 * 12), array.get(a13_array, i))
array.set(combined_array, i + (40 * 13), array.get(a14_array, i))
array.set(combined_array, i + (40 * 14), array.get(a15_array, i))
array.set(combined_array, i + (40 * 15), array.get(a16_array, i))
array.set(combined_array, i + (40 * 16), array.get(a17_array, i))
array.set(combined_array, i + (40 * 17), array.get(a18_array, i))
array.set(combined_array, i + (40 * 18), array.get(a19_array, i))
array.set(combined_array, i + (40 * 19), array.get(a20_array, i))
array.set(combined_array, i + (40 * 20), array.get(a21_array, i))
array.set(combined_array, i + (40 * 21), array.get(a22_array, i))
array.set(combined_array, i + (40 * 22), array.get(a23_array, i))
array.set(combined_array, i + (40 * 23), array.get(a24_array, i))
array.set(combined_array, i + (40 * 24), array.get(a25_array, i))
array.set(combined_array, i + (40 * 25), array.get(a26_array, i))
array.set(combined_array, i + (40 * 26), array.get(a27_array, i))
array.set(combined_array, i + (40 * 27), array.get(a28_array, i))
array.set(combined_array, i + (40 * 28), array.get(a29_array, i))
array.set(combined_array, i + (40 * 29), array.get(a30_array, i))
array.set(combined_array, i + (40 * 30), array.get(a31_array, i))
array.set(combined_array, i + (40 * 31), array.get(a32_array, i))
array.set(combined_array, i + (40 * 32), array.get(a33_array, i))
array.set(combined_array, i + (40 * 33), array.get(a34_array, i))
array.set(combined_array, i + (40 * 34), array.get(a35_array, i))
array.set(combined_array, i + (40 * 35), array.get(a36_array, i))
array.set(combined_array, i + (40 * 36), array.get(a37_array, i))
array.set(combined_array, i + (40 * 37), array.get(a38_array, i))
array.set(combined_array, i + (40 * 38), array.get(a39_array, i))
array.set(combined_array, i + (40 * 39), array.get(a40_array, i))
Calculating Sums: A separate array_sums is created to store the total score for each asset by summing the values of their respective score arrays. This allows for easy comparison of overall performance.
Ranking Assets: The final part of the code ranks the assets based on their total scores stored in array_sums. It assigns a rank to each asset, where the asset with the highest score receives the highest rank.
// create array for asset RANK based on array.sum
var ranks = array.new_int(used_assets, 0)
// for loop that calculates the rank of each asset
if barstate.islast
for i = 0 to (used_assets - 1)
int rank = 1
for x = 0 to (used_assets - 1)
if i != x
if array.get(array_sums, i) < array.get(array_sums, x)
rank := rank + 1
array.set(ranks, i, rank)
Dynamic Table Creation
Initialization: The table is initialized with a base structure that includes headers for asset names, scores, and ranks. The headers are set to remain constant, ensuring clarity for users as they interpret the displayed data.
Data Population: As scores are calculated for each asset, the corresponding values are dynamically inserted into the table. This is achieved through a loop that iterates over the scores and ranks stored in the combined_array and array_sums, respectively.
Automatic Extending Mechanism
Variable Asset Count: The code checks the number of assets defined by the user. Instead of hardcoding the number of rows in the table, it uses a variable to determine the extent of the data that needs to be displayed. This allows the table to expand or contract based on the number of assets being analyzed.
Dynamic Row Generation: Within the loop that populates the table, the code appends new rows for each asset based on the current asset count. The structure of each row includes the asset name, its score, and its rank, ensuring that the table remains consistent regardless of how many assets are involved.
// Automatically extending table based on the number of used assets
var table table = table.new(position.bottom_center, 50, 50, color.new(color.black, 100), color.white, 3, color.white, 1)
if barstate.islast
if not hide_head
table.cell(table, 0, 0, "Universal Ratio Trend Matrix", text_color = color.white, bgcolor = #010c3b, text_size = fontSize)
table.merge_cells(table, 0, 0, used_assets + 3, 0)
if not hide_inps
table.cell(table, 0, 1,
text = "Inputs: You are using " + str.tostring(trend_indicator) + ", which takes: " + str.tostring(f_get_input(trend_indicator)),
text_color = color.white, text_size = fontSize), table.merge_cells(table, 0, 1, used_assets + 3, 1)
table.cell(table, 0, 2, "Assets", text_color = color.white, text_size = fontSize, bgcolor = #010c3b)
for x = 0 to (used_assets - 1)
table.cell(table, x + 1, 2, text = str.tostring(array.get(assets, x)), text_color = color.white, bgcolor = #010c3b, text_size = fontSize)
table.cell(table, 0, x + 3, text = str.tostring(array.get(assets, x)), text_color = color.white, bgcolor = f_asset_col(array.get(ranks, x)), text_size = fontSize)
for r = 0 to (used_assets - 1)
for c = 0 to (used_assets - 1)
table.cell(table, c + 1, r + 3, text = str.tostring(array.get(combined_array, c + (r * 40))),
text_color = hl_type == "Text" ? f_get_col(array.get(combined_array, c + (r * 40))) : color.white, text_size = fontSize,
bgcolor = hl_type == "Background" ? f_get_col(array.get(combined_array, c + (r * 40))) : na)
for x = 0 to (used_assets - 1)
table.cell(table, x + 1, x + 3, "", bgcolor = #010c3b)
table.cell(table, used_assets + 1, 2, "", bgcolor = #010c3b)
for x = 0 to (used_assets - 1)
table.cell(table, used_assets + 1, x + 3, "==>", text_color = color.white)
table.cell(table, used_assets + 2, 2, "SUM", text_color = color.white, text_size = fontSize, bgcolor = #010c3b)
table.cell(table, used_assets + 3, 2, "RANK", text_color = color.white, text_size = fontSize, bgcolor = #010c3b)
for x = 0 to (used_assets - 1)
table.cell(table, used_assets + 2, x + 3,
text = str.tostring(array.get(array_sums, x)),
text_color = color.white, text_size = fontSize,
bgcolor = f_highlight_sum(array.get(array_sums, x), array.get(ranks, x)))
table.cell(table, used_assets + 3, x + 3,
text = str.tostring(array.get(ranks, x)),
text_color = color.white, text_size = fontSize,
bgcolor = f_highlight_rank(array.get(ranks, x)))

CSVParser█ OVERVIEW
The library contains functions for parsing and importing complex CSV configurations (with a special simple syntax) into a special hierarchical object (of type objProps ) as follows:
Functions:
parseConfig() - reads CSV text into an objProps object.
toT() - displays the contents of an objProps object in a table form, which allows to check the CSV text for syntax errors.
getPropAr() - returns objProps.arS array for child object with `prop` key in mpObj map (or na if not found)
This library is handy in allowing users to store presets for the scripts and switch between them (see, e.g., my HTF moving averages script where users can switch between several preset configuations of 24 MA's across 5 timeframes).
█ HOW THE SCRIPT WORKS.
The script works as follows:
all values read from config text are stored as strings
Nested brackets in config text create a named nested objects of objProps0, ... , objProps9 types.
objProps objects of each level have the following fields:
- array arS for storing values without names (e.g. "12, 23" will be imported into a string array arS as )
- map mpS for storing items with names (e.g. "tf = 60, length = 21" will be imported as <"tf", "60"> and <"length", "21"> pairs into mpS )
- map mpObj for storing nested objects (e.g. "TF1(tf=60, length(21,50,100))" creates a <"TF1, objProps0 object> pair in mpObj map property of the top level object (objProps) , "tf=60" is stored as <"tf", "60"> key-value pair in mpS map property of a next level object (objProps0) and "length (...)" creates a <"length", objProps1> pair in objProps0.mpObj map while length values are stored in objProps1.arS array as strings. Every opening bracket creates a next level objProps object.
If objects or properties with duplicate names are encountered only the latest is imported
(e.g. for "TF1(length(12,22)), TF1(tf=240)" only "TF1(tf=240)" will be imported
Line breaks are not regarded as part of syntax (i.e. values are imported with line breaks, you can supply
symbols "(" , ")" , "," and "=" are special characters and cannot be used within property values (with the exception of a quoted text as a value of a property as explained below)
named properties can have quoted text as their value. In that case special characters within quotation marks are regarded as normal characters. Text between "=" and opening quotation mark as well as text following the closing quotation mark and until next property value is ignored. E.g. "quote = ignored "The quote" also ignored" will be imported as <"quote", "The quote">. Quotation marks within quotes must be excaped with "\" .
if a key names happens to be a multi-line then only first line containing non-space characters (trimmed from spaces) is taken as a key.
")," or ") ," and similar do not create an empty ("") array item while ",," does. (",)" creates an "" array item)
█ CSV CONFIGURATION SYNTAX
Unnamed values: just list them comma separated and they will be imported into arS of the object of the current level.
Named values: use "=" sign as follows: "property1=value1, property2 = value2"
Value of several objects: Use brackets after the name of the object ant list all object properties within the brackets (including its child objects if necessary). E.g. "TF1(tf =60, length(21,200), TF2(tf=240, length(50,200)"
Named and unnamed values as well as objects can go in any order. E.g. "12, tf=60, 21" will be imported as follows: "12", "21" will go to arS array and <"tf", "60"> will go to mpS maP of objProps (the top level object).
You can play around and test your config text using demo in this library, just edit your text in script settings and see how it is parsed into objProps objects.
█ USAGE RECOMMENDATIONS AND SAMPLE USE
I suggest the following approach:
- create functions for your UDT which can set properties by name.
- create enumerator functions which iterates through all the property names (supplied as a const string array) and imports their values into the object
█ SAMPLE USE
A sample use of this library can be seen in my Multi-timeframe 24 moving averages + BB+SAR+Supertrend+VWAP script where settings for the MAs across many timeframes are imported from CSV configurations (presets).
█ FULL LIST OF FUNCTIONS AND PROPERTIES
nzs(_s, nz)
Like nz() but for strings. Returns `nz` arg (default = "") if _s is na.
Parameters:
_s (string)
nz (string)
method init(this)
Initializes objProps obj (creates child maps and arrays)
Namespace types: objProps
Parameters:
this (objProps)
method toT(this, nz)
Outputs objProps to string matrices for further display using autotable().
Namespace types: objProps, objProps1, ..., objProps9
Parameters:
this (objProps/objProps1/..../objProps9)
nz (string)
Returns: A tuple - value, merge and color matrix (autotable() parameters)
method parseConfig(this, s)
Reads config text into objProps (unnamed values into arS, named into mpS, sub-levels into mpObj)
Namespace types: objProps
Parameters:
this (objProps)
s (string)
method getPropArS(this, prop)
Returns a string array of values for a given property name `prop`. Looks for a key `prop` in objProps.mpObj
if finds pair returns obj.arS, otherwise returns na. Returns a reference to the original, not a copy.
Namespace types: objProps, objProps1, ..., objProps8
Parameters:
this (objProps/objProps1/..../objProps8)
prop (string)
method getPropVal(this, prop, id)
Checks if there is an array of values for property `prop` and returns its `id`'s element or na if not found
Namespace types: objProps, objProps1, ..., objProps8
Parameters:
this (objProps/objProps1/..../objProps8) : objProps object containing array of property values in a child objProp object corresponding to propertty name.
prop (string) : (string) Name of the property
id (int) : (int) Id of the element to be returned from the array pf property values
objProps9 type
Object for storing values read from CSV relating to a particular object or property name.
Fields:
mpS (map) : (map() Stores property values as pairs
arS (array) : (string ) Array of values
objProps, objProps0, ... objProps8 types
Object for storing values read from CSV relating to a particular object or property name.
Fields:
mpS (map) : (map() Stores property values as pairs
arS (array) : (string ) Array of values
mpObj (map) : (map() Stores objProps objects containing properties's data as pairs

Depth of Market (DOM) [LuxAlgo]The Depth Of Market (DOM) tool allows traders to look under the hood of any market, taking price and volume analysis to the next level. The following features are included: DOM, Time & Sales, Volume Profile, Depth of Market, Imbalances, Buying Pressure, and up to 24 key intraday levels (it really packs a punch).
As a disclaimer, this tool does not use tick data, it is a DOM reconstruction from the provided real-time time series data (price and volume). So the volume you see is from filled orders only, this tool does not show unfilled limit orders.
Traders can enable or disable any of the features at will to avoid being overwhelmed with too much information and to make the tool perform faster.
The features that have the biggest impact on performance are Historical Data Collection, Key Levels (POC & VWAP), Time & Sales, Profile, and Imbalances. Disable these features to improve the indicator computational performance.
🔶 DOM
This is the simplest form of the tool, a simple DOM or ladder that displays the following columns:
PRICE: Price level
BID: Total number of market sell orders filled or limit buy orders filled.
SELL: Sell market orders
BUY: Buy market orders
ASK: Total number of market buy orders filled or limit sell orders filled.
The DOM only collects historical data from the last 24 hours and real-time data.
Traders can select a reset period for the DOM with two options:
DAILY: Resets at the beginning of each trading day
SESSIONS: Resets twice, as DAILY and 15.5 hours later, to coincide with the start of the RTH session for US tickers.
The DOM has two main modes, it can display price levels as ticks or points. The default is automatic based on the current daily volatility, but traders can manually force one mode or the other if they wish.
For convenience, traders have the option to set the number of lines (price levels), and the size of the text and to display only real-time data.
By default, the top price is set to 0 so that the DOM automatically adjusts the price levels to be displayed, but traders can set the top price manually so that the tool displays only the desired price levels in a fixed manner.
🔹 Volume Profile
As additional features to the basic DOM, traders have access to the volume profile histogram and the total volume per price level.
This helps traders identify at a glance key price areas where volume is accumulating (high volume nodes) or areas where volume is lacking (low volume nodes) - these areas are important to some traders who base their decision-making process on them.
🔹 Imbalances
Other added features are imbalances and buying pressure:
Interlevel Imbalance: volume delta between two different price levels
Intralevel Imbalance: delta between buy and sell volume at the same price level
Buying Pressure Percent: percentage of buy volume compared to total volume
Imbalances can help traders identify areas of interest in the price for possible support or resistance.
🔹 Depth
Depth allows traders to see at a glance how much supply is above the current price level or how much demand is below the current price level.
Above the current price level shows the cumulative ask volume (filled sell limit orders) and below the current price level shows the cumulative bid volume (filled buy limit orders).
🔶 KEY LEVELS
The tool includes up to 24 different key intraday levels of particular relevance:
Previous Week Levels
PWH: Previous week high
PWL: Previous week low
PWM: Previous week middle
PWS: Previous week settlement (close)
Previous Day Levels
PDH: Previous day high
PDL: Previous day low
PDM: Previous day middle
PDS: Previous day settlement (close)
Current Day Levels
OPEN: Open of day (or session)
HOD: High of day (or session)
LOD: Low of day (or session)
MOD: Middle of day (or session)
Opening Range
ORH: Open range high
ORL: Open range low
Initial Balance
IBH: Initial balance high
IBL: Initial balance low
VWAP
+3SD: Volume weighted average price plus 3 standard deviations
+2SD: Volume weighted average price plus 2 standard deviations
+1SD: Volume weighted average price plus 1 standard deviation
VWAP: Volume weighted average price
-1SD: Volume weighted average price minus 1 standard deviation
-2SD: Volume weighted average price minus 2 standard deviations
-3SD: Volume weighted average price minus 3 standard deviations
POC: Point of control
Different traders look at different levels, the key levels shown here are objective and specific areas of interest that traders can act on, providing us with potential areas of support or resistance in the price.
🔶 TIME & SALES
The tool also features a full-time and sales panel with time, price, and size columns, a size filter, and the ability to set the timezone to display time in the trader's local time.
The information shown here is what feeds the DOM and it can be useful in several ways, for example in detecting absorption. If a large number of orders are coming into the market but the price is barely moving, this indicates that there is enough liquidity at these levels to absorb all these orders, so if these orders stop coming into the market, the price may turn around.
🔶 SETTINGS
Period: Select the anchoring period to start data collection, DAILY will anchor at the start of the trading day, and SESSIONS will start as DAILY and 15.5 hours later (RTH for US tickers).
Mode: Select between AUTO and MANUAL modes for displaying TICKS or POINTS, in AUTO mode the tool will automatically select TICKS for tickers with a daily average volatility below 5000 ticks and POINTS for the rest of the tickers.
Rows: Select the number of price levels to display
Text Size: Select the text size
🔹 DOM
DOM: Enable/Disable DOM display
Realtime only: Enable/Disable real-time data only, historical data will be collected if disabled
Top Price: Specify the price to be displayed on the top row, set to 0 to enable dynamic DOM
Max updates: Specify how many times the values on the SELL and BUY columns are accumulated until reset.
Profile/Depth size: Maximum size of the histograms on the PROFILE and DEPTH columns.
Profile: Enable/Disable Profile column. High impact on performance.
Volume: Enable/Disable Volume column. Total volume traded at price level.
Interlevel Imbalance: Enable/Disable Interlevel Imbalance column. Total volume delta between the current price level and the price level above. High impact on performance.
Depth: Enable/Disable Depth, showing the cumulative supply above the current price and the cumulative demand below. Impact on performance.
Intralevel Imbalance: Enable/Disable Intralevel Imbalance column. Delta between total buy volume and total sell volume. High impact on performance.
Buying Pressure Percent: Enable/Disable Buy Percent column. Percentage of total buy volume compared to total volume.
Imbalance Threshold %: Threshold for highlighting imbalances. Set to 90 to highlight the top 10% of interlevel imbalances and the top and bottom 10% of intra-level imbalances.
Crypto volume precision: Specify the number of decimals to display on the volume of crypto assets
🔹 Key Levels
Key Levels: Enable/Disable KEY column. Very high performance impact.
Previous Week: Enable/Disable High, Low, Middle, and Close of the previous trading week.
Previous Day: Enable/Disable High, Low, Middle, and Settlement of the previous trading day.
Current Day/Session: Enable/Disable Open, High, Low and Middle of the current period.
Open Range: Enable/Disable High and Low of the first candle of the period.
Initial Balance: Enable/Disable High and Low of the first hour of the period.
VWAP: Enable/Disable Volume-weighted average price of the period with 1, 2, and 3 standard deviations.
POC: Enable/Disable Point of Control (price level with the highest volume traded) of the period.
🔹 Time & Sales
Time & Sales: Enable/Disable time and sales panel.
Timezone offset (hours): Enter your time zone\'s offset (+ or −), including a decimal fraction if needed.
Order Size: Set order size filter. Orders smaller than the value are not displayed.
🔶 THANKS
Hi, I'm makit0 coder of this tool and proud member of the LuxAlgo Opensource team, it's an honor to be part of the LuxAlgo family doing something I love as it's writing opensource code and sharing it with the world. I'd like to thank all of you who use, comment on, and vote for all of our open-source tools, and all of you who give us your support.
And of course thanks to the PineCoders family for all the work in front of and behind the scenes that makes the PineScript community what it is, simply the best.
Peace, Love & PineScript!

Intellect_city - Halvings Bitcoin CycleWhat is halving?
The halving timer shows when the next Bitcoin halving will occur, as well as the dates of past halvings. This event occurs every 210,000 blocks, which is approximately every 4 years. Halving reduces the emission reward by half. The original Bitcoin reward was 50 BTC per block found.
Why is halving necessary?
Halving allows you to maintain an algorithmically specified emission level. Anyone can verify that no more than 21 million bitcoins can be issued using this algorithm. Moreover, everyone can see how much was issued earlier, at what speed the emission is happening now, and how many bitcoins remain to be mined in the future. Even a sharp increase or decrease in mining capacity will not significantly affect this process. In this case, during the next difficulty recalculation, which occurs every 2014 blocks, the mining difficulty will be recalculated so that blocks are still found approximately once every ten minutes.
How does halving work in Bitcoin blocks?
The miner who collects the block adds a so-called coinbase transaction. This transaction has no entry, only exit with the receipt of emission coins to your address. If the miner's block wins, then the entire network will consider these coins to have been obtained through legitimate means. The maximum reward size is determined by the algorithm; the miner can specify the maximum reward size for the current period or less. If he puts the reward higher than possible, the network will reject such a block and the miner will not receive anything. After each halving, miners have to halve the reward they assign to themselves, otherwise their blocks will be rejected and will not make it to the main branch of the blockchain.
The impact of halving on the price of Bitcoin
It is believed that with constant demand, a halving of supply should double the value of the asset. In practice, the market knows when the halving will occur and prepares for this event in advance. Typically, the Bitcoin rate begins to rise about six months before the halving, and during the halving itself it does not change much. On average for past periods, the upper peak of the rate can be observed more than a year after the halving. It is almost impossible to predict future periods because, in addition to the reduction in emissions, many other factors influence the exchange rate. For example, major hacks or bankruptcies of crypto companies, the situation on the stock market, manipulation of “whales,” or changes in legislative regulation.
---------------------------------------------
Table - Past and future Bitcoin halvings:
---------------------------------------------
Date: Number of blocks: Award:
0 - 03-01-2009 - 0 block - 50 BTC
1 - 28-11-2012 - 210000 block - 25 BTC
2 - 09-07-2016 - 420000 block - 12.5 BTC
3 - 11-05-2020 - 630000 block - 6.25 BTC
4 - 20-04-2024 - 840000 block - 3.125 BTC
5 - 24-03-2028 - 1050000 block - 1.5625 BTC
6 - 26-02-2032 - 1260000 block - 0.78125 BTC
7 - 30-01-2036 - 1470000 block - 0.390625 BTC
8 - 03-01-2040 - 1680000 block - 0.1953125 BTC
9 - 07-12-2043 - 1890000 block - 0.09765625 BTC
10 - 10-11-2047 - 2100000 block - 0.04882813 BTC
11 - 14-10-2051 - 2310000 block - 0.02441406 BTC
12 - 17-09-2055 - 2520000 block - 0.01220703 BTC
13 - 21-08-2059 - 2730000 block - 0.00610352 BTC
14 - 25-07-2063 - 2940000 block - 0.00305176 BTC
15 - 28-06-2067 - 3150000 block - 0.00152588 BTC
16 - 01-06-2071 - 3360000 block - 0.00076294 BTC
17 - 05-05-2075 - 3570000 block - 0.00038147 BTC
18 - 08-04-2079 - 3780000 block - 0.00019073 BTC
19 - 12-03-2083 - 3990000 block - 0.00009537 BTC
20 - 13-02-2087 - 4200000 block - 0.00004768 BTC
21 - 17-01-2091 - 4410000 block - 0.00002384 BTC
22 - 21-12-2094 - 4620000 block - 0.00001192 BTC
23 - 24-11-2098 - 4830000 block - 0.00000596 BTC
24 - 29-10-2102 - 5040000 block - 0.00000298 BTC
25 - 02-10-2106 - 5250000 block - 0.00000149 BTC
26 - 05-09-2110 - 5460000 block - 0.00000075 BTC
27 - 09-08-2114 - 5670000 block - 0.00000037 BTC
28 - 13-07-2118 - 5880000 block - 0.00000019 BTC
29 - 16-06-2122 - 6090000 block - 0.00000009 BTC
30 - 20-05-2126 - 6300000 block - 0.00000005 BTC
31 - 23-04-2130 - 6510000 block - 0.00000002 BTC
32 - 27-03-2134 - 6720000 block - 0.00000001 BTC

KillZones & Sessions [TradingFinder] Volume | Asia, London & NY🔵 Introduction
🟣 Session
The forex market operates 24 hours a day, 5 days a week, with only Saturdays and Sundays being off; traders often focus on one of the forex trading sessions instead of trying to trade in all markets 24 hours a day.
Trading sessions are time intervals during which a specific financial market is active and trades are conducted. The Asia, London, and New York sessions are the most important trading sessions throughout the 24-hour period, during which a significant amount of money and liquidity enters the market.
🟣 Kill Zone
Traders in financial markets profit from the difference between the price at which they buy or sell and the current market price. Traders have different time horizons for trading.
Among these, some traders engage in daily or even hourly trading and must operate during times when the market has desirable trading volumes and significant price movements.
Kill zones are segments of a session with higher trading volumes and price fluctuations compared to the rest of the session.
🔵 How to Use
🟣 Session Time
The "Asia Session" consists of two sessions: "Sydney" and "Tokyo." The beginning of this session, according to the "UTC" time zone, is at 23:00 and ends at 06:00. Similarly, the beginning of the "Asia KillZone," according to the "UTC" time zone, is at 23:00, and it ends at 03:55.
The "London Session" consists of two sessions: "Frankfurt" and "London." The beginning of this session, according to the "UTC" time zone, is at 07:00, and it ends at 14:25. Similarly, the beginning of the "London KillZone," according to the "UTC" time zone, is at 07:00, and it ends at 09:55.
The beginning of the "New York am" session, according to the "UTC" time zone, is at 14:30, and it ends at 19:25. Similarly, the beginning of the "New York am KillZone," according to the "UTC" time zone, is at 14:30, and it ends at 16:55.
The beginning of the "New York pm" session, according to the "UTC" time zone, is at 19:30, and it ends at 22:55. Similarly, the beginning of the "New York pm KillZone," according to the "UTC" time zone, is at 19:30, and it ends at 20:55.
Important : To prevent session overlap, the working hours of each session have slightly changed.
🔵 Features
🟣 Simultaneous Session and Kill Zone
With this indicator, you can simultaneously view the kill zone and session. High and low lines are used to indicate sessions, while filled areas with color represent kill zones. If you do not want to see kill zones, you can turn off the display settings.
🟣 Candle, Time, and Volume
Using the "More Info" feature, you can see the number of candles, elapsed time, and traded volume within the colored filled area.
🔵 Settings
•Show More Info: To display "More Info," you need to turn on this feature and turn it off whenever you don't need it.
• You can also customize these settings for each session separately :
o Display or hide session.
o Choose session color.
o Set session time range.
o Display or hide kill zone.
o Set kill zone time range.

Mxwll Price Action Suite [Mxwll]Introducing the Mxwll Price Action Suite!
The Mxwll Price Action Suite is an all-in-one analysis indicator incorporating elements of SMC and also ideas extending beyond the trading methodology!
Features
Internal structures
External structures
Customizable Sensitivities
BoS/CHoCH
Order Blocks
HH/LH/LL/LH Areas
Rolling TF highs/lows
Rolling Volume Comparisons
Auto Fibs
And more!
The image above shows the indicator's market structure identification capabilities. Internal BoS and CHoCH structures in addition to overarching market structures are available with customizable sensitivities.
The image above shows the indicator identifying order blocks! Additionally, HH/LH/LL/LH areas are also identified.
The image above shows a rolling area of interest. These areas can be compared to supply/demand zones, where traders might consider a bargain long/short/sell area.
The indicator displays a rolling 4hr high/low and 1D high/low, alongside auto fibonacci levels with a customizable sensitivity.
Finally, the Mxwll Price Action Suite shows relevant session information.
Table information
Current Session
Countdown to session close
Next Session
Countdown to next session open
Rolling 4-Hr volume intensity
Rolling 24-Hr volume intensity
Introducing the Mxwll SMC Suite!
The Mxwll SMC Suite is an all-in-one analysis indicator incorporating elements of SMC and also ideas extending beyond the trading methodology!
Features
Internal structures
External structures
Customizable Sensitivities
BoS/CHoCH
Order Blocks
HH/LH/LL/LH Areas
Rolling TF highs/lows
Rolling Volume Comparisons
Auto Fibs
And more!
The image above shows the indicator's market structure identification capabilities. Internal BoS and CHoCH structures in addition to overarching market structures are available with customizable sensitivities.
The image above shows the indicator identifying order blocks! Additionally, HH/LH/LL/LH areas are also identified.
The image above shows a rolling area of interest. These areas can be compared to supply/demand zones, where traders might consider a bargain long/short/sell area.
The indicator displays a rolling 4hr high/low and 1D high/low, alongside auto fibonacci levels with a customizable sensitivity.
Finally, the Mxwll Price Action Suite shows relevant session information.
Table information
Current Session
Countdown to session close
Next Session
Countdown to next session open
Rolling 4-Hr volume intensity
Rolling 24-Hr volume intensity
Expanded Features of Mxwll Price Action Suite
Internal and External Structures
Internal Structures: These elements refer to the price formations and patterns that occur within a smaller scope or a specific trading session. The suite can detect intricate details like minor support/resistance levels or short-term trend reversals.
External Structures: These involve larger, more significant market patterns and trends spanning multiple sessions or time frames. This capability helps traders understand overarching market directions.
Customizable Sensitivities
Adjusting sensitivity settings allows users to tailor the indicator's responsiveness to market changes. Higher sensitivity can catch smaller fluctuations, while lower sensitivity might focus on more significant, reliable market moves.
Break of Structure (BoS) and Change of Character (CHoCH)
BoS: This feature identifies points where the price breaks a significant structure, potentially indicating a new trend or a trend reversal.
CHoCH: Detects subtle shifts in the market's behavior, which could suggest the early stages of a trend change before they become apparent to the broader market.
Order Blocks and Market Phases
Order Blocks: These are essentially price levels or zones where significant trading activities previously occurred, likely pointing to the positions of smart money.
HH/LH/LL/LH Areas: Identifying Higher Highs (HH), Lower Highs (LH), Lower Lows (LL), and Lower Highs (LH) helps in understanding the trend and market structure, aiding in predictive analysis.
Rolling Timeframe Highs/Lows and Volume Comparisons
Tracks highs and lows over specified rolling periods, providing dynamic support and resistance levels.
Compares volume data across different timeframes to assess the strength or weakness of the current price movements.
Auto Fibonacci Levels
Automatically calculates and plots Fibonacci retracement levels, a popular tool among traders to identify potential reversal points based on past movements.
Session Data and Volume Intensity
Session Information: Displays current and upcoming trading sessions along with countdown timers, which is crucial for day traders and those trading on session overlaps.
Volume Intensity: Measures and compares the volume within the last 4 hours and 24 hours to gauge market activity and potential breakout/breakdown movements.
Visualizations and Practical Use
Dynamic Visuals: The suite provides dynamic visual aids, such as real-time updating of high/low markers and Fibonacci levels, which adjust as new data comes in. This feature is critical in fast-paced markets.
Strategic Entry/Exit Points: By identifying order blocks and using Fibonacci levels, traders can pinpoint strategic entry and exit points, maximizing potential returns.
Risk Management: Enhanced features like session countdowns and volume intensity help in better risk management by providing traders with more data on market sentiment and potential volatility.

SOLANA Performance & Volatility Analysis BB%Overview:
The script provides an in-depth analysis of Solana's performance and volatility. It showcases Solana's price, its inverse relationship, its own volatility, and even juxtaposes it against Bitcoin's 24-hour historical volatility. All of these are presented using the Bollinger Bands Percentage (BB%) methodology to normalise the price and volatility values between 0 and 1.
Key Components:
Inputs:
SOLANA PRICE (SOLUSD): The price of Solana.
SOLANA INVERSE (SOLUSDT.3S): The inverse of Solana's price.
SOLANA VOLATILITY (SOLUSDSHORTS): Volatility for Solana.
BITCOIN 24 HOUR HISTORICAL VOLATILITY (BVOL24H): Bitcoin's volatility over the past 24 hours.
BB Calculations:
The script uses the Bollinger Bands methodology to calculate the mean (SMA) and the standard deviation of the prices and volatilities over a certain period (default is 20 periods). The calculated upper and lower bands help in normalising the values to the range of 0 to 1.
Normalised Metrics Plotting:
For better visualisation and comparative analysis, the normalised values for:
Solana Price
Solana Inverse
Solana Volatility
Bitcoin 24hr Volatility
are plotted with steplines.
Band Plotting:
Bands are plotted at 20%, 40%, 60%, and 80% levels to serve as reference points. The area between the 40% and 60% bands is shaded to highlight the median region.
Colour Coding:
Different colours are used for easy differentiation:
Solana Price: Blue
Solana Inverse: Red
Solana Volatility: Green
Bitcoin 24hr Volatility: White
Licence & Creator:
The script adheres to the Mozilla Public Licence 2.0 and is credited to the author, "Volatility_Vibes".
Works well with Breaks and Retests with Volatility Stop

Futures Exchange SessionsIn the 24-hour trading of the futures market, this indicator provides the user with full customization concerning the most important factor: time. This indicator is centered around three main visualizations: labels, backgrounds, and lines that minimalistically allows the user to keep track of the many time intervals that occur during a futures market 24-hour trading cycle. It also artfully displays the previous days highs and lows. And everything can be individually toggled and configured so the user can get exactly what they want.
Labels
There are three main futures market sessions in a 24-hour period: the London, New York, and Asian Sessions. Each session is given an independent label for the open and close times. The six labels (LO, LC, NYO, NYC, AO, AC) can be individually toggled on or off, the label background color changed, the text switched between black or white, and the height can be lowered or raised. These customizations are intended to give the user full control of the session they are interested in at the moment.
Backgrounds
Backgrounds are the heart of this indicator. There are different colored transparent backgrounds for each of the futures sessions. So the user can clearly see the session they want to highlight without cluttering their chart and getting in the way of analyzing the candles.
If you are familiar with the London and New York killzones, these backgrounds are each individually configured.
If you are familiar with the Inner Circle Trader’s (ICT) NY Morning and Afternoon sessions, these are available. Also, most times weird price action occurs during the lunch hour of these sessions. The London and New York have a background for their respective lunch hours so the user is never caught of guard during these periods.
Lines
The markets are constantly looking for liquidity. To help the user see runs on liquidity, this indicator projects the previous days highs and lows on to the current day with a line and a price label. The line make it very easy to see where price may be headed. See the image below for the perfect example of this phenomenon. Each of the lines can be independently controlled by color, style, and width. And even the labels can be toggled on or off if the user would prefer just to see the lines. Lastly, there is a line that marks the midnight open price in EST.
Special Notes
This indicator is specifically designed for futures tickers.
All of the backgrounds are not designed to be turned on a once (there are many that overlap). They are designed to give the user ultimate control over exactly what timeframe backgrounds to display on their charts.
The labels only appear when timeframe is 1 hour or less.

Relative Volume (rVol), Better Volume, Average Volume ComparisonThis is the best version of relative volume you can find a claim which is based on the logical soundness of its calculation.
I have amalgamated various volume analysis into one synergistic script. I wasn't going to opensource it. But, as one of the lucky few winners of TradingClue 2. I felt obligated to give something back to the community.
Relative volume traditionally compares current volume to prior bar volume or SMA of volume. This has drawbacks. The question of relative volume is "Volume relative to what?" In the traditional scripts you'll find it displays current volume relative to the last number of bars. But, is that the best way to compare volume. On a daily chart, possibly. On a daily chart this can work because your units of time are uniform. Each day represents a full cycle of volume. However, on an intraday chart? Not so much.
Example: If you have a lookback of 9 on an hourly chart in a 24 hour market, you are then comparing the average volume from Midnight - 9 AM to the 9 AM volume. What do you think you'll find? Well at 9:30 when NY exchanges open the volume should be consistently and predictably higher. But though rVol is high relative to the lookback period, its actually just average or maybe even below average compared to prior NY session opens. But prior NY session opens are not included in the lookback and thus ignored.
This problem is the most visibly noticed when looking at the volume on a CME futures chart or some equivalent. In a 24 hour market, such as crypto, there are website's like skew can show you the volume disparity from time of day. This led me to believe that the traditional rVol calculation was insufficient. A better way to calculate it would be to compare the 9:30 am 30m bar today to the last week's worth of 9:30 am 30m bars. Then I could know whether today's volume at 9:30 am today is high or low based on prior 9:30 am bars. This seems to be a superior method on an intraday basis and is clearly superior in markets with irregular volume
This led me to other problems, such as markets that are open for less than 24 hours and holiday hours on traditional market exchanges. How can I know that the script is accurately looking at the correct prior relevant bars. I've created and/or adapted solutions to all those problems and these calculations and code snippets thus have value that extend beyond this rVol script for other pinecoders.
The Script
This rVol script looks back at the bars of the same time period on the viewing timeframe. So, as we said, the last 9:30 bars. Averages those, then divides the: . The result is a percentage expressed as x.xxx. Thus 1.0 mean current volume is equal to average volume. Below 1.0 is below the average and above 1.0 is above the average.
This information can be viewed on its own. But there are more levels of analysis added to it.
Above the bars are signals that correlate to the "Better Volume Indicator" developed by, I believe, the folks at emini-watch and originally adapted to pinescript by LazyBear. The interpretation of these symbols are in a table on the right of the indicator.
The volume bars can also be colored. The color is defined by the relationship between the average of the rVol outputs and the current volume. The "Average rVol" so to speak. The color coding is also defined by a legend in the table on the right.
These can be researched by you to determine how to best interpret these signals. I originally got these ideas and solid details on how to use the analysis from a fellow out there, PlanTheTrade.
I hope you find some value in the code and in the information that the indicator presents. And I'd like to thank the TradingView team for producing the most innovative and user friendly charting package on the market.
(p.s. Better Volume is provides better information with a longer lookback value than the default imo)
Credit for certain code sections and ideas is due to:
LazyBear - Better Volume
Grimmolf (From GitHub) - Logic for Loop rVol
R4Rocket - The idea for my rVol 1 calculation
And I can't find the guy who had the idea for the multiples of volume to the average. Tag him if you know him
Final Note: I'd like to leave a couple of clues of my own for fellow seekers of trading infamy.
Indicators: indicators are like anemometers (The things that measure windspeed). People talk bad about them all the time because they're "lagging." Well, you can't tell what the windspeed is unless the wind is blowing. anemometers are lagging indicators of wind. But forecasters still rely on them. You would use an indicator, which I would define as a instrument of measure, to tell you the windspeed of the markets. Conversely, when people talk positively about indicators they say "This one is great and this one is terrible." This is like a farmer saying "Shovels are great, but rakes are horrible." There are certain tools that have certain functions and every good tool has a purpose for a specific job. So the next time someone shares their opinion with you about indicators. Just smile and nod, realizing one day they'll learn... hopefully before they go broke.
How to forecast: Prediction is accomplished by analyzing the behavior of instruments of measure to aggregate data (using your anemometer). The data is then assembled into a predictive model based on the measurements observed (a trading system). That predictive model is tested against reality for it's veracity (backtesting). If the model is predictive, you can optimize your decision making by creating parameter sets around the prediction that are synergistic with the implications of the prediction (risk, stop loss, target, scaling, pyramiding etc).
<3

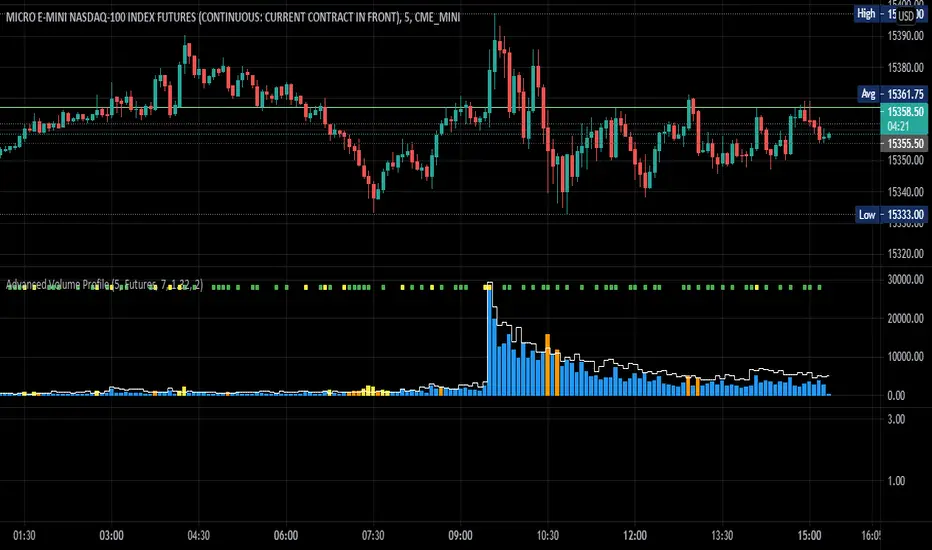
Advanced Volume ProfileTHIS SCRIPT CURRENTLY ONLY WORKS FOR ASSETS THAT TRADE 24/7 OR CBOE FUTURES HOURS!
This script plots volume relative to an asset's historical volume profile.
Usage:
As a companion to my "Unusual Time Frame Volume" (UTF Volume) script, this plots volume against the same historical volume profile used for UTF Volume.
The same high volume (relative to historical) threshold alert is available (yellow bar).
Likewise, if the volume exceeds the historical threshold, but is below the alert threshold, the bar color is orange.
At the top of the chart is an indicator which is green if a bar has higher volume than the previous bar.
You can also set a threshold for this such that if the volume of a bar exceeds the previous bar by a certain multiplier which will turn the indicator yellow.
For example, if the threshold is set to "1.5", then the indicator will be yellow (instead of green) on an increase in volume over the previous bar of 1.5x.
NOTES:
Again, this script currently only works for assets that trade 24/7 or CBOE Futures hours!
Make sure you set the "Asset Mode" and "Time Frame (minutes)" to values that match your asset and chart setting.
For example, if you are trading Futures on a 2m chart, set the Asset Mode to Futures and Time Frame to 2m.
If you are trading crypto on a 5m chart, set the Asset Mode to 24/7 and Time Frame to 5m.
If the settings are not set appropriately, the output will be incorrect/invalid.
If you choose a "Look-back (Days)" setting that is too far back given the time frame, the script will produce an error.
I suggest playing with settings from "1" (compares volume to the previous day's volume) to the highest number that doesn't break the script.
For example, at a 2m time frame, the maximum look-back will be "6" or "7" depending on which mode you are using.
Longer chart time settings allow larger look-back values.
I find that the default value ("6") does a decent job in general.
Please feel free to reuse or further develop this script.
I would greatly appreciate it if you would send me a message below if you find it useful.
Bar Balance [LucF]Bar Balance extracts the number of up, down and neutral intrabars contained in each chart bar, revealing information on the strength of price movement. It can display stacked columns representing raw up/down/neutral intrabar counts, or an up/down balance line which can be calculated and visualized in many different ways.
WARNING: This is an analysis tool that works on historical bars only. It does not show any realtime information, and thus cannot be used to issue alerts or for automated trading. When realtime bars elapse, the indicator will require a browser refresh, a change to its Inputs or to the chart's timeframe/symbol to recalculate and display information on those elapsed bars. Once a trader understands this, the indicator can be used advantageously to make discretionary trading decisions.
Traders used to work with my Delta Volume Columns Pro will feel right at home in this indicator's Inputs . It has lots of options, allowing it to be used in many different ways. If you value the bar balance information this indicator mines, I hope you will find the time required to master the use of Bar Balance well worth the investment.
█ OVERVIEW
The indicator has two modes: Columns and Line .
Columns
• In Columns mode you can display stacked Up/Down/Neutral columns.
• The "Up" section represents the count of intrabars where `close > open`, "Down" where `close < open` and "Neutral" where `close = open`.
• The Up section always appears above the centerline, the Down section below. The Neutral section overlaps the centerline, split halfway above and below it.
The Up and Down sections start where the Neutral section ends, when there is one.
• The Up and Down sections can be colored independently using 7 different methods.
• The signal line plotted in Line mode can also be displayed in Columns mode.
Line
• Displays a single balance line using a zero centerline.
• A variable number of independent methods can be used to calculate the line (6), determine its color (5), and color the fill (5).
You can thus evaluate the state of 3 different components with this single line.
• A "Divergence Levels" feature will use the line to automatically draw expanding levels on divergence events.
Features available in both modes
• The color of all components can be selected from 15 base colors, with 16 gradient levels used for each base color in the indicator's gradients.
• A zero line can show a 6-state aggregate value of the three main volume balance modes.
• The background can be colored using any of 5 different methods.
• Chart bars can be colored using 5 different methods.
• Divergence and large neutral count ratio events can be shown in either Columns or Line mode, calculated in one of 4 different methods.
• Markers on 6 different conditions can be displayed.
█ CONCEPTS
Intrabar inspection
Intrabar inspection means the indicator looks at lower timeframe bars ( intrabars ) making up a given chart bar to gather its information. If your chart is on a 1-hour timeframe and the intrabar resolution determined by the indicator is 5 minutes, then 12 intrabars will be analyzed for each chart bar and the count of up/down/neutral intrabars among those will be tallied.
Bar Balances and calculation methods
The indicator uses a variety of methods to evaluate bar balance and to derive other calculations from them:
1. Balance on Bar : Uses the relative importance of instant Up and Down counts on the bar.
2. Balance Averages : Uses the difference between the EMAs of Up and Down counts.
3. Balance Momentum : Starts by calculating, separately for both Up and Down counts, the difference between the same EMAs used in Balance Averages and an SMA of double the period used for the EMAs. These differences are then aggregated and finally, a bounded momentum of that aggregate is calculated using RSI.
4. Markers Bias : It sums the bull/bear occurrences of the four previous markers over a user-defined period (the default is 14).
5. Combined Balances : This is the aggregate of the instant bull/bear bias of the three main bar balances.
6. Dual Up/Down Averages : This is a display mode showing the EMA calculated for each of the Up and Down counts.
Interpretation of neutral intrabars
What do neutral intrabars mean? When price does not change during a bar, it can be because there is simply no interest in the market, or because of a perfect balance between buyers and sellers. The latter being more improbable, Bar Balance assumes that neutral bars reveal a lack of interest, which entails uncertainty. That is the reason why the option is provided to interpret ratios of neutral intrabars greater than 50% as divergences. It is also the rationale behind the option to dampen signal lines on the inverse ratio of neutral intrabars, so that zero intrabars do not affect the signal, and progressively larger proportions of neutral intrabars will reduce the signal's amplitude, as the balance calcs using the up/down counts lose significance. The impact of the dampening will vary with markets. Weaker markets such as cryptos will often contain greater numbers of neutral intrabars, so dampening the Line in that sector will have a greater impact than in more liquid markets.
█ FEATURES
1 — Columns
• While the size of the Up/Down columns always represents their respective importance on the bar, their coloring mode is independent. The default setup uses a standard coloring mode where the Up/Down columns over/under the zero line are always in the bull/bear color with a higher intensity for the winning side. Six other coloring modes allow you to pack more information in the columns. When choosing to color the top columns using a bull/bear gradient on Balance Averages, for example, you will end up with bull/bear colored tops. In order for the color of the bottom columns to continue to show the instant bar balance, you can then choose the "Up/Down Ratio on Bar — Dual Solid Colors" coloring mode to make those bars the color of the winning side for that bar.
• Line mode shows only the line, but Columns mode allows displaying the line along with it. If the scale of the line is different than that of the scale of the columns, the line will often appear flat. Traders may find even a flat line useful as its bull/bear colors will be easily distinguishable.
2 — Line
• The default setup for Line mode uses a calculation on "Balance Momentum", with a fill on the longer-term "Balance Averages" and a line color based on the "Markers Bias". With the background set on "Line vs Divergence Levels" and the zero line on the hard-coded "Combined Bar Balances", you have access to five distinct sources of information at a glance, to which you can add divergences, divergences levels and chart bar coloring. This provides powerful potential in displaying bar balance information.
• When no columns are displayed, Line mode can show the full scale of whichever line you choose to calculate because the columns' scale no longer interferes with the line's scale.
• Note that when "Balance on Bar" is selected, the Neutral count is also displayed as a ratio of the balance line. This is the only instance where the Neutral count is displayed in Line mode.
• The "Dual Up/Down Averages" is an exception as it displays two lines: one average for the Up counts and another for the Down counts. This mode will be most useful when Columns are also displayed, as it provides a reference for the top and bottom columns.
3 — Zero Line
The zero line can be colored using two methods, both based on the Combined Balances, i.e., the aggregate of the instant bull/bear bias of the three main bar balances.
• In "Six-state Dual Color Gradient" mode, a dot appears on every bar. Its color reflects the bull/bear state of the Combined Balances, and the dot's brightness reflects the tally of balance biases.
• In "Dual Solid Colors (All Bull/All Bear Only)" a dot only appears when all three balances are either bullish or bearish. The resulting pattern is identical to that of Marker 1.
4 — Divergences
• Divergences are displayed as a small circle at the top of the scale. Four different types of divergence events can be detected. Divergences occur whenever the bull/bear bias of the method used diverges with the bar's price direction.
• An option allows you to include in divergence events instances where the count of neutral intrabars exceeds 50% of the total intrabar count.
• The divergence levels are dynamic levels that automatically build from the line's values on divergence events. On consecutive divergences, the levels will expand, creating a channel. This implementation of the divergence levels corresponds to my view that divergences indicate anomalies, hesitations, points of uncertainty if you will. It excludes any association of a pre-determined bullish/bearish bias to divergences. Accordingly, the levels merely take note of divergence events and mark those points in time with levels. Traders then have a reference point from which they can evaluate further movement. The bull/bear/neutral colors used to plot the levels are also congruent with this view in that they are determined by price's position relative to the levels, which is how I think divergences can be put to the most effective use.
5 — Background
• The background can show a bull/bear gradient on four different calculations. You can adjust its brightness to make its visual importance proportional to how you use it in your analysis.
6 — Chart bars
• Chart bars can be colored using five different methods.
• You have the option of emptying the body of bars where volume does not increase, as does my TLD indicator, the idea behind this being that movement on bars where volume does not increase is less relevant.
7 — Intrabar Resolution
You can choose between three modes. Two of them are automatic and one is manual:
a) Fast, Longer history, Auto-Steps (~12 intrabars) : Optimized for speed and deeper history. Uses an average minimum of 12 intrabars.
b) More Precise, Shorter History Auto-Steps (~24 intrabars) : Uses finer intrabar resolution. It is slower and provides less history. Uses an average minimum of 24 intrabars.
c) Fixed : Uses the fixed resolution of your choice.
Auto-Steps calculations vary for 24/7 and conventional markets in order to achieve the proper target of minimum intrabars.
You can choose to view the intrabar resolution currently used to calculate delta volume. It is the default.
The proper selection of the intrabar resolution is important. It must achieve maximal granularity to produce precise results while not unduly slowing down calculations, or worse, causing runtime errors.
8 — Markers
Six markers are available:
1. Combined Balances Agreement : All three Bar Balances are either bullish or bearish.
2. Up or Down % Agrees With Bar : An up marker will appear when the percentage of up intrabars in an up chart bar is greater than the specified percentage. Conditions mirror to down bars.
3. Divergence confirmations By Price : One of the four types of balance calculations can be used to detect divergences with price. Confirmations occur when the bar following the divergence confirms the balance bias. Note that the divergence events used here do not include neutral intrabar events.
4. Balance Transitions : Bull/bear transitions of the selected balance.
5. Markers Bias Transitions : Bull/bear transitions of the Markers Bias.
6. Divergence Confirmations By Line : Marks points where the line first breaches a divergence level.
Markers appear when the condition is detected, without delay. Since nothing is plotted in realtime, markers do not appear on the realtime bar.
9 — Settings
• Two modes can be selected to dampen the line on the ratio of neutral intrabars.
• A distinct weight can be attributed to the count of the latter half of intrabars, on the assumption that later intrabars may be more important in determining the outcome of chart bars.
• Allows control over the periods of the different moving averages used in calculations.
• The default periods used for the various calculations define the following hierarchy from slow to fast:
Balance Averages: 50,
Balance Momentum: 20,
Dual Up/Down Averages: 20,
Marker Bias: 10.
█ LIMITATIONS
• This script uses a special characteristic of the `security()` function allowing the inspection of intrabars—which is not officially supported by TradingView.
• The method used does not work on the realtime bar—only on historical bars.
• The indicator only works on some chart resolutions: 3, 5, 10, 15 and 30 minutes, 1, 2, 4, 6, and 12 hours, 1 day, 1 week and 1 month. The script’s code can be modified to run on other resolutions, but chart resolutions must be divisible by the lower resolution used for intrabars and the stepping mechanism could require adaptation.
• When using the "Line vs Divergence Levels — Dual Color Gradient" color mode to fill the line, background or chart bars, keep in mind that a line calculation mode must be defined for it to work, as it determines gradients on the movement of the line relative to divergence levels. If the line is hidden, it will not work.
• When the difference between the chart’s resolution and the intrabar resolution is too great, runtime errors will occur. The Auto-Steps selection mechanisms should avoid this.
• Alerts do not work reliably when `security()` is used at intrabar resolutions. Accordingly, no alerts are configured in the indicator.
• The color model used in the indicator provides for fancy visuals that come at a price; when you change values in Inputs , it can take 20 seconds for the changes to materialize. Luckily, once your color setup is complete, the color model does not have a large performance impact, as in normal operation the `security()` calls will become the most important factor in determining response time. Also, once in a while a runtime error will occur when you change inputs. Just making another change will usually bring the indicator back up.
█ RAMBLINGS
Is this thing useful?
I'll let you decide. Bar Balance acts somewhat like an X-Ray on bars. The intrabars it analyzes are no secret; one can simply change the chart's resolution to see the same intrabars the indicator uses. What the indicator brings to traders is the precise count of up/down/neutral intrabars and, more importantly, the calculations it derives from them to present the information in a way that can make it easier to use in trading decisions.
How reliable is Bar Balance information?
By the same token that an up bar does not guarantee that more up bars will follow, future price movements cannot be inferred from the mere count of up/down/neutral intrabars. Price movement during any chart bar for which, let's say, 12 intrabars are analyzed, could be due to only one of those intrabars. One can thus easily see how only relying on bar balance information could be very misleading. The rationale behind Bar Balance is that when the information mined for multiple chart bars is aggregated, it can provide insight into the history behind chart bars, and thus some bias as to the strength of movements. An up chart bar where 11/12 intrabars are also up is assumed to be stronger than the same up bar where only 2/12 intrabars are up. This logic is not bulletproof, and sometimes Bar Balance will stray. Also, keep in mind that balance lines do not represent price momentum as RSI would. Bar Balance calculations have no idea where price is. Their perspective, like that of any historian, is very limited, constrained that it is to the narrow universe of up/down/neutral intrabar counts. You will thus see instances where price is moving up while Balance Momentum, for example, is moving down. When Bar Balance performs as intended, this indicates that the rally is weakening, which does necessarily imply that price will reverse. Occasionally, price will merrily continue to advance on weakening strength.
Divergences
Most of the divergence detection methods used here rely on a difference between the bias of a calculation involving a multi-bar average and a given bar's price direction. When using "Bar Balance on Bar" however, only the bar's balance and price movement are used. This is the default mode.
As usual, divergences are points of interest because they reveal imbalances, which may or may not become turning points. I do not share the overwhelming enthusiasm traders have for the purported ability of bullish/bearish divergences to indicate imminent reversals.
Superfluity
In "The Bed of Procrustes", Nassim Nicholas Taleb writes: To bankrupt a fool, give him information . Bar Balance can display lots of information. While learning to use a new indicator inevitably requires an adaptation period where we put it through its paces and try out all its options, once you have become used to Bar Balance and decide to adopt it, rigorously eliminate the components you don't use and configure the remaining ones so their visual prominence reflects their relative importance in your analysis. I tried to provide flexible options for traders to control this indicator's visuals for that exact reason—not for window dressing.
█ NOTES
For traders
• To avoid misleading traders who don't read script descriptions, the indicator shows nothing in the realtime bar.
• The Data Window shows key values for the indicator.
• All gradients used in this indicator determine their brightness intensities using advances/declines in the signal—not their relative position in a fixed scale.
• Note that because of the way gradients are optimized internally, changing their brightness will sometimes require bringing down the value a few steps before you see an impact.
• Because this indicator does not use volume, it will work on all markets.
For coders
• For those interested in gradients, this script uses an advanced version of the Advance/Decline gradient function from the PineCoders Color Gradient (16 colors) Framework . It allows more precise control over the range, steps and min/max values of the gradients.
• I use the PineCoders Coding Conventions for Pine to write my scripts.
• I used functions modified from the PineCoders MTF Selection Framework for the selection of timeframes.
█ THANKS TO:
— alexgrover who helped me think through the dampening method used to attenuate signal lines on high ratios of neutral intrabars.
— A guy called Kuan who commented on a Backtest Rookies presentation of their Volume Profile indicator . The technique I use to inspect intrabars is derived from Kuan's code.
— theheirophant , my partner in the exploration of the sometimes weird abysses of `security()`’s behavior at intrabar resolutions.
— midtownsk8rguy , my brilliant companion in mining the depths of Pine graphics. He is also the co-author of the PineCoders Color Gradient Frameworks .

Price Action and 3 EMAs Momentum plus Sessions FilterThis indicator plots on the chart the parameters and signals of the Price Action and 3 EMAs Momentum plus Sessions Filter Algorithmic Strategy. The strategy trades based on time-series (absolute) and relative momentum of price close, highs, lows and 3 EMAs.
I am still learning PS and therefore I have only been able to write the indicator up to the Signal generation. I plan to expand the indicator to Entry Signals as well as the full Strategy.
The strategy works best on EURUSD in the 15 minutes TF during London and New York sessions with 1 to 1 TP and SL of 30 pips with lots resulting in 3% risk of the account per trade. I have already written the full strategy in another language and platform and back tested it for ten years and it was profitable for 7 of the 10 years with average profit of 15% p.a which can be easily increased by increasing risk per trade. I have been trading it live in that platform for over two years and it is profitable.
Contributions from experienced PS coders in completing the Indicator as well as writing the Strategy and back testing it on Trading View will be appreciated.
STRATEGY AND INDICATOR PARAMETERS
Three periods of 12, 48 and 96 in the 15 min TF which are equivalent to 3, 12 and 24 hours i.e (15 min * period / 60 min) are the foundational inputs for all the parameters of the PA & 3 EMAs Momentum + SF Algo Strategy and its Indicator.
3 EMAs momentum parameters and conditions
• FastEMA = ema of 12 periods
• MedEMA = ema of 48 periods
• SlowEMA = ema of 96 periods
• All the EMAs analyse price close for up to 96 (15 min periods) equivalent to 24 hours
• There’s Upward EMA momentum if price close > FastEMA and FastEMA > MedEMA and MedEMA > SlowEMA
• There’s Downward EMA momentum if price close < FastEMA and FastEMA < MedEMA and MedEMA < SlowEMA
PA momentum parameters and conditions
• HH = Highest High of 48 periods from 1st closed bar before current bar
• LL = Lowest Low of 48 periods from 1st closed bar from current bar
• Previous HH = Highest High of 84 periods from 12th closed bar before current bar
• Previous LL = Lowest Low of 84 periods from 12th closed bar before current bar
• All the HH & LL and prevHH & prevLL are within the 96 periods from the 1st closed bar before current bar and therefore indicative of momentum during the past 24 hours
• There’s Upward PA momentum if price close > HH and HH > prevHH and LL > prevLL
• There’s Downward PA momentum if price close < LL and LL < prevLL and HH < prevHH
Signal conditions and Status (BuySignal, SellSignal or Neutral)
• The strategy generates Buy or Sell Signals if both 3 EMAs and PA momentum conditions are met for each direction and these occur during the London and New York sessions
• BuySignal if price close > FastEMA and FastEMA > MedEMA and MedEMA > SlowEMA and price close > HH and HH > prevHH and LL > prevLL and timeinrange (LDN&NY) else Neutral
• SellSignal if price close < FastEMA and FastEMA < MedEMA and MedEMA < SlowEMA and price close < LL and LL < prevLL and HH < prevHH and timeinrange (LDN&NY) else Neutral
Entry conditions and Status (EnterBuy, EnterSell or Neutral)(NOT CODED YET)
• ENTRY IS NOT AT THE SIGNAL BAR but at the current bar tick price retracement to FastEMA after the signal
• EnterBuy if current bar tick price <= FastEMA and current bar tick price > prevHH at the time of the Buy Signal
• EnterSell if current bar tick price >= FastEMA and current bar tick price > prevLL at the time of the Sell Signal

[BTX] Triple TRIX + MAsThis indicator suggest a strategy, which is quite similar to multiple MA or multiple RSI strategies.
This indicator can be used for all timeframes, all markets.
This indicator can help detect the market trend and momentum.
Default values are TRIX - 6, 12, and 24 periods and MA(8) for each TRIX line. You can choose what type of MA to be used (EMA or SMA).
How to exploit this indicator?
- When all of the lower TRIXs are ABOVE the higher one: TRIX(6) is above TRIX(12), and TRIX(12) is above TRIX(24), there is a BULLISH market.
- When all of the lower TRIXs are BELOW the higher one: TRIX(6) is below TRIX(12), and TRIX(12) is below TRIX(24), there is a BEARISH market.
- A crossover of the lower TRIX to the higher one indicates a BUY signal.
- A crossunder of the lower TRIX to the higher one indicates a SELL signal.
- TRIX crossover the Zero line can be considered as a STRONG bullish signal.
- TRIX crossunder the Zero line can be considered as a STRONG bearish signal.
- The MA of TRIX acts as a confirmation, it can be used as SELL signals.
- High slopes of TRIX lines can point out the high momentum of the current trend.
- Divergence patterns can be used with this indicator.
- And many more tricks.
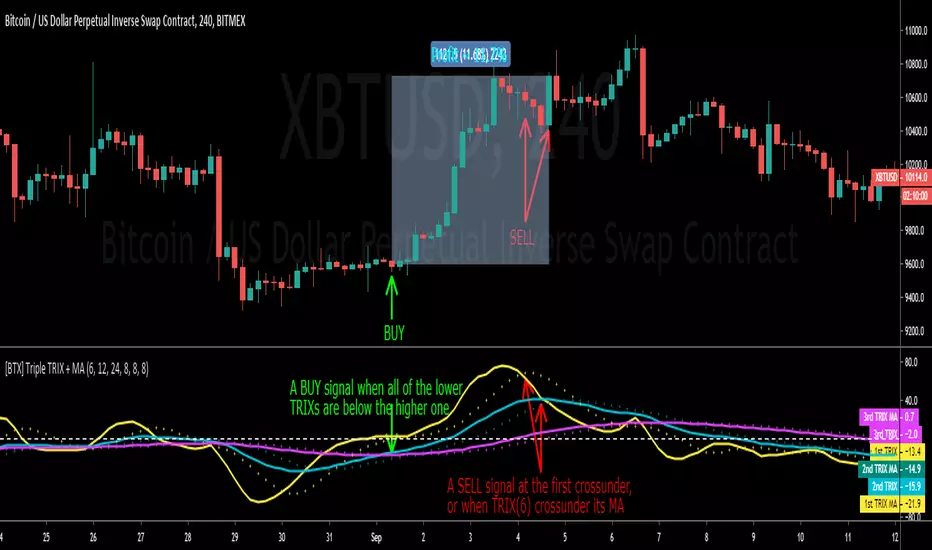
MTF CMO (Chande Momentum Oscillator)Simple Multi-Timeframe version of the Chande Momentum Oscillator . Many thanks to HPotter whos script I used as a starting point. This displays 1, 2, 3, 4, and 24 period CMOs on the graph. 1, 2, 3, and 4 periods are smoothed by using their simple moving averages. 24 period is unsmoothed. I prefer to set my chart to a 1 hour timeframe and look for bottoming or topping patterns in the momentum. Strongest topping or bottoming patterns are when all timeframes roll over including the 24 period.

Ease of Movement WatcherHere’s a handy Ease of Movement(EMV) Indicator. I tried to include detailed comments so that anyone that’s learning pine can follow along.
The Ease of Movement Indicator is a volume based oscillator that is designed to measure the ease (or movability) of price movement for a security. The EMV is a centered oscillator, meaning that values can fluctuate above and below zero.
To understand how to use and interpret the EMV Indicator, its crucial to first understand its two main calculations :
Distance Moved = ((high + low) / 2) - ((high + low ) / 2)
-This is the difference between the current period’s midpoint and the previous period’s
midpoint.
Box Ratio = (volume / 100,000) / (high - low)
-When calculating the Box Ratio, it is common to divide the volume by 100,000 for a clearer visualization of the data. However, users can choose
to modify this value with the ‘volumeDiv’ input.
The Ease of Movement Value is then pretty simple to calculate:
EMV = (Distance Moved / Box Ratio)
The indicator then plots a SMA of the previous 24 EMV Values.
Looking at the formula, we know that combining low volume with a large {high, low} range will result in a relatively small box ratio value. Thus, we know that the EMV value for that period will be higher since EMV is found by dividing the Distance Moved by the Box Ratio.
Here’s a simple guide to interpreting the EMV:
- If (EMV > 0)
then price is increasing with relative ease.
-If (EMV < 0)
then price is decreasing with relative ease.
- If high-low range is large and volume is low
then ease of movement is high.
-If high-low range is small and volume is high
then ease of movement is low.
The Chart:
-The histogram represents the Simple Moving Average of EMV Values. The default length is 24, but users can adjust this value at the inputs menu(I've
found 24 works best).
-The teal and pink dotted lines represent the standard deviation of the SMA of EMV values multiplied by 2.5.
-The histogram turns dark green when the EMV SMA is greater than the top teal dotted standard deviations line.
-The histogram turns maroon when the EMV SMA falls below the bottom pink standard deviation line.
How To Use:
Enter a long position when the most recent EMV SMA value was below the lower pink stand. dev. line and the current EMV SMA value rises above that
same pink line. That means the previous bar was maroon and the current bar is not.
If the user enables the option to show entry points, a green dot will be plotted when it is time to enter a long position.
Exit the long position when the most recent EMV SMA value was above the upper green standard deviation line and the current EMV SMA value falls
below that same line. If this is true, then the previous bar will be dark green, and the current will be light green.
If the ‘showExits’ option is enabled, then a red dot will be plotted when it is time to exit the long position.
Input Options:
- 'volumeDiv' : Integer. Used in the calculation of Box Ratio.
- 'lenSMA' : Integer. The length of the Simple Moving Average of Ease of Movement Values.
- 'showStDev' : Bool. If true, dotted green and red lines will be shown at values equal to 2.5 * standard deviation of emvSMA and -2.5 * standard deviation of
emvSMA.
- 'showEntries' and 'showExits' : Bool. If true, a green circle will be plotted at long entry points and a red circle will be plotted at long exit points.
- 'changeBgColor': Bool. If true, the background color will change to green when it is time to enter a long position and red when it is time to exit.
Alerts:
- When it is time to enter a long position, an alert with the message "EMV Tracker - Enter Long" is sent.
- When it is time to exit a long position, an alert with the message "EMV Tracker - Exit Long" is sent.
NOTE:
- I usually use this indicator to confirm signals from other indicators rather than relying on it solely.
- Most accurate signals are generated on 30 minutes with the default input values I've set in the script.
Shoot me a message if you have any ideas for modifications or questions.
~ Happy Trading ~
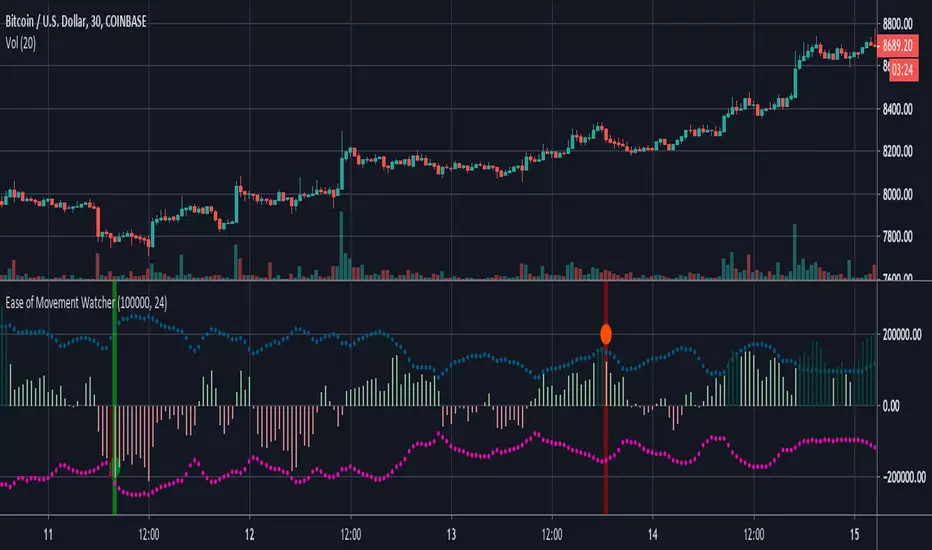
LibTmFrLibrary "LibTmFr"
This is a utility library for handling timeframes and
multi-timeframe (MTF) analysis in Pine Script. It provides a
collection of functions designed to handle common tasks related
to period detection, session alignment, timeframe construction,
and time calculations, forming a foundation for
MTF indicators.
Key Capabilities:
1. **MTF Period Engine:** The library includes functions for
managing higher-timeframe (HTF) periods.
- **Period Detection (`isNewPeriod`):** Detects the first bar
of a given timeframe. It includes custom logic to handle
multi-month and multi-year intervals where
`timeframe.change()` may not be sufficient.
- **Bar Counting (`sinceNewPeriod`):** Counts the number of
bars that have passed in the current HTF period or
returns the final count for a completed historical period.
2. **Automatic Timeframe Selection:** Offers functions for building
a top-down analysis framework:
- **Automatic HTF (`autoHTF`):** Suggests a higher timeframe
(HTF) for broader context based on the current timeframe.
- **Automatic LTF (`autoLTF`):** Suggests an appropriate lower
timeframe (LTF) for granular intra-bar analysis.
3. **Timeframe Manipulation and Comparison:** Includes tools for
working with timeframe strings:
- **Build & Split (`buildTF`, `splitTF`):** Functions to
programmatically construct valid Pine Script timeframe
strings (e.g., "4H") and parse them back into their
numeric and unit components.
- **Comparison (`isHigherTF`, `isActiveTF`, `isLowerTF`):**
A set of functions to check if a given timeframe is
higher, lower, or the same as the script's active timeframe.
- **Multiple Validation (`isMultipleTF`):** Checks if a
higher timeframe is a practical multiple of the current
timeframe. This is based on the assumption that checking
if recent, completed HTF periods contained more than one
bar is a valid proxy for preventing data gaps.
4. **Timestamp Interpolation:** Contains an `interpTimestamp()`
function that calculates an absolute timestamp by
interpolating at a given percentage across a specified
range of bars (e.g., 50% of the way through the last
20 bars), enabling time calculations at a resolution
finer than the chart's native bars.
---
**DISCLAIMER**
This library is provided "AS IS" and for informational and
educational purposes only. It does not constitute financial,
investment, or trading advice.
The author assumes no liability for any errors, inaccuracies,
or omissions in the code. Using this library to build
trading indicators or strategies is entirely at your own risk.
As a developer using this library, you are solely responsible
for the rigorous testing, validation, and performance of any
scripts you create based on these functions. The author shall
not be held liable for any financial losses incurred directly
or indirectly from the use of this library or any scripts
derived from it.
buildTF(quantity, unit)
Builds a Pine Script timeframe string from a numeric quantity and a unit enum.
The resulting string can be used with `request.security()` or `input.timeframe`.
Parameters:
quantity (int) : series int Number to specifie how many `unit` the timeframe spans.
unit (series TFUnit) : series TFUnit The size category for the bars.
Returns: series string A Pine-style timeframe identifier, e.g.
"5S" → 5-seconds bars
"30" → 30-minute bars
"120" → 2-hour bars
"1D" → daily bars
"3M" → 3-month bars
"24M" → 2-year bars
splitTF(tf)
Splits a Pine‑timeframe identifier into numeric quantity and unit (TFUnit).
Parameters:
tf (string) : series string Timeframe string, e.g.
"5S", "30", "120", "1D", "3M", "24M".
Returns:
quantity series int The numeric value of the timeframe (e.g., 15 for "15", 3 for "3M").
unit series TFUnit The unit of the timeframe (e.g., TFUnit.minutes, TFUnit.months).
Notes on strings without a suffix:
• Pure digits are minutes; if divisible by 60, they are treated as hours.
• An "M" suffix is months; if divisible by 12, it is converted to years.
autoHTF(tf)
Picks an appropriate **higher timeframe (HTF)** relative to the selected timeframe.
It steps up along a coarse ladder to produce sensible jumps for top‑down analysis.
Mapping → chosen HTF:
≤ 1 min → 60 (1h) ≈ ×60
≤ 3 min → 180 (3h) ≈ ×60
≤ 5 min → 240 (4h) ≈ ×48
≤ 15 min → D (1 day) ≈ ×26–×32 (regular session 6.5–8 h)
> 15 min → W (1 week) ≈ ×64–×80 for 30m; varies with input
≤ 1 h → W (1 week) ≈ ×32–×40
≤ 4 h → M (1 month) ≈ ×36–×44 (~22 trading days / month)
> 4 h → 3M (3 months) ≈ ×36–×66 (e.g., 12h→×36–×44; 8h→×53–×66)
≤ 1 day → 3M (3 months) ≈ ×60–×66 (~20–22 trading days / month)
> 1 day → 12M (1 year) ≈ ×(252–264)/quantity
≤ 1 week → 12M (1 year) ≈ ×52
> 1 week → 48M (4 years) ≈ ×(208)/quantity
= 1 M → 48M (4 years) ≈ ×48
> 1 M → error ("HTF too big")
any → error ("HTF too big")
Notes:
• Inputs in months or years are restricted: only 1M is allowed; larger months/any years throw.
• Returns a Pine timeframe string usable in `request.security()` and `input.timeframe`.
Parameters:
tf (string) : series string Selected timeframe (e.g., "D", "240", or `timeframe.period`).
Returns: series string Suggested higher timeframe.
autoLTF(tf)
Selects an appropriate **lower timeframe LTF)** for intra‑bar evaluation
based on the selected timeframe. The goal is to keep intra‑bar
loops performant while providing enough granularity.
Mapping → chosen LTF:
≤ 1 min → 1S ≈ ×60
≤ 5 min → 5S ≈ ×60
≤ 15 min → 15S ≈ ×60
≤ 30 min → 30S ≈ ×60
> 30 min → 60S (1m) ≈ ×31–×59 (for 31–59 minute charts)
≤ 1 h → 1 (1m) ≈ ×60
≤ 2 h → 2 (2m) ≈ ×60
≤ 4 h → 5 (5m) ≈ ×48
> 4 h → 15 (15m) ≈ ×24–×48 (e.g., 6h→×24, 8h→×32, 12h→×48)
≤ 1 day → 15 (15m) ≈ ×26–×32 (regular sessions ~6.5–8h)
> 1 day → 60 (60m) ≈ ×(26–32) per day × quantity
≤ 1 week → 60 (60m) ≈ ×32–×40 (≈5 sessions of ~6.5–8h)
> 1 week → 240 (4h) ≈ ×(8–10) per week × quantity
≤ 1 M → 240 (4h) ≈ ×33–×44 (~20–22 sessions × 6.5–8h / 4h)
≤ 3 M → D (1d) ≈ ×(20–22) per month × quantity
> 3 M → W (1w) ≈ ×(4–5) per month × quantity
≤ 1 Y → W (1w) ≈ ×52
> 1 Y → M (1M) ≈ ×12 per year × quantity
Notes:
• Ratios for D/W/M are given as ranges because they depend on
**regular session length** (typically ~6.5–8h, not 24h).
• Returned strings can be used with `request.security()` and `input.timeframe`.
Parameters:
tf (string) : series string Selected timeframe (e.g., "D", "240", or timeframe.period).
Returns: series string Suggested lower TF to use for intra‑bar work.
isNewPeriod(tf, offset)
Returns `true` when a new session-aligned period begins, or on the Nth bar of that period.
Parameters:
tf (string) : series string Target higher timeframe (e.g., "D", "W", "M").
offset (simple int) : simple int 0 → checks for the first bar of the new period.
1+ → checks for the N-th bar of the period.
Returns: series bool `true` if the condition is met.
sinceNewPeriod(tf, offset)
Counts how many bars have passed within a higher timeframe (HTF) period.
For daily, weekly, and monthly resolutions, the period is aligned with the trading session.
Parameters:
tf (string) : series string Target parent timeframe (e.g., "60", "D").
offset (simple int) : simple int 0 → Running count for the current period.
1+ → Finalized count for the Nth most recent *completed* period.
Returns: series int Number of bars.
isHigherTF(tf, main)
Returns `true` when the selected timeframe represents a
higher resolution than the active timeframe.
Parameters:
tf (string) : series string Selected timeframe.
main (bool) : series bool When `true`, the comparison is made against the chart's main timeframe
instead of the script's active timeframe. Optional. Defaults to `false`.
Returns: series bool `true` if `tf` > active TF; otherwise `false`.
isActiveTF(tf, main)
Returns `true` when the selected timeframe represents the
exact resolution of the active timeframe.
Parameters:
tf (string) : series string Selected timeframe.
main (bool) : series bool When `true`, the comparison is made against the chart's main timeframe
instead of the script's active timeframe. Optional. Defaults to `false`.
Returns: series bool `true` if `tf` == active TF; otherwise `false`.
isLowerTF(tf, main)
Returns `true` when the selected timeframe represents a
lower resolution than the active timeframe.
Parameters:
tf (string) : series string Selected timeframe.
main (bool) : series bool When `true`, the comparison is made against the chart's main timeframe
instead of the script's active timeframe. Optional. Defaults to `false`.
Returns: series bool `true` if `tf` < active TF; otherwise `false`.
isMultipleTF(tf)
Returns `true` if the selected timeframe (`tf`) is a practical multiple
of the active skript's timeframe. It verifies this by checking if `tf` is a higher timeframe
that has consistently contained more than one bar of the skript's timeframe in recent periods.
The period detection is session-aware.
Parameters:
tf (string) : series string The higher timeframe to check.
Returns: series bool `true` if `tf` is a practical multiple; otherwise `false`.
interpTimestamp(offStart, offEnd, pct)
Calculates a precise absolute timestamp by interpolating within a bar range based on a percentage.
This version works with RELATIVE bar offsets from the current bar.
Parameters:
offStart (int) : series int The relative offset of the starting bar (e.g., 10 for 10 bars ago).
offEnd (int) : series int The relative offset of the ending bar (e.g., 1 for 1 bar ago). Must be <= offStart.
pct (float) : series float The percentage of the bar range to measure (e.g., 50.5 for 50.5%).
Values are clamped to the range.
Returns: series int The calculated, interpolated absolute Unix timestamp in milliseconds.

RRG Sector Snapshot RRG Sector Snapshot · Clear UI — User Guide
What this indicator does
Purpose: Visualize sector rotation by comparing each sector’s Relative Strength (RS-Ratio) and RS-Momentum versus a benchmark (e.g., VNINDEX).
Output: A quadrant map (table overlay) that positions each sector into one of four regimes:
LEADING (top-right): Strong and accelerating — leadership zone.
WEAKENING (bottom-right): Strong but decelerating — may be topping or consolidating.
LAGGING (bottom-left): Weak and decelerating — avoid unless mean-reverting.
IMPROVING (top-left): Weak but accelerating — candidates for next rotation into leadership.
How it works (under the hood)
X-axis (Strength): RS-Ratio = Sector Close / Benchmark Close, then normalized with a Z-Score over a lookback (normLen).
Y-axis (Momentum): Linear-regression slope of RS-Ratio over rsLen, then normalized with a Z-Score (normLen).
Mapping to grid: Both axes are Z-Scores scaled to a square grid (rrgSize × rrgSize) using a zoom factor (rrgScale). The center is neutral (0,0). Momentum increases upward (Y=0 is the top row in the table).
Quick start (3 minutes)
Add to chart:
TradingView → Pine Editor → paste the script → Save → Add to chart.
Set a benchmark: In inputs, choose Benchmark (X axis) — default INDEX:VNINDEX. Use VN30 or another index if it better reflects your universe.
Load sectors: Fill S1..S10 with sector or index symbols you track (up to 10). Set Slots to Use to the number you actually use.
Adjust view:
rrgSize (grid cells): 18–24 is a good starting point.
rrgScale (zoom): 2.5–3.5 typically; decrease to “zoom out” (points cluster near center), increase to “zoom in” (points spread to edges).
Read the map:
Prioritize sectors in LEADING; shortlist sectors in IMPROVING (could rotate into LEADING).
WEAKENING often marks late-cycle strength; LAGGING is typically avoid.
Inputs — what they do and how to change them
General
Analysis TF: Timeframe used to compute RRG (can be different from chart’s TF). Daily for swing, 1H/4H for tactical rotation, Weekly for macro view.
Benchmark (X axis): The index used for RS baseline (e.g., INDEX:VNINDEX, INDEX:VN30, major ETFs, or a custom composite).
RRG Calculation
RS Lookback (rsLen): Bars used for slope of RS (momentum).
Daily: 30–60 (default 40)
Intraday (1H/4H): 20–40
Weekly: 26–52
Normalization Lookback (Z-Score) (normLen): Window for Z-Score on both axes.
Daily: 80–120 (default 100)
Intraday: 40–80
Weekly: 52–104
Tip: Shorter lookbacks = more responsive but noisier; longer = smoother but slower.
RRG HUD (Table)
Show RRG Snapshot (rrgEnable): Toggle the table on/off.
Position (rrgPos): top_right | top_left | bottom_right | bottom_left.
Grid Size (Cells) (rrgSize): Table dimensions (N×N). Larger = more resolution but takes more space.
Z-Scale (Zoom) (rrgScale): Maps Z-Scores to the grid.
Smaller (2.0–2.5): Zoom out (more points near center).
Larger (3.5–4.0): Zoom in (emphasize outliers).
Appearance
Tag length (tagLen): Characters per sector tag. Use 4–6 for clarity.
Text size (textSizeOp): Tiny | Small | Normal | Large. Use Large for presentation screens or dense lists.
Axis thickness (axisThick): 1 = thin axis; 2 = thicker double-strip axis.
Quadrant alpha (bgAlpha): Transparency of quadrant backgrounds. 80–90 makes text pop.
Sectors (Max 10)
Slots to Use (sectorSlots): How many sector slots are active (≤10).
S1..S10: Each slot is a symbol (index, sector index, or ETF). Replace defaults to fit your market/universe.
How to interpret the map
Quadrants:
Leading (top-right): Relative strength above average and improving — trend-follow candidates.
Weakening (bottom-right): Still strong but momentum cooling — watch for distribution or pauses.
Lagging (bottom-left): Underperforming and still losing momentum — avoid unless doing mean-reversion.
Improving (top-left): Early recovery — candidates to transition into Leading if the move persists.
Overlapping sectors in one cell: The indicator shows “TAG +n” where TAG is the first tag, +n is the number of additional sectors sharing that cell. If many overlap:
Increase rrgSize, or
Decrease rrgScale to zoom out, or
Reduce Slots to Use to a smaller selection.
Suggested workflows
Daily swing
Benchmark: VNINDEX or VN30
rsLen 40–60, normLen 100–120, rrgSize 18–24, rrgScale 2.5–3.5
Routine:
Identify Leading sectors (top-right).
Spot Improving sectors near the midline moving toward top-right.
Confirm with price/volume/breakout on sector charts or top components.
Intraday (1H/4H) tactical
rsLen 20–40, normLen 60–100, rrgScale 2.0–3.0
Expect faster rotations and more noise; tighten filters with your own entry rules.
Weekly (macro rotation)
rsLen 26–52, normLen 52–104, rrgScale 3.0–4.0
Great for portfolio tilts and sector allocation.
Tuning tips
If everything clusters near center: Increase rrgScale (zoom in) or reduce normLen (more contrast).
If points are too spread: Decrease rrgScale (zoom out) or increase normLen (smoother normalization).
If the table is too big/small: Change rrgSize (cells).
If tags are hard to read: Increase textSizeOp to Large, tagLen to 5–6, and consider bgAlpha ~80–85.
Troubleshooting
No table on chart:
Ensure Show RRG Snapshot is enabled.
Change Position to a different corner.
Reduce Grid Size if the table exceeds the chart area.
Many sectors “missing”:
They’re likely overlapping in the same cell; the cell will show “TAG +n”.
Increase rrgSize, decrease rrgScale, or reduce Slots to Use.
Early bars show nothing:
You need enough data for rsLen and normLen. Scroll back or reduce lookbacks temporarily.
Best practices
Use RRG for context and rotation scouting, then confirm with your execution tools (trend structure, breakouts, volume, risk metrics).
Benchmark selection matters. If most of your watchlist tracks VN30, use INDEX:VN30 as the benchmark to get a truer relative read.
Revisit settings per timeframe. Intraday needs more responsiveness (shorter lookbacks, smaller Z-Scale); weekly needs stability (longer lookbacks, larger Z-Scale).
FAQ
Can I use ETFs or custom indices as sectors? Yes. Any symbol supported by TradingView works.
Can I track individual stocks instead of sectors? Yes (up to 10); just replace the S1..S10 symbols.
Why Z-Score? It standardizes each axis to “how unusual” the value is versus its own history — more robust than raw ratios across different scales.
[ i]
How to Set Up (Your Market Template)
This is the most important part for customizing the indicator to any market.
Step 1: Choose Your TF & Benchmark
Open the indicator's Settings.
Analysis TF: Set the timeframe you want to analyze (e.g., D for medium-term, W for long-term).
Benchmark (Trục X): This is the index you want to compare against.
Vietnamese Market: Leave the default INDEX:VNINDEX.
US Market: Change to SP:SPX or NASDAQ:NDX.
Crypto Market: Change to TOTAL (entire market cap) or BTC.D (Bitcoin Dominance).
Step 2: Input Your "Universe" (The 10 Slots)
This is where you decide what to track. You have 10 slots (S1 to S10).
For Vietnamese Sectors (Default):
Leave the default sector codes like INDEX:VNFINLEAD (Finance), INDEX:VNREAL (Real Estate), INDEX:VNIND (Industry), etc.
Template for Crypto "Sectors":
S1: BTC.D
S2: ETH.D
S3: TOTAL2 (Altcoin Market Cap)
S4: TOTAL.DEFI (DeFi)
S5: CRYPTOCAP:GAME (GameFi)
...and so on.
Template for Blue Chip Stocks:
Benchmark: INDEX:VN30
S1: HOSE:FPT
S2: HOSE:VCB
S3: HOSE:HPG
S4: HOSE:MWG
...and so on.
Template for Commodities:
Benchmark: TVC:DXY (US Dollar Index)
S1: TVC:GOLD
S2: TVC:USOIL
S3: TVC:SILVER
S4: COMEX:HG1! (Copper)
...and so on.
Step 3: Fine-Tuning
RS Lookback: A larger number (e.g., 100) gives a smoother, long-term view. A smaller number (e.g., 20) is more sensitive to short-term changes.
Z-Scale (Zoom): This is the "magnification" of the map.
If all your sectors are crowded in the middle, increase this number (e.g., 4.0) to "zoom in."
If your sectors are stuck on the edges, decrease this number (e.g., 2.0) to "zoom out."
Tag length: How many letters to display for the ticker (e.g., 4 will show VNFI).

Luxy BIG beautiful Dynamic ORBThis is an advanced Opening Range Breakout (ORB) indicator that tracks price breakouts from the first 5, 15, 30, and 60 minutes of the trading session. It provides complete trade management including entry signals, stop-loss placement, take-profit targets, and position sizing calculations.
The ORB strategy is based on the concept that the opening range of a trading session often acts as support/resistance, and breakouts from this range tend to lead to significant moves.
What Makes This Different?
Most ORB indicators simply draw horizontal lines and leave you to figure out the rest. This indicator goes several steps further:
Multi-Stage Tracking
Instead of just one ORB timeframe, this tracks FOUR simultaneously (5min, 15min, 30min, 60min). Each stage builds on the previous one, giving you multiple trading opportunities throughout the session.
Active Trade Management
When a breakout occurs, the indicator automatically calculates and displays entry price, stop-loss, and multiple take-profit targets. These lines extend forward and update in real-time until the trade completes.
Cycle Detection
Unlike indicators that only show the first breakout, this tracks the complete cycle: Breakout → Retest → Re-breakout. You can see when price returns to test the ORB level after breaking out (potential re-entry).
Failed Breakout Warning
If price breaks out but quickly returns inside the range (within a few bars), the label changes to "FAILED BREAK" - warning you to exit or avoid the trade.
Position Sizing Calculator
Built-in risk management that tells you exactly how many shares to buy based on your account size and risk tolerance. No more guessing or manual calculations.
Advanced Filtering
Optional filters for volume confirmation, trend alignment, and Fair Value Gaps (FVG) to reduce false signals and improve win rate.
Core Features Explained
### 1. Multi-Stage ORB Levels
The indicator builds four separate Opening Range levels:
ORB 5 - First 5 minutes (fastest signals, most volatile)
ORB 15 - First 15 minutes (balanced, most popular)
ORB 30 - First 30 minutes (slower, more reliable)
ORB 60 - First 60 minutes (slowest, most confirmed)
Each level is drawn as a horizontal range on your chart. As time progresses, the ranges expand to include more price action. You can enable or disable any stage and assign custom colors to each.
How it works: During the opening minutes, the indicator tracks the highest high and lowest low. Once the time period completes, those levels become your ORB high and low for that stage.
### 2. Breakout Detection
When price closes outside the ORB range, a label appears:
BREAK UP (green label above price) - Price closed above ORB High
BREAK DOWN (red label below price) - Price closed below ORB Low
The label shows which ORB stage triggered (ORB5, ORB15, etc.) and the cycle number if tracking multiple breakouts.
Important: Signals appear on bar close only - no repainting. What you see is what you get.
### 3. Retest Detection
After price breaks out and moves away, if it returns to test the ORB level, a "RETEST" label appears (orange). This indicates:
The original breakout level is now acting as support/resistance
Potential re-entry opportunity if you missed the first breakout
Confirmation that the level is significant
The indicator requires price to move a minimum distance away before considering it a valid retest (configurable in settings).
### 4. Failed Breakout Detection
If price breaks out but returns inside the ORB range within a few bars (before the breakout is "committed"), the original label changes to "FAILED BREAK" in orange.
This warns you:
The breakout lacked conviction
Consider exiting if already in the trade
Wait for better setup
Committed Breakout: The indicator tracks how many bars price stays outside the range. Only after staying outside for the minimum number of bars does it become a committed breakout that can be retested.
### 5. TP/SL Lines (Trade Management)
When a breakout occurs, colored horizontal lines appear showing:
Entry Line (cyan for long, orange for short) - Your entry price (the ORB level)
Stop Loss Line (red) - Where to exit if trade goes against you
TP1, TP2, TP3 Lines (same color as entry) - Profit targets at 1R, 2R, 3R
These lines extend forward as new bars form, making it easy to track your trade. When a target is hit, the line turns green and the label shows a checkmark.
Lines freeze (stop updating) when:
Stop loss is hit
The final enabled take-profit is hit
End of trading session (optional setting)
### 6. Position Sizing Dashboard
The dashboard (bottom-left corner by default) shows real-time information:
Current ORB stage and range size
Breakout status (Inside Range / Break Up / Break Down)
Volume confirmation (if filter enabled)
Trend alignment (if filter enabled)
Entry and Stop Loss prices
All enabled Take Profit levels with percentages
Risk/Reward ratio
Position sizing: Max shares to buy and total risk amount
Position Sizing Example:
If your account is $25,000 and you risk 1% per trade ($250), and the distance from entry to stop loss is $0.50, the calculator shows you can buy 500 shares (250 / 0.50 = 500).
### 7. FVG Filter (Fair Value Gap)
Fair Value Gaps are price inefficiencies - gaps left by strong momentum where one candle's high doesn't overlap with a previous candle's low (or vice versa).
When enabled, this filter:
Detects bullish and bearish FVGs
Draws semi-transparent boxes around these gaps
Only allows breakout signals if there's an FVG near the breakout level
Why this helps: FVGs indicate institutional activity. Breakouts through FVGs tend to be stronger and more reliable.
Proximity setting: Controls how close the FVG must be to the ORB level. 2.0x means the breakout can be within 2 times the FVG size - a reasonable default.
### 8. Volume & Trend Filters
Volume Filter:
Requires current volume to be above average (customizable multiplier). High volume breakouts are more likely to sustain.
Set minimum multiplier (e.g., 1.5x = 50% above average)
Set "strong volume" multiplier (e.g., 2.5x) that bypasses other filters
Dashboard shows current volume ratio
Trend Filter:
Only shows breakouts aligned with a higher timeframe trend. Choose from:
VWAP - Price above/below volume-weighted average
EMA - Price above/below exponential moving average
SuperTrend - ATR-based trend indicator
Combined modes (VWAP+EMA, VWAP+SuperTrend) for stricter filtering
### 9. Pullback Filter (Advanced)
Purpose:
Waits for price to pull back slightly after initial breakout before confirming the signal.
This reduces false breakouts from immediate reversals.
How it works:
- After breakout is detected, indicator waits for a small pullback (default 2%)
- Once pullback occurs AND price breaks out again, signal is confirmed
- If no pullback within timeout period (5 bars), signal is issued anyway
Settings:
Enable Pullback Filter: Turn this filter on/off
Pullback %: How much price must pull back (2% is balanced)
Timeout (bars): Max bars to wait for pullback (5 is standard)
When to use:
- Choppy markets with many fake breakouts
- When you want higher quality signals
- Combine with Volume filter for maximum confirmation
Trade-off:
- Better signal quality
- May miss some valid fast moves
- Slight entry delay
How to Use This Indicator
### For Beginners - Simple Setup
Add the indicator to your chart (5-minute or 15-minute timeframe recommended)
Leave all default settings - they work well for most stocks
Watch for BREAK UP or BREAK DOWN labels to appear
Check the dashboard for entry, stop loss, and targets
Use the position sizing to determine how many shares to buy
Basic Trading Plan:
Wait for a clear breakout label
Enter at the ORB level (or next candle open if you're late)
Place stop loss where the red line indicates
Take profit at TP1 (50% of position) and TP2 (remaining 50%)
### For Advanced Traders - Customized Setup
Choose which ORB stages to track (you might only want ORB15 and ORB30)
Enable filters: Volume (stocks) or Trend (trending markets)
Enable FVG filter for institutional confirmation
Set "Track Cycles" mode to catch retests and re-breakouts
Customize stop loss method (ATR for volatile stocks, ORB% for stable ones)
Adjust risk per trade and account size for accurate position sizing
Advanced Strategy Example:
Enable ORB15 only (disable others for cleaner chart)
Turn on Volume filter at 1.5x with Strong at 2.5x
Enable Trend filter using VWAP
Set Signal Mode to "Track Cycles" with Max 3 cycles
Wait for aligned breakouts (Volume + Trend + Direction)
Enter on retest if you missed the initial break
### Timeframe Recommendations
5-minute chart: Scalping, very active trading, crypto
15-minute chart: Day trading, balanced approach (most popular)
30-minute chart: Swing entries, less screen time
60-minute chart: Position trading, longer holds
The indicator works on any intraday timeframe, but ORB is fundamentally a day trading strategy. Daily charts don't make sense for ORB.
DEFAULT CONFIGURATION
ON by Default:
• All 4 ORB stages (5/15/30/60)
• Breakout Detection
• Retest Labels
• All TP levels (1/1.5/2/3)
• TP/SL Lines (Detailed mode)
• Dashboard (Bottom Left, Dark theme)
• Position Size Calculator
OFF by Default (Optional Filters):
• FVG Filter
• Pullback Filter
• Volume Filter
• Trend Filter
• HTF Bias Check
• Alerts
Recommended for Beginners:
• Leave all defaults
• Session Mode: Auto-Detect
• Signal Mode: Track Cycles
• Stop Method: ATR
• Add Volume Filter if trading stocks
Recommended for Advanced:
• Enable ORB15 + ORB30 only (disable 5 & 60)
• Enable: Volume + Trend + FVG
• Signal Mode: Track Cycles, Max 3
• Stop Method: ATR or Safer
• Enable HTF Daily bias check
## Settings Guide
The settings are organized into logical groups. Here's what each section controls:
### ORB COLORS Section
Show Edge Labels: Display "ORB 5", "ORB 15" labels at the right edge of the levels
Background: Fill the area between ORB high/low with color
Transparency: How see-through the background is (95% is nearly invisible)
Enable ORB 5/15/30/60: Turn each stage on or off individually
Colors: Assign colors to each ORB stage for easy identification
### SESSION SETTINGS Section
Session Mode: Choose trading session (Auto-Detect works for most instruments)
Custom Session Hours: Define your own hours if needed (format: HHMM-HHMM)
Auto-Detect uses the instrument's natural hours (stocks use exchange hours, crypto uses 24/7).
### BREAKOUT DETECTION Section
Enable Breakout Detection: Master switch for signals
Show Retest Labels: Display retest signals
Label Size: Visual size for all labels (Small recommended)
Enable FVG Filter: Require Fair Value Gap confirmation
Show FVG Boxes: Display the gap boxes on chart
Signal Mode: "First Only" = one signal per direction per day, "Track Cycles" = multiple signals
Max Cycles: How many breakout-retest cycles to track (6 is balanced)
Breakout Buffer: Extra distance required beyond ORB level (0.1-0.2% recommended)
Min Distance for Retest: How far price must move away before retest is valid (2% recommended)
Min Bars Outside ORB: Bars price must stay outside for committed breakout (2 is balanced)
### TARGETS & RISK Section
Enable Targets & Stop-Loss: Calculate and show trade management
TP1/TP2/TP3 checkboxes: Select which profit targets to display
Stop Method: How to calculate stop loss placement
- ATR: Based on volatility (best for most cases)
- ORB %: Fixed % of ORB range
- Swing: Recent swing high/low
- Safer: Widest of all methods
ATR Length & Multiplier: Controls ATR stop distance (14 period, 1.5x is standard)
ORB Stop %: Percentage beyond ORB for stop (20% is balanced)
Swing Bars: Lookback period for swing high/low (3 is recent)
### TP/SL LINES Section
Show TP/SL Lines: Display horizontal lines on chart
Label Format: "Short" = minimal text, "Detailed" = shows prices
Freeze Lines at EOD: Stop extending lines at session close
### DASHBOARD Section
Show Info Panel: Display the metrics dashboard
Theme: Dark or Light colors
Position: Where to place dashboard on chart
Toggle rows: Show/hide specific information rows
Calculate Position Size: Enable the position sizing calculator
Risk Mode: Risk fixed $ amount or % of account
Account Size: Your total trading capital
Risk %: Percentage to risk per trade (0.5-1% recommended)
### VOLUME FILTER Section
Enable Volume Filter: Require volume confirmation
MA Length: Average period (20 is standard)
Min Volume: Required multiplier (1.5x = 50% above average)
Strong Volume: Multiplier that bypasses other filters (2.5x)
### TREND FILTER Section
Enable Trend Filter: Require trend alignment
Trend Mode: Method to determine trend (VWAP is simple and effective)
Custom EMA Length: If using EMA mode (50 for swing, 20 for day trading)
SuperTrend settings: Period and Multiplier if using SuperTrend mode
### HIGHER TIMEFRAME Section
Check Daily Trend: Display higher timeframe bias in dashboard
Timeframe: What TF to check (D = daily, recommended)
Method: Price vs MA (stable) or Candle Direction (reactive)
MA Period: EMA length for Price vs MA method (20 is balanced)
Min Strength %: Minimum strength threshold for HTF bias to be considered
- For "Price vs MA": Minimum distance (%) from moving average
- For "Candle Direction": Minimum candle body size (%)
- 0.5% is balanced - increase for stricter filtering
- Lower values = more signals, higher values = only strong trends
### ALERTS Section
Enable Alerts: Master switch (must be ON to use any alerts)
Breakout Alerts: Notify on ORB breakouts
Retest Alerts: Notify when price retests after breakout
Failed Break Alerts: Notify on failed breakouts
Stage Complete Alerts: Notify when each ORB stage finishes forming
After enabling desired alert types, click "Create Alert" button, select this indicator, choose "Any alert() function call".
## Tips & Best Practices
### General Trading Tips
ORB works best on liquid instruments (stocks with good volume, major crypto pairs)
First hour of the session is most important - that's when ORB is forming
Breakouts WITH the trend have higher success rates - use the trend filter
Failed breakouts are common - use the "Min Bars Outside" setting to filter weak moves
Not every day produces good ORB setups - be patient and selective
### Position Sizing Best Practices
Never risk more than 1-2% of your account on a single trade
Use the built-in calculator - don't guess your position size
Update your account size monthly as it grows
Smaller accounts: use $ Amount mode for simplicity
Larger accounts: use % of Account mode for scaling
### Take Profit Strategy
Most traders use: 50% at TP1, 50% at TP2
Aggressive: Hold through TP1 for TP2 or TP3
Conservative: Full exit at TP1 (1:1 risk/reward)
After TP1 hits, consider moving stop to breakeven
TP3 rarely hits - only on strong trending days
### Filter Combinations
Maximum Quality: Volume + Trend + FVG (fewest signals, highest quality)
Balanced: Volume + Trend (good quality, reasonable frequency)
Active Trading: No filters or Volume only (many signals, lower quality)
Trending Markets: Trend filter essential (indices, crypto)
Range-Bound: Volume + FVG (avoid trend filter)
### Common Mistakes to Avoid
Chasing breakouts - wait for the bar to close, don't FOMO into wicks
Ignoring the stop loss - always use it, move it manually if needed
Over-leveraging - the calculator shows MAX shares, you can buy less
Trading every signal - quality > quantity, use filters
Not tracking results - keep a journal to see what works for YOU
## Pros and Cons
### Advantages
Complete all-in-one solution - from signal to position sizing
Multiple timeframes tracked simultaneously
Visual clarity - easy to see what's happening
Cycle tracking catches opportunities others miss
Built-in risk management eliminates guesswork
Customizable filters for different trading styles
No repainting - what you see is locked in
Works across multiple markets (stocks, forex, crypto)
### Limitations
Intraday strategy only - doesn't work on daily charts
Requires active monitoring during first 1-2 hours of session
Not suitable for after-hours or extended sessions by default
Can produce many signals in choppy markets (use filters)
Dashboard can be overwhelming for complete beginners
Performance depends on market conditions (trends vs ranges)
Requires understanding of risk management concepts
### Best For
Day traders who can watch the first 1-2 hours of market open
Traders who want systematic entry/exit rules
Those learning proper position sizing and risk management
Active traders comfortable with multiple signals per day
Anyone trading liquid instruments with clear sessions
### Not Ideal For
Swing traders holding multi-day positions
Set-and-forget / passive investors
Traders who can't watch market open
Complete beginners unfamiliar with trading concepts
Low volume / illiquid instruments
## Frequently Asked Questions
Q: Why are no signals appearing?
A: Check that you're on an intraday timeframe (5min, 15min, etc.) and that the current time is within your session hours. Also verify that "Enable Breakout Detection" is ON and at least one ORB stage is enabled. If using filters, they might be blocking signals - try disabling them temporarily.
Q: What's the best ORB stage to use?
A: ORB15 (15 minutes) is most popular and balanced. ORB5 gives faster signals but more noise. ORB30 and ORB60 are slower but more reliable. Many traders use ORB15 + ORB30 together.
Q: Should I enable all the filters?
A: Start with no filters to see all signals. If too many false signals, add Volume filter first (stocks) or Trend filter (trending markets). FVG filter is most restrictive - use for maximum quality but fewer signals.
Q: How do I know which stop loss method to use?
A: ATR works for most cases - it adapts to volatility. Use ORB% if you want predictable stop placement. Swing is for respecting chart structure. Safer gives you the most room but largest risk.
Q: Can I use this for swing trading?
A: Not really - ORB is fundamentally an intraday strategy. The ranges reset each day. For swing trading, look at weekly support/resistance or moving averages instead.
Q: Why do TP/SL lines disappear sometimes?
A: Lines freeze (stop extending) when: stop loss is hit, the last enabled take-profit is hit, or end of session arrives (if "Freeze at EOD" is enabled). This is intentional - the trade is complete.
Q: What's the difference between "First Only" and "Track Cycles"?
A: "First Only" shows one breakout UP and one DOWN per day maximum - clean but might miss opportunities. "Track Cycles" shows breakout-retest-rebreak sequences - more signals but busier chart.
Q: Is position sizing accurate for options/forex?
A: The calculator is designed for shares (stocks). For options, ignore the share count and use the risk amount. For forex, you'll need to adapt the lot size calculation manually.
Q: How much capital do I need to use this?
A: The indicator works for any account size, but practical day trading typically requires $25,000 in the US due to Pattern Day Trader rules. Adjust the "Account Size" setting to match your capital.
Q: Can I backtest this strategy?
A: This is an indicator, not a strategy script, so it doesn't have built-in backtesting. You can visually review historical signals or code a strategy script using similar logic.
Q: Why does the dashboard show different entry price than the breakout label?
A: If you're looking at an old breakout, the ORB levels may have changed when the next stage completed. The dashboard always shows the CURRENT active range and trade setup.
Q: What's a good win rate to expect?
A: ORB strategies typically see 40-60% win rate depending on market conditions and filters used. The strategy relies on positive risk/reward ratios (2:1 or better) to be profitable even with moderate win rates.
Q: Does this work on crypto?
A: Yes, but crypto trades 24/7 so you need to define what "session start" means. Use Session Mode = Custom and set your preferred daily reset time (e.g., 0000-2359 UTC).
## Credits & Transparency
### Development
This indicator was developed with the assistance of AI technology to implement complex ORB trading logic.
The strategy concept, feature specifications, and trading logic were designed by the publisher. The implementation leverages modern development tools to ensure:
Clean, efficient, and maintainable code
Comprehensive error handling and input validation
Detailed documentation and user guidance
Performance optimization
### Trading Concepts
This indicator implements several public domain trading concepts:
Opening Range Breakout (ORB): Trading strategy popularized by Toby Crabel, Mark Fisher and many more talanted traders.
Fair Value Gap (FVG): Price imbalance concept from ICT methodology
SuperTrend: ATR-based trend indicator using public formula
Risk/Reward Ratio: Standard risk management principle
All mathematical formulas and technical concepts used are in the public domain.
### Pine Script
Uses standard TradingView built-in functions:
ta.ema(), ta.atr(), ta.vwap(), ta.highest(), ta.lowest(), request.security()
No external libraries or proprietary code from other authors.
## Disclaimer
This indicator is provided for educational and informational purposes only. It is not financial advice.
Trading involves substantial risk of loss and is not suitable for every investor. Past performance shown in examples is not indicative of future results.
The indicator provides signals and calculations, but trading decisions are solely your responsibility. Always:
Test strategies on paper before using real money
Never risk more than you can afford to lose
Understand that all trading involves risk
Consider seeking advice from a licensed financial advisor
The publisher makes no guarantees regarding accuracy, profitability, or performance. Use at your own risk.
---
Version: 3.0
Pine Script Version: v6
Last Updated: October 2024
For support, questions, or suggestions, please comment below or send a private message.
---
Happy trading, and remember: consistent risk management beats perfect entry timing every time.

PG ATM Strike Line with Call & Put PremiumsPine Script: ATM Strike Line with Call & Put Premiums (Simplified)This Pine Script for TradingView displays the At-The-Money (ATM) strike price, futures price, call/put premiums (time value), and two ratios—Premium Ratio (PR) and Volume Ratio (VR)—for a user-selected underlying asset (e.g., NIFTY, BANKNIFTY, or stocks). It helps traders gauge near-term market direction using options data.How the Script WorksInputs:Expiry: Select year (e.g., '25), month (01–12), day (01–31) for option expiry (e.g., '251028').
Timeframe: Choose data timeframe (e.g., Daily, 15-min).
Symbol: Auto-detects chart symbol or select from Indian indices/stocks.
Strike: Auto-ATM (based on futures) or manual strike input.
Interval: Auto (e.g., 100 for NIFTY) or custom strike interval.
Colors: Customizable for ATM line, labels (Futures Price, CPR, PPR, VR, PR).
Calculations:Futures Price (FP): Fetches front-month futures price (e.g., NSE:NIFTY1!).
ATM Strike: Rounds futures price to nearest strike interval.
Option Data: Retrieves Last Traded Price (LTP) and volume for ATM call/put options (e.g., NSE:NIFTY251028C24200).
Call Premium (CPR): Call LTP minus intrinsic value (max(0, FP - Strike)).
Put Premium (PPR): Put LTP minus intrinsic value (max(0, Strike - FP)).
Premium Ratio (PR): PPR / CPR.
Volume Ratio (VR): Put Volume / Call Volume.
Visuals:Draws ATM strike line on chart.
Displays labels: FP (futures price), CPR (call premium), PPR (put premium), VR, PR.
VR/PR labels: Red (≥ 1.25, bearish), Green (≤ 0.75, bullish), Gray (0.75–1.25, neutral).
Updates on last confirmed bar to avoid redraws.
Using PR and VR for Market DirectionPremium Ratio (PR):PR ≥ 1.25 (Red): High put premiums suggest bearish sentiment (expect price drop).
PR ≤ 0.75 (Green): High call premiums suggest bullish sentiment (expect price rise).
0.75 < PR < 1.25 (Gray): Neutral, no clear direction.
Use: High PR favors bearish trades (e.g., buy puts); low PR favors bullish trades (e.g., buy calls).
Volume Ratio (VR):VR ≥ 1.25 (Red): High put volume indicates bearish activity.
VR ≤ 0.75 (Green): High call volume indicates bullish activity.
0.75 < VR < 1.25 (Gray): Neutral trading activity.
Use: High VR suggests bearish moves; low VR suggests bullish moves.
Combined Signals:High PR & VR: Strong bearish signal; consider put buying or call selling.
Low PR & VR: Strong bullish signal; consider call buying or put selling.
Mixed/Neutral: Use price action or support/resistance for confirmation.
Tips:Combine with technical analysis (e.g., trends, levels).
Match timeframe to trading horizon (e.g., 15-min for intraday).
Monitor FP for context; check volatility or news for accuracy.
ExampleNIFTY: FP = 24,237.50, ATM = 24,200, CPR = 120.25, PPR = 180.50, PR = 1.50 (Red), VR = 1.30 (Red).
Insight: High PR/VR suggests bearish bias; consider bearish trades if price nears resistance.
Action: Buy puts or exit longs, confirm with price action.
Conclusion: This script provides a concise tool for options traders, showing ATM strike, premiums, and PR/VR ratios. High PR/VR (≥ 1.25) signals bearish sentiment, low PR/VR (≤ 0.75) signals bullish sentiment, and neutral (0.75–1.25) suggests indecision. Combine with technical analysis for robust trading decisions in the Indian options market.

Broad Market for Crypto + index# Broad Market Indicator for Crypto
## Overview
The Broad Market Indicator for Crypto helps traders assess the strength and divergence of individual cryptocurrency assets relative to the overall market. By comparing price deviations across multiple assets, this indicator reveals whether a specific coin is moving in sync with or diverging from the broader crypto market trend.
## How It Works
This indicator calculates percentage deviations from simple moving averages (SMA) for both individual assets and an equal-weighted market index. The core methodology:
1. **Deviation Calculation**: For each asset, the indicator measures how far the current price has moved from its SMA over a specified lookback period (default: 24 hours). The deviation is expressed as a percentage: `(Current Price - SMA) / SMA × 100`
2. **Market Index Construction**: An equal-weighted index is built from selected cryptocurrencies (up to 15 assets). The default composition includes major crypto assets: BTC, ETH, BNB, SOL, XRP, ADA, AVAX, LINK, DOGE, and TRX.
3. **Comparative Analysis**: The indicator displays both the current instrument's deviation and the market index deviation on the same panel, making it easy to spot relative strength or weakness.
## Key Features
- **Customizable Asset Selection**: Choose up to 15 different cryptocurrencies to include in your market index
- **Flexible Configuration**: Toggle individual assets on/off for display and index calculation
- **Current Instrument Tracking**: Automatically plots the deviation of whatever chart you're viewing
- **Visual Clarity**: Color-coded lines for easy differentiation between assets, with the market index shown as a filled area
- **Adjustable Lookback Period**: Modify the SMA period to match your trading timeframe
## How to Use
### Identifying Market Divergences
- When the current instrument deviates significantly above the index, it shows relative strength
- When it deviates below, it indicates relative weakness
- Assets clustering around zero suggest neutral market conditions
### Trend Confirmation
- If both the index and your asset are rising together (positive deviation), it confirms a broad market uptrend
- Divergence between asset and index can signal unique fundamental factors or early trend changes
### Entry/Exit Signals
- Extreme deviations from the index may indicate overbought/oversold conditions relative to the market
- Convergence back toward the index line can signal mean reversion opportunities
## Settings
- **Lookback Period**: Adjust the SMA calculation period (default: 24 hours)
- **Asset Configuration**: Select which cryptocurrencies to monitor and include in the index
- **Display Options**: Show/hide individual assets, current instrument, and market index
- **Color Customization**: Personalize colors for better visual analysis
## Best Practices
- Use on higher timeframes (4H, Daily) for more reliable signals
- Combine with volume analysis for confirmation
- Consider fundamental news when assets show extreme divergence
- Adjust the asset basket to match your trading focus (DeFi, L1s, memecoins, etc.)
## Technical Notes
- The indicator uses `request.security()` to fetch data from multiple symbols
- Deviations are calculated independently for each asset
- The zero line represents perfect alignment with the moving average
- Index calculation automatically adjusts based on active assets
## Default Assets
1. BTC (Bitcoin) - BINANCE:BTCUSDT
2. ETH (Ethereum) - BINANCE:ETHUSDT
3. BNB (Binance Coin) - BINANCE:BNBUSDT
4. SOL (Solana) - BINANCE:SOLUSDT
5. XRP (Ripple) - BINANCE:XRPUSDT
6. ADA (Cardano) - BINANCE:ADAUSDT
7. AVAX (Avalanche) - BINANCE:AVAXUSDT
8. LINK (Chainlink) - BINANCE:LINKUSDT
9. DOGE (Dogecoin) - BINANCE:DOGEUSDT
10. TRX (Tron) - BINANCE:TRXUSDT
Additional slots (11-15) are available for custom asset selection.
---
This indicator is particularly useful for cryptocurrency traders seeking to understand market breadth and identify opportunities where specific assets are diverging from overall market sentiment.

WorldCup Dashboard + Institutional Sessions© 2025 NewMeta™ — Educational use only.
# Full, Premium Description
## WorldCup Dashboard + Institutional Sessions
**A trade-ready, intraday framework that combines market structure, real flow, and institutional timing.**
This toolkit fuses **Institutional Sessions** with a **price–volume decision engine** so you can see *who is active*, *where value sits*, and *whether the drive is real*. You get: **CVD/Delta**, volume-weighted **Momentum**, **Aggression** spikes, **FVG (MTF)** with nearest side, **Daily Volume Profile (VAH/POC/VAL)**, **ATR regime**, a **24h position gauge**, classic **candle patterns**, IBH/IBL + **first-hour “true close”** lines, and a **10-vote confluence scoreboard**—all in one view.
---
## What’s inside (and how to trade it)
### 🌍 Institutional Sessions (Sydney • Tokyo • London • New York)
* Session boxes + a highlighted **first hour**.
* Plots the **true close** (first-hour close) as a running line with a label.
**Use:** Many desks anchor risk to this print. Above = bullish bias; below = bearish. **IBH/IBL** breaks during London/NY carry the most signal.
### 📊 CVD / Delta (Flow)
* Net buyer vs seller pressure with smooth trend state.
**Use:** **Rising CVD + acceptance above mid/POC** confirms continuation. Bearish price + rising CVD = caution (possible absorption).
### ⚡ Volume-Weighted Momentum
* Momentum adjusted by participation quality (volume).
**Use:** Momentum>MA and >0 → trend drive is “real”; <0 and falling → distribution risk.
### 🔥 Aggression Detector
* ROC × normalized volume × wick factor to flag **forceful** candles.
**Use:** On spikes, avoid fading blindly—wait for pullbacks into **aligned FVG** or for aggression to cool.
### 🟦🟪 Fair Value Gaps (with MTF)
* Detects up to 3 recent FVGs and marks the **nearest** side to price.
**Use:** Trend pullbacks into **bullish FVG** for longs; bounces into **bearish FVG** for shorts. Optional threshold to filter weak gaps.
### 🧭 24h Gauge (positioning)
* Shows current price across the 24h low⇢high with a mid reference.
**Use:** Above mid and pushing upper third = momentum continuation setups; below mid = sell the rips bias.
### 🧱 Daily Volume Profile (manual per day)
* **VAH / POC / VAL** derived from discretized rows.
**Use:** **POC below** supports longs; **POC above** caps rallies. Fade VAH/VAL in ranges; treat them as break/hold levels in trends.
### 📈 ATR Regime
* **ATR vs ATR-avg** with direction and regime flag (**HIGH / NORMAL / LOW**).
**Use:** HIGH ⇒ give trades room & favor trend following. LOW ⇒ fade edges, scale targets.
### 🕯️ Candle Patterns (contextual, not standalone)
* Engulfings, Morning/Evening Star, 3 Soldiers/Crows, Harami, Hammer/Shooting Star, Double Top/Bottom.
**Use:** Only with session + flow + momentum alignment.
### 🤝 Price–Volume Classification
* Labels each bar as **continuation**, **exhaustion**, **distribution**, or **healthy pullback**.
**Use:** Align continuation reads with trend; treat “Price↑ + Vol↓” as a caution flag.
### 🧪 Confluence Scoreboard & B/S Meter
* Ten elements vote: 🔵 bull, ⚪ neutral, 🟣 bear.
**Use:** Execution filter—take setups when the board’s skew matches your trade direction.
---
## Playbooks (actionable)
**Trend Pullback (Long)**
1. London/NY active, Momentum↑, CVD↑, price above 24h mid & POC.
2. Pullback into **nearest bullish FVG**.
3. Invalidate under FVG low or **true-close** line.
4. Targets: IBH → VAH → 24h high.
**Range Fade (Short)**
1. Asia/quiet regime, **Price↑ + Vol↓** into **VAH**, ATR low.
2. Nearest FVG bearish or scoreboard skew bearish.
3. Invalidate above VAH/IBH.
4. Targets: POC → VAL.
**News/Impulse**
Aggression spike? Don’t chase. Let it pull back into the aligned FVG; require CVD/Momentum agreement before entry.
---
## Alerts (included)
* **Bull/Bear Confluence ≥ 7/10**
* **Intraday Target Achieved** / **Daily Target Achieved**
* **Session True-Close Retests** (Sydney/Tokyo/London/NY)
*(Keep alerts “Once per bar” unless you specifically want intrabar triggers.)*
---
## Setup Tips
* **UTC**: Choose the reference that matches how you track sessions (default UTC+2).
* **Volume threshold**: 2.0× is a strong baseline; raise for noisy alts, lower for majors.
* **CVD smoothing**: 14–24 for scalps; 24–34 for slower markets.
* **ATR lengths**: Keep defaults unless your asset has a persistent regime shift.
---
## Why this framework?
Because **timing (sessions)**, **truth (flow)**, and **location (value/FVG)** together beat any single signal. You get *who is trading*, *how strong the push is*, and *where risk lives*—on one screen—so execution is faster and cleaner.
---
**Disclaimer**: Educational use only. Not financial advice. Markets are risky—backtest and size responsibly.

ICT HTF Volume Candles (Based on HTF Candles by Fadi)# ICT HTF Volume Candles - Multi-Timeframe Volume Analysis
## Overview
This indicator provides multi-timeframe volume visualization designed to complement price action analysis. It displays volume data from up to 6 higher timeframes simultaneously in a separate panel, allowing traders to identify volume spikes, divergences, and institutional activity without switching between timeframes.
**Original Concept Credits:** This indicator builds upon the HTF Candles framework by Fadi, adapting it specifically for volume analysis with enhanced features including gap-filling for extended hours, multiple scaling methods, and advanced synchronization.
## What Makes This Script Original
### Key Innovations:
1. **Three Volume Scaling Methods:**
- **Per-HTF Auto Scale:** Each timeframe scales independently for detailed comparison
- **Global Auto Scale:** All timeframes use unified scale for relative volume comparison
- **Manual Scale:** User-defined maximum for consistent analysis across sessions
2. **Bullish/Bearish Volume Differentiation:**
- Volume bars colored based on price movement (close vs open)
- Separate styling for bullish (green) and bearish (red) volume periods
- Helps identify whether volume supports price direction
3. **Advanced Time Synchronization:**
- Custom daily candle open times (Midnight, 8:30 AM, 9:30 AM ET)
- Timezone-aware calculations for New York trading hours
- Real-time countdown timers for each timeframe
- **Gap-filling technology** for continuous display during extended hours and weekends
4. **Flexible Display Options:**
- Configurable spacing and positioning
- Label placement (top, bottom, or both)
- Day-of-week or time interval labels on candles
- Works reliably in backtesting and live trading
## How It Works
### Volume Calculation
The indicator uses `request.security()` with optimized parameters to fetch volume data from higher timeframes:
- **Volume Open/High/Low/Close (OHLC):** Tracks volume changes within each HTF candle
- **Color Logic:** Compares HTF close vs open prices to determine bullish/bearish classification
- **Alignment:** All volume bars share a common baseline for easy visual comparison
- **Gap Handling:** Uses `gaps=barmerge.gaps_off` to maintain continuity during non-trading hours
### Technical Implementation
```
1. Monitors HTF timeframe changes using request.security() with lookahead
2. Creates new VolumeCandle object when HTF bar opens
3. Updates current candle's volume H/L/C on each chart bar
4. Applies selected scaling method to normalize display height
5. Repositions all candles and labels on each bar update
6. Fills gaps automatically during extended hours for consistent display
```
### Scaling Methods Explained
**Method 1 - Auto Scale per HTF:**
Each timeframe displays volume relative to its own maximum. Best for identifying patterns within each individual timeframe.
**Method 2 - Global Auto Scale:**
All timeframes share the same scale based on the highest volume across all HTFs. Best for comparing relative volume strength between timeframes.
**Method 3 - Manual Scale:**
User sets maximum volume value. Best for maintaining consistent scale across different trading sessions or instruments.
## How to Use This Indicator
### Setup
1. Add indicator to your chart (it appears in a separate panel below price)
2. Configure up to 6 higher timeframes (default: 5m, 15m, 1H, 4H, 1D, 1W)
3. Set number of candles to display for each timeframe
4. Choose volume scaling method based on your analysis needs
5. Enable "Fix gaps in non-trading hours" for extended hours trading (enabled by default)
### Interpretation
**Volume Spikes:**
- Sudden increase in volume height indicates institutional activity or strong conviction
- Compare volume between timeframes to identify where the real money is moving
- Look for volume spikes that appear across multiple timeframes simultaneously
**Bullish vs Bearish Volume:**
- **Green volume bars:** Price closed higher (buying pressure)
- **Red volume bars:** Price closed lower (selling pressure)
- High green volume during uptrend = confirmation of strength
- High red volume during downtrend = confirmation of weakness
- High volume opposite to trend = potential reversal warning
**Multi-Timeframe Context:**
- **5m/15m:** Scalping and day trading activity
- **1H/4H:** Swing trading and intraday institutional flows
- **Daily/Weekly:** Major position building and long-term trends
**Divergences:**
- Price making new highs but volume declining = weakening trend
- Volume increasing while price consolidates = potential breakout brewing
- Price breaks level but volume doesn't confirm = likely false breakout
### Practical Examples
**Example 1 - Institutional Confirmation:**
Price breaks above resistance. Check volume across timeframes:
- 5m shows spike = retail interest
- 15m + 1H + 4H all show spikes = institutional confirmation
- **Trade confidence: HIGH**
**Example 2 - False Breakout Detection:**
Price breaks resistance with:
- High volume on 5m only
- Normal/low volume on 1H and 4H
- **Interpretation:** Likely retail trap, institutions not participating
- **Action:** Wait for pullback or avoid
**Example 3 - Accumulation Phase:**
Price ranges sideways but:
- Daily volume gradually increasing
- Weekly volume above average
- **Interpretation:** Smart money accumulating
- **Action:** Prepare for breakout in direction of volume
**Example 4 - Volume Divergence:**
Price makes new high:
- Current high has lower volume than previous high across all timeframes
- **Interpretation:** Weakening momentum
- **Action:** Consider profit-taking or reversal trade
## Configuration Parameters
### Timeframe Settings
- **HTF 1-6:** Select timeframes (must be higher than chart timeframe)
- **Max Display:** Number of candles to show per timeframe (1-50)
- **Limit to Next HTFs:** Display only first N enabled timeframes (1-6)
### Styling
- **Bull/Bear Colors:** Separate colors for body, border, and wick
- **Padding from current candles:** Distance offset from live price action
- **Space between candles:** Gap between individual volume bars
- **Space between Higher Timeframes:** Gap between different timeframe groups
- **Candle Width:** Thickness of volume bars (1-4, multiplied by 2)
### Volume Settings
- **Volume Scale Method:** Choose 1, 2, or 3
- 1 = Auto Scale per HTF (each TF independent)
- 2 = Global Auto Scale (all TF unified)
- 3 = Manual Scale (user-defined max)
- **Auto Scale Volume:** Enable/disable automatic scaling
- **Manual Scale Max Volume:** Set maximum when using Method 3
### Label Settings
- **HTF Label:** Show/hide timeframe names with color and size options
- **Label Positions:** Display at Top, Bottom, or Both
- **Label Alignment:** Align centered or Follow Candles
- **Remaining Time:** Show countdown timer until next HTF candle
- **Interval Value:** Display day-of-week or time on each candle
### Custom Daily Candle
- **Enable Custom Daily:** Override default daily candle timing
- **Open Time Options:**
- **Midnight:** Standard 00:00 ET daily open
- **8:30 AM:** Align with economic data releases
- **9:30 AM:** Align with NYSE market open
- Useful for specific trading strategies or market alignment
### Advanced Settings
- **Fix gaps in non-trading hours:** Maintains alignment during extended hours and weekends (recommended: ON)
- Prevents visual gaps during forex weekend closures
- Ensures consistent display during crypto 24/7 trading
- Improves backtesting reliability
## Best Practices
1. **Pair with Price Action:** Use alongside HTF price candles indicator for complete picture
2. **Start Simple:** Enable 2-3 timeframes initially (e.g., 15m, 1H, 4H), add more as needed
3. **Match Settings:** Use same candle width/spacing as companion price indicator for visual alignment
4. **Scale Appropriately:**
- Use **Global scale** (Method 2) when comparing timeframes
- Use **Per-HTF scale** (Method 1) for pattern analysis within each timeframe
- Use **Manual scale** (Method 3) for consistent day-to-day comparison
5. **Watch for Volume Clusters:** High volume appearing simultaneously across multiple HTFs signals significant market events
6. **Confirm Breakouts:** Always check if volume supports the price movement across higher timeframes
7. **Extended Hours:** Keep "Fix gaps" enabled for 24/7 markets (Forex, Crypto) and weekend analysis
## Technical Notes
- **Timezone:** All calculations use America/New_York timezone for consistency
- **Real-time Updates:** Volume and timers update on each tick during market hours
- **Performance:** Optimized with max_bars_back=5000 for extensive historical analysis
- **Compatibility:** Works on all instruments with volume data (Stocks, Forex, Crypto, Futures)
- **Gap Handling:** Uses `barmerge.gaps_off` to fill data gaps during non-trading periods
- **Backtesting:** Uses `lookahead=barmerge.lookahead_on` for stable historical data without repainting
- **Data Continuity:** Automatically handles market closures, weekends, and extended hours
## Updates & Improvements
**Version 2.0 (Current):**
- ✅ Fixed alignment issues during extended hours and weekends
- ✅ Eliminated repainting in backtesting
- ✅ Added gap-filling technology for continuous display
- ✅ Improved data synchronization across all timeframes
- ✅ Enhanced NA value handling for data integrity
- ✅ Added advanced settings group for user control
## Support
For questions, suggestions, or feedback, please comment on the publication or message the author.
---
**Disclaimer:** This indicator is for educational and informational purposes only. It does not constitute financial advice. Past performance is not indicative of future results. Always perform your own analysis and implement proper risk management before making trading decisions.
