[astropark] MACD, RSI+, AO, DMI, ADX, OBV, ADI//******************************************************************************
// Copyright by astropark v4.1.0
// MACD, RSI+, Awesome Oscillator, DMI, ADX, OBV, ADI
// 24/10/2018 Added RSI with Center line to have clear glue of current trend
// 10/12/2018 Added MACD
// 13/12/2018 Added multiplier for MACD in order to make it clearly visible over RSI graph
// 11/01/2019 Added Awesome Ascillator (AO)
// 11/01/2019 Added Directional Movement Index (DMI) with ADX
// 14/01/2019 Added On Balance Volume (OBV)
// 14/01/2019 Added Accelerator Decelerator Indicator (ADI)
//******************************************************************************
在脚本中搜索"电力行业+股票+11年涨幅"

[astropark] MACD, RSI+, Awesome Oscillator, DMI, ADX, OBV//******************************************************************************
// Copyright by astropark v4.0.0
// MACD, RSI+, Awesome Oscillator, DMI, ADX, OBV
// 24/10/2018 Added RSI with Center line to have clear glue of current trend
// 10/12/2018 Added MACD
// 13/12/2018 Added multiplier for MACD in order to make it clearly visible over RSI graph
// 11/01/2019 Added Awesome Oscillator (AO)
// 11/01/2019 Added Directional Movement Index (DMI) with ADX
// 14/01/2019 Added On Balance Volume (OBV)
//******************************************************************************

[astropark] MACD, RSI+, Awesome Oscillator, DMI with ADX//******************************************************************************
// Copyright by astropark v3.1.0
// MACD, RSI+, Awesome Oscillator, DMI, ADX
// 24/10/2018 Added RSI with Center line to have clear glue of current trend
// 10/12/2018 Added MACD
// 13/12/2018 Added multiplier for MACD in order to make it clearly visible over RSI graph
// 11/01/2019 Added Awesome Ascillator (AO)
// 11/01/2019 Added Directional Movement Index (DMI) with ADX
//******************************************************************************

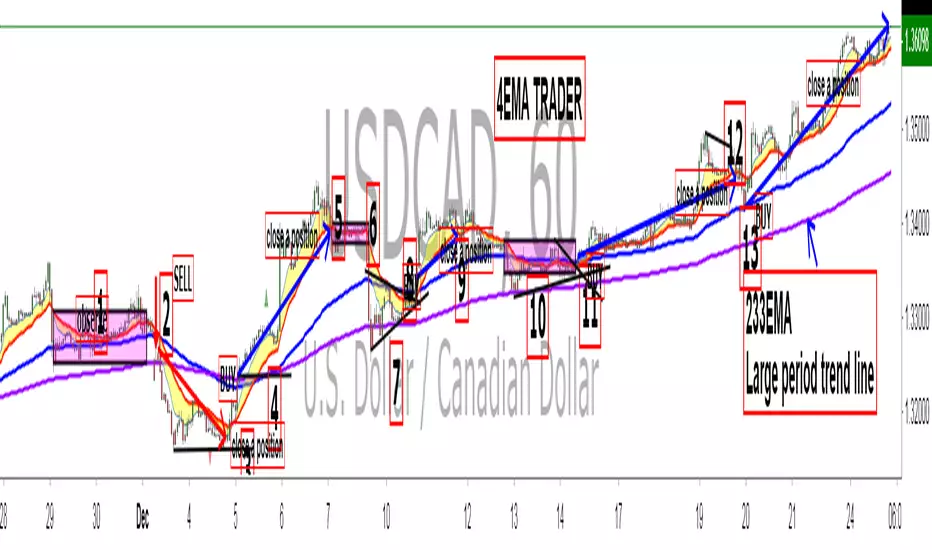
King 4EMA TraderKing 4EMA trader 8/21/89EMA+(233)V3.3
Explain the application of moving averages through the disk surface:
When the price runs above 89, it only looks for the buy signal.
When the price runs below 89, it only looks for sell signals.
The first step up through the 89 moving average after the first confirmation can buy homeoply,
The first pull down after crossing the 89 moving average for the first time confirms that it can be sold in line with the trend.
Price horizontal finishing, moving average frequently across the field observation.
The yellow area in the interval from 8 to 21 is the homeopathic warehouse addition signal.
When the price is above the 89 moving average, the k-line closes below the 21-day moving average as a callback signal
Prices below the 89 ema close above the 21 - day ema as a rebound signal
After the correction and rebound signals come out, we should make half of the profit and the other half of the stop loss in the break-even place.
Moving average is very suitable for the trend of strong varieties, is not suitable for volatile market.
Only at the end of the shock market moving average upward or downward divergent when it is possible to be used.
1. Repeatedly entangle the mean line of horizontal disk stage and observe it from the field
2. Sell the three EMA moving averages when they can't exceed 89EMA with downward crossing
3, many times can not break the new low when prices go sideways profit
4. Buy when the price reaches 89EMA after the convergence of triangle 3 is broken
5, the Angle of price rise slowed and closed below the 21 moving average when profit
6. Left field observation during transverse oscillation.
Sit tight while news or data cause prices to fall quickly
8. Buy when the price triangle breaks through the 89 moving average upward
9, the price does not rise to slow down when the horizontal closed below the 21 moving average when profit
10, price horizontal shock finishing at the same time the average line also transverse finishing field observation
11, the price of the triangle after finishing through the 89 moving average to buy.At this point all the averages have turned up
12, the second time can not break through the new high when the negative line can profit
13, the price of the first time in the same period of time through 89 after the first step back can be re-bought.
通过盘面讲解均线运用:
价格在89上面运行时时只找买入信号、
价格在89下面运行时只寻找卖出信号、
第一次向上穿过89均线后的第一次回踩确认可以顺势买入、
第一次向下穿过89均线后的第一次回抽确认可以顺势卖出、
价格横盘整理,均线频繁穿越时离场观察。
8-21区间里面黄色区域为顺势加仓信号,
价格在89均线上面时K线收盘在21天均线下面时为回调信号
价格在89均线下面时K线收盘在21天均线上面时为反弹信号
在回调和反弹信号出来之后我们应该获利一半的头寸,另外一半止损放到盈亏平衡的地方。
均线非常适合趋势性很强的品种,并不适合震荡行情。
只有在震荡行情结束时均线向上或向下发散时才有被运用的可能。
1、横盘阶段均线反复纠缠,离场观察
2、三条EMA均线向下交叉回抽无法超越89EMA时卖出
3、多次不能破新低时价格走横时获利
4、价格在3处三角形收敛被突破后站上了89EMA时买入
5、价格上涨角度变缓并收盘在21均线下面时获利
6、横盘震荡时离场观察。
7、见死不救新闻或数据导致价格快速下跌时观望
8、价格三角形向上突破时穿过89均线时买入
9、价格不升减速走横时收盘于21均线下面时获利
10、价格横盘震荡整理同时均线也横向整理时离场观察
11、价格突破三角形整理后重新穿过89均线时买入。此时所有均线已经向上翘头
12、第二次不能突破新高时收阴线可以获利
13、价格在同一个时间周期内第一次穿过89以后的第一次回踩可以重新买入。
Bitfinex Longs/Shorts Multi-Coin [acatwithcharts]This script plots the longs/shorts ratio derived from Bitfinex for BTCUSDLONGS, BTCUSDSHORTS, and similar for 11 top cryptocurrencies chosen selected based on marketcap, trading volume on Bitfinex, and the maximum number of times that TradingView would let me call the "security" function in one script. Included coins:
BTC, ETH, LTC, BCH, XRP, EOS, IOT (IOTA), ETC, ZEC, NEO, XMR
In addition to just plotting the ratios for the individual coins, this script also calculates for a customizable selection of the 11 coins both the average ratio and a weighted average weighted by (USD price of coin * sum of long and short positions).
I wrote it both to use both for a big picture overview of leveraged positions across major coins and to use as a Swiss army knife of longs/shorts ratio indicators for individual coins, most of which do not currently have individual scripts published.
I'm an amateur and you definitely shouldn't take anything I say or use any of my scripts as financial advice. I'd appreciate any feedback.

Stochastic Momentum IndexStochastic Momentum Index indicator script. This indicator was originally developed by William Blau (Stocks & Commodities V. 11:1 (11-18)).

Kernel Regression Trend LineKTrend – Non-Repainting Kernel Regression Trend (2025 Clean Version)
Ultra-clean, powerful, and completely non-repainting trend-following tool based on advanced Kernel regression (Rational Quadratic + Gaussian blend).
How it works:
• Uses two different kernel estimates with smart lag to detect genuine trend reversals
• Plots a thick, beautifully colored trend line (teal when rising, deep red when falling)
• Places precise, locked-in Bullish Flip (green triangle below bar) and Bearish Flip (red triangle above bar) signals only on confirmed bar close – zero repaint, ever
• Optional smoothing mode for even cleaner visuals
Features
✓ 100% non-repainting signals and line
✓ Minimal lag while staying extremely responsive
✓ Clean aesthetic – perfect for BTC, ETH, stocks, forex, any timeframe
✓ Built-in alerts for Bullish & Bearish flips
✓ Fully open source (MPL 2.0)
Default settings are already battle-tested and loved by thousands:
- Lookback Window: 11
- Relative Weighting: 8.0
- Regression Level: 25
- Lag: 2
Great on 1H–Daily charts, especially crypto and indices.
Credits: Original kernel library by jdehorty, cleaned & enhanced flip logic by HighlanderOne.
Enjoy the smoothest, most reliable kernel trend tool on TradingView – completely free!

BTC Energy + HR + Longs + M2
BTC Energy Ratio + Hashrate + Longs + M2
The #1 Bitcoin Macro Weapon on TradingView 🚀🔥
If you’re tired of getting chopped by fakeouts, ETF noise, and Twitter hopium — this is the one chart that finally puts you on the right side of every major move.
What you’re looking at:
Orange line → Bitcoin priced in real-world mining energy (Oil × Gas + Uranium × Coal) × 1000
→ The true fundamental floor of BTC
Blue line → Scaled hashrate trend (miner strength & capex lag)
Green line → Bitfinex longs EMA (leveraged bull sentiment)
Purple line → Global M2 money supply (US+EU+CN+JP) with 10-week lead (the liquidity wave BTC rides)
Why this indicator prints money:
Most tools react to price.
This one predicts where price is going based on energy, miners, leverage, and liquidity — the only four things that actually drive Bitcoin long-term.
It has nailed:
2022 bottom at ~924 📉
2024 breakout above 12,336 🚀
2025 top at 17,280 🏔️
And right now it’s flashing generational accumulation at ~11,500 (Nov 2025)
13 permanent levels with right-side labels — no guessing what anything means:
20,000 → 2021 Bull ATH
17,280 → 2025 ATH
15,000 → 2024 High Resist
14,000 → Overvalued Zone
13,000 → 2024 Breakout
12,336 → Bull/Bear Line (the most important level)
12,000 → 2024 Volume POC
10,930 → Key Support 2024
9,800 → Strong Buy Fib
8,000 → Deep Support 2023
6,000 → 2021 Mid-Cycle
4,500 → 2023 Accum Low
924 → 2022 Bear Low
Live dashboard tells you exactly what to do — no thinking required:
Current ratio (updates live)
Hashrate + 24H %
Longs trend
Risk Mode → Orange vs Hashrate (RISK ON / RISK OFF)
180-day correlation
RSI
13-tier Zone + SIGNAL (STRONG BUY / ACCUMULATE / HOLD / DISTRIBUTE / EXTREME SELL)
Dead-simple rules that actually work:
Weekly timeframe = cleanest view
Blue peaking + orange holding support → miner pain = next leg up
Green spiking + orange failing → overcrowded longs = trim
Purple rising → liquidity coming in = ride the wave
Risk Mode = RISK OFF → price is cheap vs miners → buy
Set these 3 alerts and walk away:
Ratio > 12,336 → Bull confirmed → add
Ratio > 14,000 → Start scaling out
Ratio < 9,800 → Generational buy → back up the truck
No repainting • Fully open-source • Forced daily data • Works on any TF
Energy is the only real backing Bitcoin has.
Hashrate lag is the best leading indicator.
Longs show greed.
M2 is the tide.
This chart combines all four — and right now it’s screaming ACCUMULATE.
Load it. Trust it.
Stop trading hope. Start trading reality.
DYOR • NFA • For entertainment purposes only 😎
#bitcoin #macro #energy #hashrate #m2 #cycle #riskon #riskoff

Flux-Tensor Singularity [FTS]Flux-Tensor Singularity - Multi-Factor Market Pressure Indicator
The Flux-Tensor Singularity (FTS) is an advanced multi-factor oscillator that combines volume analysis, momentum tracking, and volatility-weighted normalization to identify critical market inflection points. Unlike traditional single-factor indicators, FTS synthesizes price velocity, volume mass, and volatility context into a unified framework that adapts to changing market regimes.
This indicator identifies extreme market conditions (termed "singularities") where multiple confirming factors converge, then uses a sophisticated scoring system to determine directional bias. It is designed for traders seeking high-probability setups with built-in confluence requirements.
THEORETICAL FOUNDATION
The indicator is built on the premise that market time is not constant - different market conditions contain varying levels of information density. A 1-minute bar during a major news event contains far more actionable information than a 1-minute bar during overnight low-volume trading. Traditional indicators treat all bars equally; FTS does not.
The theoretical framework draws conceptual parallels to physics (purely as a mental model, not literal physics):
Volume as Mass: Large volume represents significant market participation and "weight" behind price moves. Just as massive objects have stronger gravitational effects, high-volume moves carry more significance.
Price Change as Velocity: The rate of price movement through price space represents momentum and directional force.
Volatility as Time Dilation: When volatility is high relative to its historical norm, the "information density" of each bar increases. The indicator weights these periods more heavily, similar to how time dilates near massive objects in physics.
This is a pedagogical metaphor to create a coherent mental model - the underlying mathematics are standard financial calculations combined in a novel way.
MATHEMATICAL FRAMEWORK
The indicator calculates a composite singularity value through four distinct steps:
Step 1: Raw Singularity Calculation
S_raw = (ΔP × V) × γ²
Where:
ΔP = Price Velocity = close - close
V = Volume Mass = log(volume + 1)
γ² = Time Dilation Factor = (ATR_local / ATR_global)²
Volume Transformation: Volume is log-transformed because raw volume can have extreme outliers (10x-100x normal). The logarithm compresses these spikes while preserving their significance. This is standard practice in volume analysis.
Volatility Weighting: The ratio of short-term ATR (5 periods) to long-term ATR (user-defined lookback) is squared to create a volatility amplification factor. When local volatility exceeds global volatility, this ratio increases, amplifying the raw singularity value. This makes the indicator regime-aware.
Step 2: Normalization
The raw singularity values are normalized to a 0-100 scale using a stochastic-style calculation:
S_normalized = ((S_raw - S_min) / (S_max - S_min)) × 100
Where S_min and S_max are the lowest and highest raw singularity values over the lookback period.
Step 3: Epsilon Compression
S_compressed = 50 + ((S_normalized - 50) / ε)
This is the critical innovation that makes the sensitivity control functional. By applying compression AFTER normalization, the epsilon parameter actually affects the final output:
ε < 1.0: Expands range (more signals)
ε = 1.0: No change (default)
ε > 1.0: Compresses toward 50 (fewer, higher-quality signals)
For example, with ε = 2.0, a normalized value of 90 becomes 70, making threshold breaches rarer and more significant.
Step 4: Smoothing
S_final = EMA(S_compressed, smoothing_period)
An exponential moving average removes high-frequency noise while preserving trend.
SIGNAL GENERATION LOGIC
When the tensor crosses above the upper threshold (default 90) or below the lower threshold (default 10), an extreme event is detected. However, the indicator does NOT immediately generate a buy or sell signal. Instead, it analyzes market context through a multi-factor scoring system:
Scoring Components:
Price Structure (+1 point): Current bar bullish/bearish
Momentum (+1 point): Price higher/lower than N bars ago
Trend Context (+2 points): Fast EMA above/below slow EMA (weighted heavier)
Acceleration (+1 point): Rate of change increasing/decreasing
Volume Multiplier (×1.5): If volume > average, multiply score
The highest score (bullish vs bearish) determines signal direction. This prevents the common indicator failure mode of "overbought can stay overbought" by requiring directional confirmation.
Signal Conditions:
A BUY signal requires:
Extreme event detection (tensor crosses threshold)
Bullish score > Bearish score
Price confirmation: Bullish candle (optional, user-controlled)
Volume confirmation: Volume > average (optional, user-controlled)
Momentum confirmation: Positive momentum (optional, user-controlled)
A SELL signal requires the inverse conditions.
INPUTS EXPLAINED - Core Parameters:
Global Horizon (Context): Default 20. Lookback period for normalization and volatility comparison. Higher values = smoother but less responsive. Lower values = more signals but potentially more noise.
Tensor Smoothing: Default 3. EMA period applied to final output. Removes "quantum foam" (high-frequency noise). Range 1-20.
Singularity Threshold: Default 90. Values above this (or below 100-threshold) trigger extreme event detection. Higher = rarer, stronger signals.
Signal Sensitivity (Epsilon): Default 1.0. Post-normalization compression factor. This is the key innovation - it actually works because it's applied AFTER normalization. Range 0.1-5.0.
Signal Interpreter Toggles:
Require Price Confirmation: Default ON. Only generates buy signals on bullish candles, sell signals on bearish candles. Reduces false signals but may delay entry.
Require Volume Confirmation: Default ON. Only signals when volume > average. Critical for stocks/crypto, less important for forex (unreliable volume data).
Use Momentum Filter: Default ON. Requires momentum agreement with signal direction. Prevents counter-trend signals.
Momentum Lookback: Default 5. Number of bars for momentum calculation. Shorter = more responsive, longer = trend-following bias.
Visual Controls:
Colors: Customizable colors for bullish flux, bearish flux, background, and event horizon.
Visual Transparency: Default 85. Master control for all visual elements (accretion disk, field lines, particles, etc.). Range 50-99. Signals and dashboard have separate controls.
Visibility Toggles: Individual on/off switches for:
Gravitational field lines (trend EMAs)
Field reversals (trend crossovers)
Accretion disk (background gradient)
Singularity diamonds (neutral extreme events)
Energy particles (volume bursts)
Event horizon flash (extreme event background)
Signal background flash
Signal Size: Tiny/Small/Normal triangle size
Signal Offsets: Separate controls for buy and sell signal vertical positioning (percentage of price)
Dashboard Settings:
Show Dashboard: Toggle on/off
Position: 9 placement options (all corners, centers, middles)
Text Size: Tiny/Small/Normal/Large
Background Transparency: 0-50, separate from visual transparency
VISUAL ELEMENTS EXPLAINED
1. Accretion Disk (Background Gradient):
A three-layer gradient background that intensifies as the tensor approaches extremes. The outer disk appears at any non-neutral reading, the inner disk activates above 70 or below 30, and the core layer appears above 85 or below 15. Color indicates direction (cyan = bullish, red = bearish). This provides instant visual feedback on market pressure intensity.
2. Gravitational Field Lines (EMAs):
Two trend-following EMAs (10 and 30 period) visualized as colored lines. These represent the "curvature" of market trend - when they diverge, trend is strong; when they converge, trend is weakening. Crossovers mark potential trend reversals.
3. Field Reversals (Circles):
Small circles appear when the fast EMA crosses the slow EMA, indicating a potential trend change. These are distinct from extreme events and appear at normal market structure shifts.
4. Singularity Diamonds:
Small diamond shapes appear when the tensor reaches extreme levels (>90 or <10) but doesn't meet the full signal criteria. These are "watch" events - extreme pressure exists but directional confirmation is lacking.
5. Energy Particles (Dots):
Tiny dots appear when volume exceeds 2× average, indicating significant participation. Color matches bar direction. These highlight genuine high-conviction moves versus low-volume drifts.
6. Event Horizon Flash:
A golden background flash appears the instant any extreme threshold is breached, before directional analysis. This alerts you to pay attention.
7. Signal Background Flash:
When a full buy/sell signal is confirmed, the background flashes cyan (buy) or red (sell). This is your primary alert that all conditions are met.
8. Signal Triangles:
The actual buy (▲) and sell (▼) markers. These only appear when ALL selected confirmation criteria are satisfied. Position is offset from bars to avoid overlap with other indicators.
DASHBOARD METRICS EXPLAINED
The dashboard displays real-time calculated values:
Event Density: Current tensor value (0-100). Above 90 or below 10 = critical. Icon changes: 🔥 (extreme high), ❄️ (extreme low), ○ (neutral).
Time Dilation (γ): Current volatility ratio squared. Values >2.0 indicate extreme volatility environments. >1.5 = elevated, >1.0 = above average. Icon: ⚡ (extreme), ⚠ (elevated), ○ (normal).
Mass (Vol): Log-transformed volume value. Compared to volume ratio (current/average). Icon: ● (>2× avg), ◐ (>1× avg), ○ (below avg).
Velocity (ΔP): Raw price change. Direction arrow indicates momentum direction. Shows the actual price delta value.
Bullish Flux: Current bullish context score. Displayed as both a bar chart (visual) and numeric value. Brighter when bullish score dominates.
Bearish Flux: Current bearish context score. Same visualization as bullish flux. These scores compete - the winner determines signal direction.
Field: Trend direction based on EMA relationship. "Repulsive" (uptrend), "Attractive" (downtrend), "Neutral" (ranging). Icon: ⬆⬇↔
State: Current market condition:
🚀 EJECTION: Buy signal active
💥 COLLAPSE: Sell signal active
⚠ CRITICAL: Extreme event, no directional confirmation
● STABLE: Normal market conditions
HOW TO USE THE INDICATOR
1. Wait for Extreme Events:
The indicator is designed to be selective. Don't trade every fluctuation - wait for tensor to reach >90 or <10. This alone is not a signal.
2. Check Context Scores:
Look at the Bullish Flux vs Bearish Flux in the dashboard. If scores are close (within 1-2 points), the market is indecisive - skip the trade.
3. Confirm with Signals:
Only act when a full triangle signal appears (▲ or ▼). This means ALL your selected confirmation criteria have been met.
4. Use with Price Structure:
Combine with support/resistance levels. A buy signal AT support is higher probability than a buy signal in the middle of nowhere.
5. Respect the Dashboard State:
When State shows "CRITICAL" (⚠), it means extreme pressure exists but direction is unclear. These are the most dangerous moments - wait for resolution.
6. Volume Matters:
Energy particles (dots) and the Mass metric tell you if institutions are participating. Signals without volume confirmation are lower probability.
MARKET AND TIMEFRAME RECOMMENDATIONS
Scalping (1m-5m):
Lookback: 10-14
Smoothing: 5-7
Threshold: 85
Epsilon: 0.5-0.7
Note: Expect more noise. Confirm with Level 2 data. Best on highly liquid instruments.
Intraday (15m-1h):
Lookback: 20-30 (default settings work well)
Smoothing: 3-5
Threshold: 90
Epsilon: 1.0
Note: Sweet spot for the indicator. High win rate on liquid stocks, forex majors, and crypto.
Swing Trading (4h-1D):
Lookback: 30-50
Smoothing: 3
Threshold: 90-95
Epsilon: 1.5-2.0
Note: Signals are rare but high conviction. Combine with higher timeframe trend analysis.
Position Trading (1D-1W):
Lookback: 50-100
Smoothing: 5-7
Threshold: 95
Epsilon: 2.0-3.0
Note: Extremely rare signals. Only trade the most extreme events. Expect massive moves.
Market-Specific Settings:
Forex (EUR/USD, GBP/USD, etc.):
Volume data is unreliable (spot forex has no centralized volume)
Disable "Require Volume Confirmation"
Focus on momentum and trend filters
News events create extreme singularities
Best on 15m-1h timeframes
Stocks (High-Volume Equities):
Volume confirmation is CRITICAL - keep it ON
Works excellently on AAPL, TSLA, SPY, etc.
Morning session (9:30-11:00 ET) shows highest event density
Earnings announcements create guaranteed extreme events
Best on 5m-1h for day trading, 1D for swing trading
Crypto (BTC, ETH, major alts):
Reduce threshold to 85 (crypto has constant high volatility)
Volume spikes are THE primary signal - keep volume confirmation ON
Works exceptionally well due to 24/7 trading and high volatility
Epsilon can be reduced to 0.7-0.8 for more signals
Best on 15m-4h timeframes
Commodities (Gold, Oil, etc.):
Gold responds to macro events (Fed announcements, geopolitical events)
Oil responds to supply shocks
Use daily timeframe minimum
Increase lookback to 50+
These are slow-moving markets - be patient
Indices (SPX, NDX, etc.):
Institutional volume matters - keep volume confirmation ON
Opening hour (9:30-10:30 ET) = highest singularity probability
Strong correlation with VIX - high VIX = more extreme events
Best on 15m-1h for day trading
WHAT MAKES THIS INDICATOR UNIQUE
1. Post-Normalization Sensitivity Control:
Unlike most oscillators where sensitivity controls don't actually work (they're applied before normalization, which then rescales everything), FTS applies epsilon compression AFTER normalization. This means the sensitivity parameter genuinely affects signal frequency. This is a novel implementation not found in standard oscillators.
2. Multi-Factor Confluence Requirement:
The indicator doesn't just detect "overbought" or "oversold" - it detects extreme conditions AND THEN analyzes context through five separate factors (price structure, momentum, trend, acceleration, volume). Most indicators are single-factor; FTS requires confluence.
3. Volatility-Weighted Normalization:
By squaring the ATR ratio (local/global), the indicator adapts to changing market regimes. A 1% move in a low-volatility environment is treated differently than a 1% move in a high-volatility environment. Traditional indicators treat all moves equally regardless of context.
4. Volume Integration at the Core:
Volume isn't an afterthought or optional filter - it's baked into the fundamental equation as "mass." The log transformation handles outliers elegantly while preserving significance. Most price-based indicators completely ignore volume.
5. Adaptive Scoring System:
Rather than fixed buy/sell rules ("RSI >70 = sell"), FTS uses competitive scoring where bullish and bearish evidence compete. The winner determines direction. This solves the classic problem of "overbought markets can stay overbought during strong uptrends."
6. Comprehensive Visual Feedback:
The multi-layer visualization system (accretion disk, field lines, particles, flashes) provides instant intuitive feedback on market state without requiring dashboard reading. You can see pressure building before extreme thresholds are hit.
7. Separate Extreme Detection and Signal Generation:
"Singularity diamonds" show extreme events that don't meet full criteria, while "signal triangles" only appear when ALL conditions are met. This distinction helps traders understand when pressure exists versus when it's actionable.
COMPARISON TO EXISTING INDICATORS
vs. RSI/Stochastic:
These normalize price relative to recent range. FTS normalizes (price change × log volume × volatility ratio) - a composite metric, not just price position.
vs. Chaikin Money Flow:
CMF combines price and volume but lacks volatility context and doesn't use adaptive normalization or post-normalization compression.
vs. Bollinger Bands + Volume:
Bollinger Bands show volatility but don't integrate volume or create a unified oscillator. They're separate components, not synthesized.
vs. MACD:
MACD is pure momentum. FTS combines momentum with volume weighting and volatility context, plus provides a normalized 0-100 scale.
The specific combination of log-volume weighting, squared volatility amplification, post-normalization epsilon compression, and multi-factor directional scoring is unique to this indicator.
LIMITATIONS AND PROPER DISCLOSURE
Not a Holy Grail:
No indicator is perfect. This tool identifies high-probability setups but cannot predict the future. Losses will occur. Use proper risk management.
Requires Confirmation:
Best used in conjunction with price action analysis, support/resistance levels, and higher timeframe trend. Don't trade signals blindly.
Volume Data Dependency:
On forex (spot) and some low-volume instruments, volume data is unreliable or tick-volume only. Disable volume confirmation in these cases.
Lagging Components:
The EMA smoothing and trend filters are inherently lagging. In extremely fast moves, signals may appear after the initial thrust.
Extreme Event Rarity:
With conservative settings (high threshold, high epsilon), signals can be rare. This is by design - quality over quantity. If you need more frequent signals, reduce threshold to 85 and epsilon to 0.7.
Not Financial Advice:
This indicator is an analytical tool. All trading decisions and their consequences are solely your responsibility. Past performance does not guarantee future results.
BEST PRACTICES
Don't trade every singularity - wait for context confirmation
Higher timeframes = higher reliability
Combine with support/resistance for entry refinement
Volume confirmation is CRITICAL for stocks/crypto (toggle off only for forex)
During major news events, singularities are inevitable but direction may be uncertain - use wider stops
When bullish and bearish flux scores are close, skip the trade
Test settings on your specific instrument/timeframe before live trading
Use the dashboard actively - it contains critical diagnostic information
Taking you to school. — Dskyz, Trade with insight. Trade with anticipation.

Mars Signals - Ultimate Institutional Suite v3.0(Joker)Comprehensive Trading Manual
Mars Signals – Ultimate Institutional Suite v3.0 (Joker)
## Chapter 1 – Philosophy & System Architecture
This script is not a simple “buy/sell” indicator.
Mars Signals – UIS v3.0 (Joker) is designed as an institutional-style analytical assistant that layers several methodologies into a single, coherent framework.
The system is built on four core pillars:
1. Smart Money Concepts (SMC)
- Detection of Order Blocks (professional demand/supply zones).
- Detection of Fair Value Gaps (FVGs) (price imbalances).
2. Smart DCA Strategy
- Combination of RSI and Bollinger Bands
- Identifies statistically discounted zones for scaling into spot positions or exiting shorts.
3. Volume Profile (Visible Range Simulation)
- Distribution of volume by price, not by time.
- Identification of POC (Point of Control) and high-/low-volume areas.
4. Wyckoff Helper – Spring
- Detection of bear traps, liquidity grabs, and sharp bullish reversals.
All four pillars feed into a Confluence Engine (Scoring System).
The final output is presented in the Dashboard, with a clear, human-readable signal:
- STRONG LONG 🚀
- WEAK LONG ↗
- NEUTRAL / WAIT
- WEAK SHORT ↘
- STRONG SHORT 🩸
This allows the trader to see *how many* and *which* layers of the system support a bullish or bearish bias at any given time.
## Chapter 2 – Settings Overview
### 2.1 General & Dashboard Group
- Show Dashboard Panel (`show_dash`)
Turns the dashboard table in the corner of the chart ON/OFF.
- Show Signal Recommendation (`show_rec`)
- If enabled, the textual signal (STRONG LONG, WEAK SHORT, etc.) is displayed.
- If disabled, you only see feature status (ON/OFF) and the current price.
- Dashboard Position (`dash_pos`)
Determines where the dashboard appears on the chart:
- `Top Right`
- `Bottom Right`
- `Top Left`
### 2.2 Smart Money (SMC) Group
- Enable SMC Strategy (`show_smc`)
Globally enables or disables the Order Block and FVG logic.
- Order Block Pivot Lookback (`ob_period`)
Main parameter for detecting key pivot highs/lows (swing points).
- Default value: 5
- Concept:
A bar is considered a pivot low if its low is lower than the lows of the previous 5 and the next 5 bars.
Similarly, a pivot high has a high higher than the previous 5 and the next 5 bars.
These pivots are used as anchors for Order Blocks.
- Increasing `ob_period`:
- Fewer levels.
- But levels tend to be more significant and reliable.
- In highly volatile markets (major news, war events, FOMC, etc.),
using values 7–10 is recommended to filter out weak levels.
- Show Fair Value Gaps (`show_fvg`)
Enables/disables the drawing of FVG zones (imbalances).
- Bullish OB Color (`c_ob_bull`)
- Color of Bullish Order Blocks (Demand Zones).
- Default: semi-transparent green (transparency ≈ 80).
- Bearish OB Color (`c_ob_bear`)
- Color of Bearish Order Blocks (Supply Zones).
- Default: semi-transparent red.
- Bullish FVG Color (`c_fvg_bull`)
- Color of Bullish FVG (upward imbalance), typically yellow.
- Bearish FVG Color (`c_fvg_bear`)
- Color of Bearish FVG (downward imbalance), typically purple.
### 2.3 Smart DCA Strategy Group
- Enable DCA Zones (`show_dca`)
Enables the Smart DCA logic and visual labels.
- RSI Length (`rsi_len`)
Lookback period for RSI (default: 14).
- Shorter → more sensitive, more noise.
- Longer → fewer signals, higher reliability.
- Bollinger Bands Length (`bb_len`)
Moving average period for Bollinger Bands (default: 20).
- BB Multiplier (`bb_mult`)
Standard deviation multiplier for Bollinger Bands (default: 2.0).
- For extremely volatile markets, values like 2.5–3.0 can be used so that only extreme deviations trigger a DCA signal.
### 2.4 Volume Profile (Visible Range Sim) Group
- Show Volume Profile (`show_vp`)
Enables the simulated Volume Profile bars on the right side of the chart.
- Volume Lookback Bars (`vp_lookback`)
Number of bars used to compute the Volume Profile (default: 150).
- Higher values → broader historical context, heavier computation.
- Row Count (`vp_rows`)
Number of vertical price segments (rows) to divide the total price range into (default: 30).
- Width (%) (`vp_width`)
Relative width of each volume bar as a percentage.
In the code, bar widths are scaled relative to the row with the maximum volume.
> Technical note: Volume Profile calculations are executed only on the last bar (`barstate.islast`) to keep the script performant even on higher timeframes.
### 2.5 Wyckoff Helper Group
- Show Wyckoff Events (`show_wyc`)
Enables detection and plotting of Wyckoff Spring events.
- Volume MA Length (`vol_ma_len`)
Length of the moving average on volume.
A bar is considered to have Ultra Volume if its volume is more than 2× the volume MA.
## Chapter 3 – Smart Money Strategy (Order Blocks & FVG)
### 3.1 What Is an Order Block?
An Order Block (OB) represents the footprint of large institutional orders:
- Bullish Order Block (Demand Zone)
The last selling region (bearish candle/cluster) before a strong upward move.
- Bearish Order Block (Supply Zone)
The last buying region (bullish candle/cluster) before a strong downward move.
Institutions and large players place heavy orders in these regions. Typical price behavior:
- Price moves away from the zone.
- Later returns to the same zone to fill unfilled orders.
- Then continues the larger trend.
In the script:
- If `pl` (pivot low) forms → a Bullish OB is created.
- If `ph` (pivot high) forms → a Bearish OB is created.
The box is drawn:
- From `bar_index ` to `bar_index`.
- Between `low ` and `high `.
- `extend=extend.right` extends the OB into the future, so it acts as a dynamic support/resistance zone.
- Only the last 4 OB boxes are kept to avoid clutter.
### 3.2 Order Block Color Guide
- Semi-transparent Green (`c_ob_bull`)
- Represents a Bullish Order Block (Demand Zone).
- Interpretation: a price region with a high probability of bullish reaction.
- Semi-transparent Red (`c_ob_bear`)
- Represents a Bearish Order Block (Supply Zone).
- Interpretation: a price region with a high probability of bearish reaction.
Overlap (Multiple OBs in the Same Area)
When two or more Order Blocks overlap:
- The shared area appears visually denser/stronger.
- This suggests higher order density.
- Such zones can be treated as high-priority levels for entries, exits, and stop-loss placement.
### 3.3 Demand/Supply Logic in the Scoring Engine
is_in_demand = low <= ta.lowest(low, 20)
is_in_supply = high >= ta.highest(high, 20)
- If current price is near the lowest lows of the last 20 bars, it is considered in a Demand Zone → positive impact on score.
- If current price is near the highest highs of the last 20 bars, it is considered in a Supply Zone → negative impact on score.
This logic complements Order Blocks and helps the Dashboard distinguish whether:
- Market is currently in a statistically cheap (long-friendly) area, or
- In a statistically expensive (short-friendly) area.
### 3.4 Fair Value Gaps (FVG)
#### Concept
When the market moves aggressively:
- Some price levels are skipped and never traded.
- A gap between wicks/shadows of consecutive candles appears.
- These regions are called Fair Value Gaps (FVGs) or Imbalances.
The market generally “dislikes” imbalance and often:
- Returns to these zones in the future.
- Fills the gap (rebalance).
- Then resumes its dominant direction.
#### Implementation in the Code
Bullish FVG (Yellow)
fvg_bull_cond = show_smc and show_fvg and low > high and close > high
if fvg_bull_cond
box.new(bar_index , high , bar_index, low, ...)
Core condition:
`low > high ` → the current low is above the high of two bars ago; the space between them is an untraded gap.
Bearish FVG (Purple)
fvg_bear_cond = show_smc and show_fvg and high < low and close < low
if fvg_bear_cond
box.new(bar_index , low , bar_index, high, ...)
Core condition:
`high < low ` → the current high is below the low of two bars ago; again a price gap exists.
#### FVG Color Guide
- Transparent Yellow (`c_fvg_bull`) – Bullish FVG
Often acts like a magnet for price:
- Price tends to retrace into this zone,
- Fill the imbalance,
- And then continue higher.
- Transparent Purple (`c_fvg_bear`) – Bearish FVG
Price tends to:
- Retrace upward into the purple area,
- Fill the imbalance,
- And then resume downward movement.
#### Trading with FVGs
- FVGs are *not* standalone entry signals.
They are best used as:
- Targets (take-profit zones), or
- Reaction areas where you expect a pause or reversal.
Examples:
- If you are long, a bearish FVG above is often an excellent take-profit zone.
- If you are short, a bullish FVG below is often a good cover/exit zone.
### 3.5 Core SMC Trading Templates
#### Reversal Long
1. Price trades down into a green Order Block (Demand Zone).
2. A bullish confirmation candle (Close > Open) forms inside or just above the OB.
3. If this zone is close to or aligned with a bullish FVG (yellow), the signal is reinforced.
4. Entry:
- At the close of the confirmation candle, or
- Using a limit order near the upper boundary of the OB.
5. Stop-loss:
- Slightly below the OB.
- If the OB is broken decisively and price consolidates below it, the zone loses validity.
6. Targets:
- The next FVG,
- Or the next red Order Block (Supply Zone) above.
#### Reversal Short
The mirror scenario:
- Price rallies into a red Order Block (Supply).
- A bearish confirmation candle forms (Close < Open).
- FVG/premium structure above can act as a confluence.
- Stop-loss goes above the OB.
- Targets: lower FVGs or subsequent green OBs below.
## Chapter 4 – Smart DCA Strategy (RSI + Bollinger Bands)
### 4.1 Smart DCA Concept
- Classic DCA = buying at fixed time intervals regardless of price.
- Smart DCA = scaling in only when:
- Price is statistically cheaper than usual, and
- The market is in a clear oversold condition.
Code logic:
rsi_val = ta.rsi(close, rsi_len)
= ta.bb(close, bb_len, bb_mult)
dca_buy = show_dca and rsi_val < 30 and close < bb_lower
dca_sell = show_dca and rsi_val > 70 and close > bb_upper
Conditions:
- DCA Buy – Smart Scale-In Zone
- RSI < 30 → oversold.
- Close < lower Bollinger Band → price has broken below its typical volatility envelope.
- DCA Sell – Overbought/Distribution Zone
- RSI > 70 → overbought.
- Close > upper Bollinger Band → price is extended far above the mean.
### 4.2 Visual Representation on the Chart
- Green “DCA” Label Below Candle
- Shape: `labelup`.
- Color: lime background, white text.
- Meaning: statistically attractive level for laddered spot entries or short exits.
- Red “SELL” Label Above Candle
- Warning that the market is in an extended, overbought condition.
- Suitable for profit-taking on longs or considering short entries (with proper confluence and risk management).
- Light Green Background (`bgcolor`)
- When `dca_buy` is true, the candle background turns very light green (high transparency).
- This helps visually identify DCA Zones across the chart at a glance.
### 4.3 Practical Use in Trading
#### Spot Trading
Used to build a better average entry price:
- Every time a DCA label appears, allocate a fixed portion of capital (e.g., 2–5%).
- Combining DCA signals with:
- Green OBs (Demand Zones), and/or
- The Volume Profile POC
makes the zone structurally more important.
#### Futures Trading
- Longs
- Use DCA Buy signals as low-risk zones for opening or adding to longs when:
- Price is inside a green OB, or
- The Dashboard already leans LONG.
- Shorts
- Use DCA Sell signals as:
- Exit zones for longs, or
- Areas to initiate shorts with stops above structural highs.
## Chapter 5 – Volume Profile (Visible Range Simulation)
### 5.1 Concept
Traditional volume (histogram under the chart) shows volume over time.
Volume Profile shows volume by price level:
- At which prices has the highest trading activity occurred?
- Where did buyers and sellers agree the most (High Volume Nodes – HVNs)?
- Where did price move quickly due to low participation (Low Volume Nodes – LVNs)?
### 5.2 Implementation in the Script
Executed only when `show_vp` is enabled and on the last bar:
1. The last `vp_lookback` bars (default 150) are processed.
2. The minimum low and maximum high over this window define the price range.
3. This price range is divided into `vp_rows` segments (e.g., 30 rows).
4. For each row:
- All bars are scanned.
- If the mid-price `(high + low ) / 2` falls inside a row, that bar’s volume is added to the row total.
5. The row with the greatest volume is stored as `max_vol_idx` (the POC row).
6. For each row, a volume box is drawn on the right side of the chart.
### 5.3 Color Scheme
- Semi-transparent Orange
- The row with the maximum volume – the Point of Control (POC).
- Represents the strongest support/resistance level from a volume perspective.
- Semi-transparent Blue
- Other volume rows.
- The taller the bar → the higher the volume → the stronger the interest at that price band.
### 5.4 Trading Applications
- If price is above POC and retraces back into it:
→ POC often acts as support, suitable for long setups.
- If price is below POC and rallies into it:
→ POC often acts as resistance, suitable for short setups or profit-taking.
HVNs (Tall Blue Bars)
- Represent areas of equilibrium where the market has spent time and traded heavily.
- Price tends to consolidate here before choosing a direction.
LVNs (Short or Nearly Empty Bars)
- Represent low participation zones.
- Price often moves quickly through these areas – useful for targeting fast moves.
## Chapter 6 – Wyckoff Helper – Spring
### 6.1 Spring Concept
In the Wyckoff framework:
- A Spring is a false break of support.
- The market briefly trades below a well-defined support level, triggers stop losses,
then sharply reverses upward as institutional buyers absorb liquidity.
This movement:
- Clears out weak hands (retail sellers).
- Provides large players with liquidity to enter long positions.
- Often initiates a new uptrend.
### 6.2 Code Logic
Conditions for a Spring:
1. The current low is lower than the lowest low of the previous 50 bars
→ apparent break of a long-standing support.
2. The bar closes bullish (Close > Open)
→ the breakdown was rejected.
3. Volume is significantly elevated:
→ `volume > 2 × volume_MA` (Ultra Volume).
When all conditions are met and `show_wyc` is enabled:
- A pink diamond is plotted below the bar,
- With the label “Spring” – one of the strongest long signals in this system.
### 6.3 Trading Use
- After a valid Spring, markets frequently enter a meaningful bullish phase.
- The highest quality setups occur when:
- The Spring forms inside a green Order Block, and
- Near or on the Volume Profile POC.
Entries:
- At the close of the Spring bar, or
- On the first pullback into the mid-range of the Spring candle.
Stop-loss:
- Slightly below the Spring’s lowest point (wick low plus a small buffer).
## Chapter 7 – Confluence Engine & Dashboard
### 7.1 Scoring Logic
For each bar, the script:
1. Resets `score` to 0.
2. Adjusts the score based on different signals.
SMC Contribution
if show_smc
if is_in_demand
score += 1
if is_in_supply
score -= 1
- Being in Demand → `+1`
- Being in Supply → `-1`
DCA Contribution
if show_dca
if dca_buy
score += 2
if dca_sell
score -= 2
- DCA Buy → `+2` (strong, statistically driven long signal)
- DCA Sell → `-2`
Wyckoff Spring Contribution
if show_wyc
if wyc_spring
score += 2
- Spring → `+2` (entry of strong money)
### 7.2 Mapping Score to Dashboard Signal
- score ≥ 2 → STRONG LONG 🚀
Multiple bullish conditions aligned.
- score = 1 → WEAK LONG ↗
Some bullish bias, but only one layer clearly positive.
- score = 0 → NEUTRAL / WAIT
Rough balance between buying and selling forces; staying flat is usually preferable.
- score = -1 → WEAK SHORT ↘
Mild bearish bias, suited for cautious or short-term plays.
- score ≤ -2 → STRONG SHORT 🩸
Convergence of several bearish signals.
### 7.3 Dashboard Structure
The dashboard is a two-column table:
- Row 0
- Column 0: `"Mars Signals"` – black background, white text.
- Column 1: `"UIS v3.0"` – black background, yellow text.
- Row 1
- Column 0: `"Price:"` (light grey background).
- Column 1: current closing price (`close`) with a semi-transparent blue background.
- Row 2
- Column 0: `"SMC:"`
- Column 1:
- `"ON"` (green) if `show_smc = true`
- `"OFF"` (grey) otherwise.
- Row 3
- Column 0: `"DCA:"`
- Column 1:
- `"ON"` (green) if `show_dca = true`
- `"OFF"` (grey) otherwise.
- Row 4
- Column 0: `"Signal:"`
- Column 1: signal text (`status_txt`) with background color `status_col`
(green, red, teal, maroon, etc.)
- If `show_rec = false`, these cells are cleared.
## Chapter 8 – Visual Legend (Colors, Shapes & Actions)
For quick reading inside TradingView, the visual elements are described line by line instead of a table.
Chart Element: Green Box
Color / Shape: Transparent green rectangle
Core Meaning: Bullish Order Block (Demand Zone)
Suggested Trader Response: Look for longs, Smart DCA adds, closing or reducing shorts.
Chart Element: Red Box
Color / Shape: Transparent red rectangle
Core Meaning: Bearish Order Block (Supply Zone)
Suggested Trader Response: Look for shorts, or take profit on existing longs.
Chart Element: Yellow Area
Color / Shape: Transparent yellow zone
Core Meaning: Bullish FVG / upside imbalance
Suggested Trader Response: Short take-profit zone or expected rebalance area.
Chart Element: Purple Area
Color / Shape: Transparent purple zone
Core Meaning: Bearish FVG / downside imbalance
Suggested Trader Response: Long take-profit zone or temporary supply region.
Chart Element: Green "DCA" Label
Color / Shape: Green label with white text, plotted below the candle
Core Meaning: Smart ladder-in buy zone, DCA buy opportunity
Suggested Trader Response: Spot DCA entry, partial short exit.
Chart Element: Red "SELL" Label
Color / Shape: Red label with white text, plotted above the candle
Core Meaning: Overbought / distribution zone
Suggested Trader Response: Take profit on longs, consider initiating shorts.
Chart Element: Light Green Background (bgcolor)
Color / Shape: Very transparent light-green background behind bars
Core Meaning: Active DCA Buy zone
Suggested Trader Response: Treat as a discount zone on the chart.
Chart Element: Orange Bar on Right
Color / Shape: Transparent orange horizontal bar in the volume profile
Core Meaning: POC – price with highest traded volume
Suggested Trader Response: Strong support or resistance; key reference level.
Chart Element: Blue Bars on Right
Color / Shape: Transparent blue horizontal bars in the volume profile
Core Meaning: Other volume levels, showing high-volume and low-volume nodes
Suggested Trader Response: Use to identify balance zones (HVN) and fast-move corridors (LVN).
Chart Element: Pink "Spring" Diamond
Color / Shape: Pink diamond with white text below the candle
Core Meaning: Wyckoff Spring – liquidity grab and potential major bullish reversal
Suggested Trader Response: One of the strongest long signals in the suite; look for high-quality long setups with tight risk.
Chart Element: STRONG LONG in Dashboard
Color / Shape: Green background, white text in the Signal row
Core Meaning: Multiple bullish layers in confluence
Suggested Trader Response: Consider initiating or increasing longs with strict risk management.
Chart Element: STRONG SHORT in Dashboard
Color / Shape: Red background, white text in the Signal row
Core Meaning: Multiple bearish layers in confluence
Suggested Trader Response: Consider initiating or increasing shorts with a logical, well-placed stop.
## Chapter 9 – Timeframe-Based Trading Playbook
### 9.1 Timeframe Selection
- Scalping
- Timeframes: 1M, 5M, 15M
- Objective: fast intraday moves (minutes to a few hours).
- Recommendation: focus on SMC + Wyckoff.
Smart DCA on very low timeframes may introduce excessive noise.
- Day Trading
- Timeframes: 15M, 1H, 4H
- Provides a good balance between signal quality and frequency.
- Recommendation: use the full stack – SMC + DCA + Volume Profile + Wyckoff + Dashboard.
- Swing Trading & Position Investing
- Timeframes: Daily, Weekly
- Emphasis on Smart DCA + Volume Profile.
- SMC and Wyckoff are used mainly to fine-tune swing entries within larger trends.
### 9.2 Scenario A – Scalping Long
Example: 5-Minute Chart
1. Price is declining into a green OB (Bullish Demand).
2. A candle with a long lower wick and bullish close (Pin Bar / Rejection) forms inside the OB.
3. A Spring diamond appears below the same candle → very strong confluence.
4. The Dashboard shows at least WEAK LONG ↗, ideally STRONG LONG 🚀.
5. Entry:
- On the close of the confirmation candle, or
- On the first pullback into the mid-range of that candle.
6. Stop-loss:
- Slightly below the OB.
7. Targets:
- Nearby bearish FVG above, and/or
- The next red OB.
### 9.3 Scenario B – Day-Trading Short
Recommended Timeframes: 1H or 4H
1. The market completes a strong impulsive move upward.
2. Price enters a red Order Block (Supply).
3. In the same zone, a purple FVG appears or remains unfilled.
4. On a lower timeframe (e.g., 15M), RSI enters overbought territory and a DCA Sell signal appears.
5. The main timeframe Dashboard (1H) shows WEAK SHORT ↘ or STRONG SHORT 🩸.
Trade Plan
- Open a short near the upper boundary of the red OB.
- Place the stop above the OB or above the last swing high.
- Targets:
- A yellow FVG lower on the chart, and/or
- The next green OB (Demand) below.
### 9.4 Scenario C – Swing / Investment with Smart DCA
Timeframes: Daily / Weekly
1. On the daily or weekly chart, each time a green “DCA” label appears:
- Allocate a fixed fraction of your capital (e.g., 3–5%) to that asset.
2. Check whether this DCA zone aligns with the orange POC of the Volume Profile:
- If yes → the quality of the entry zone is significantly higher.
3. If the DCA signal sits inside a daily green OB, the probability of a medium-term bottom increases.
4. Always build the position laddered, never all-in at a single price.
Exits for investors:
- Near weekly red OBs or large purple FVG zones.
- Ideally via partial profit-taking rather than closing 100% at once.
### 9.5 Case Study 1 – BTCUSDT (15-Minute)
- Context: Price has sold off down towards 65,000 USD.
- A green OB had previously formed at that level.
- Near the lower boundary of this OB, a partially filled yellow FVG is present.
- As price returns to this region, a Spring appears.
- The Dashboard shifts from NEUTRAL / WAIT to WEAK LONG ↗.
Plan
- Enter a long near the OB low.
- Place stop below the Spring low.
- First target: a purple FVG around 66,200.
- Second (optional) target: the first red OB above that level.
### 9.6 Case Study 2 – Meme Coin (PEPE – 4H)
- After a strong pump, price enters a corrective phase.
- On the 4H chart, RSI drops below 30; price breaks below the lower Bollinger Band → a DCA label prints.
- The Volume Profile shows the POC at approximately the same level.
- The Dashboard displays STRONG LONG 🚀.
Plan
- Execute laddered buys in the combined DCA + POC zone.
- Place a protective stop below the last significant swing low.
- Target: an expected 20–30% upside move towards the next red OB or purple FVG.
## Chapter 10 – Risk Management, Psychology & Advanced Tuning
### 10.1 Risk Management
No signal, regardless of its strength, replaces risk control.
Recommendations:
- In futures, do not expose more than 1–3% of account equity to risk per trade.
- Adjust leverage to the volatility of the instrument (lower leverage for highly volatile altcoins).
- Place stop-losses in zones where the idea is clearly invalidated:
- Below/above the relevant Order Block or Spring, not randomly in the middle of the structure.
### 10.2 Market-Specific Parameter Tuning
- Calmer Markets (e.g., major FX pairs)
- `ob_period`: 3–5.
- `bb_mult`: 2.0 is usually sufficient.
- Highly Volatile Markets (Crypto, news-driven assets)
- `ob_period`: 7–10 to highlight only the most robust OBs.
- `bb_mult`: 2.5–3.0 so that only extreme deviations trigger DCA.
- `vol_ma_len`: increase (e.g., to ~30) so that Spring triggers only on truly exceptional
volume spikes.
### 10.3 Trading Psychology
- STRONG LONG 🚀 does not mean “risk-free”.
It means the probability of a successful long, given the model’s logic, is higher than average.
- Treat Mars Signals as a confirmation and context system, not a full replacement for your own decision-making.
- Example of disciplined thinking:
- The Dashboard prints STRONG LONG,
- But price is simultaneously testing a multi-month macro resistance or a major negative news event is imminent,
- In such cases, trade smaller, widen stops appropriately, or skip the trade.
## Chapter 11 – Technical Notes & FAQ
### 11.1 Does the Script Repaint?
- Order Blocks and Springs are based on completed pivot structures and confirmed candles.
- Until a pivot is confirmed, an OB does not exist; after confirmation, behavior is stable under classic SMC assumptions.
- The script is designed to be structurally consistent rather than repainting signals arbitrarily.
### 11.2 Computational Load of Volume Profile
- On the last bar, the script processes up to `vp_lookback` bars × `vp_rows` rows.
- On very low timeframes with heavy zooming, this can become demanding.
- If you experience performance issues:
- Reduce `vp_lookback` or `vp_rows`, or
- Temporarily disable Volume Profile (`show_vp = false`).
### 11.3 Multi-Timeframe Behavior
- This version of the script is not internally multi-timeframe.
All logic (OB, DCA, Spring, Volume Profile) is computed on the active timeframe only.
- Practical workflow:
- Analyze overall structure and key zones on higher timeframes (4H / Daily).
- Use lower timeframes (15M / 1H) with the same tool for timing entries and exits.
## Conclusion
Mars Signals – Ultimate Institutional Suite v3.0 (Joker) is a multi-layer trading framework that unifies:
- Price structure (Order Blocks & FVG),
- Statistical behavior (Smart DCA via RSI + Bollinger),
- Volume distribution by price (Volume Profile with POC, HVN, LVN),
- Liquidity events (Wyckoff Spring),
into a single, coherent system driven by a transparent Confluence Scoring Engine.
The final output is presented in clear, actionable language:
> STRONG LONG / WEAK LONG / NEUTRAL / WEAK SHORT / STRONG SHORT
The system is designed to support professional decision-making, not to replace it.
Used together with strict risk management and disciplined execution,
Mars Signals – UIS v3.0 (Joker) can serve as a central reference manual and operational guide
for your trading workflow, from scalping to swing and investment positioning.

BOS/CHOCH Demand & SupplyThis indicator automatically identifies and plots Supply and Demand zones based on Smart Money Concepts (SMC) methodology. It detects structural breaks in price action and marks the origin zones that initiated these moves.
How It Works (Technical Methodology)
1. Swing Point Detection
The indicator uses Pine Script's ta.pivothigh() and ta.pivotlow() functions to identify swing highs and lows. Users can input multiple lookback periods (e.g., 1, 2, 3, 5, 11, 15, 20) to detect structure across different timeframe perspectives simultaneously.
2. Break of Structure (BOS) Detection
A Bullish BOS is confirmed when:
Current candle closes above the last swing high
Previous candle's high was still below that swing high
The current swing high is higher than the previous swing high (trend continuation)
A Bearish BOS is confirmed when:
Current candle closes below the last swing low
Previous candle's low was still above that swing low
The current swing low is lower than the previous swing low (trend continuation)
3. Change of Character (CHOCH) Detection
A Bullish CHOCH is confirmed when:
Price breaks above the last swing high
But that swing high was lower than the previous swing high (potential reversal signal)
A Bearish CHOCH is confirmed when:
Price breaks below the last swing low
But that swing low was higher than the previous swing low (potential reversal signal)
4. Inducement / Liquidity Grab Filter (Optional)
When enabled, zones are only drawn if the swing point that created them first grabbed liquidity from the previous swing:
For Demand zones: The swing low must have traded below the previous swing low before the bullish break
For Supply zones: The swing high must have traded above the previous swing high before the bearish break
This filter helps identify higher-probability zones where stop-losses were likely triggered before the move.
5. Zone Construction
Demand Zone (Bullish):
Top boundary: max(open, close) of the swing low candle
Bottom boundary: low of the swing low candle
Supply Zone (Bearish):
Top boundary: high of the swing high candle
Bottom boundary: min(open, close) of the swing high candle
This captures the candle body-to-wick range where institutional orders likely reside.
6. Zone Lifecycle Management
Active Zone: Displayed in green (demand) or red (supply)
Mitigated Zone: When price touches the zone but doesn't break it, the zone turns gray (indicating partial fill)
Broken Zone: When price fully breaks through the zone, it is automatically deleted from the chart
How to Use
Demand Zones (Green): Look for long entries when price returns to these zones. The zone represents where buying pressure previously overcame selling.
Supply Zones (Red): Look for short entries when price returns to these zones. The zone represents where selling pressure previously overcame buying.
BOS Zones: Indicate trend continuation - trade in the direction of the break.
CHOCH Zones: Indicate potential reversal - these are early warning signals of trend change.
Enable "Require Inducement" for higher-quality setups where liquidity was grabbed before the structural break.
Multi-Lookback Periods: Using multiple values helps identify zones across different structural levels. Smaller values catch minor structure; larger values catch major structure.
Disclaimer
This indicator is a technical analysis tool and should be used in conjunction with other forms of analysis. Past performance does not guarantee future results. Always use proper risk management.
NASDAQ 5MIN — 8×13 EMA + VWAP Pro Setup (2025)NASDAQ 5MIN — 8×13 EMA + VWAP Pro Setup (2025 Funded Trader Edition)
by ASALEH2297
The exact same 5-minute Nasdaq scalping system that multiple 6- and 7-figure funded accounts are running live in 2025 – now public.
100 % mechanical, zero repaint, zero guesswork.
Core Rules (executed instantly when the arrow prints):
• 8 EMA crosses 13 EMA
• Must be on the correct side of daily VWAP AND sloping 34 EMA
• Price closed beyond the 34 EMA
• High-confidence filter = price well away from VWAP + fast 8 EMA trending + volume spike → massive bright “3↑ / 3↓” arrow (load full size)
• Normal confidence = small arrow (normal or half size)
Key Features:
• Automatic dynamic swing stops plotted in real-time (6-point buffer beyond prior 10-bar extreme – the exact 2025 NQ stop method)
• Clean, impossible-to-miss arrows (huge bright for Conf 3, small for regular)
• Built-in alert conditions so “LONG (Conf 3)” and “SHORT (Conf 3)” appear instantly in mobile/desktop alerts
• Works perfectly on NQ1! (full) and MNQ1! (micro) 5-minute charts
• Best sessions: 09:30–11:30 ET and 14:00–16:00 ET
How to trade it:
1. Big 3-arrow appears on closed bar → market order in
2. Stop = red dashed line (already drawn)
3. Scale out 50 % at +40 pts NQ / +20 pts MNQ, move rest to breakeven, trail with 13 EMA
Pine Script v6 – zero errors, zero warnings.
Used daily on live funded desks. Add it, set the two Conf-3 alerts, and let the phone scream only when the real money prints.
“When the 3↑ hits… the bag follows.”
— ASALEH2297

oct25libLibrary of technical indicators for use in scripts.
1) salmav3(src, length, smooth, mult, sd_len)
Parameters:
src (float)
length (int)
smooth (simple int)
mult(float)
sd_len(int)
2) boltzman(src, length, T, alpha, smoothLen)
Parameters:
src (float)
length (int)
T(float)
Alpha(float)
smoothLen (simple int)
3) shannon(src, vol, len, bc, vc, smooth)
Parameters:
src (float)
vol (float)
len (int)
bc (bool)
vc (bool)
smooth (simple int)
4) vama(src, baseLen, volLen, beta)
Parameters:
src (float)
baseLen (int)
volLen (int)
beta (float)
5) fwma(src, period, lambda, smooth)
Parameters:
src (float)
period (int)
lambda (float)
smooth (simple int)
6) savitzky(srcc, srch, srcl, length)
Parameters:
srcc (float)
srch (float)
srcl (float)
length (int)
7) butterworth(src, length, poles, smooth)
Parameters:
src (float)
length (int)
poles (int)
smooth (simple int)
8) rti(src, trend_data_count, trend_sensitivity_percentage, midline, smooth)
Parameters:
src (float)
trend_data_count (int)
trend_sensitivity_percentage (int)
midline (int)
smooth (simple int)
9) chandemo(src, length, smooth)
Parameters:
src (float)
length (int)
smooth (simple int)
10) hsma(assetClose, length, emalen, midline)
Parameters:
assetClose (float)
length (int)
emalen (simple int)
midline (float)
11) rsi(src, rsiLengthInput, rsiemalen, midline)
Parameters:
src (float)
rsiLengthInput (simple int)
rsiemalen (simple int)
midline (float)
12) lacoca(src, lookback, malen, matype)
Parameters:
src (float)
lookback (int)
malen (simple int)
matype (string)

GOLD 5MIN — 9×21 EMA Entry Arrows (Pro Setup)GOLD 5MIN — 9×21 EMA Entry Arrows (Pro Setup) — 2025 Funded Trader Edition
The exact same 5-minute gold scalping strategy used daily by multiple 6- and 7-figure funded accounts in 2025.
Core Logic (mechanical – no discretion):
• Entry only on 9 × 21 EMA crossover
• Must be in direction of 50 EMA + 200 EMA trend
• Price must close above/below 50 EMA
• High-confidence filter: price above 200 EMA + fast 9 EMA rising + elevated volume = big bright “3↑” / “3↓” arrow (full size)
• Normal confidence = small “↑” / “↓” arrow (normal or half size)
Features:
• Automatic dynamic swing stops plotted in real-time (3 ticks beyond prior swing low/high – the exact 2025 stop method that dropped stop-outs from ~65 % to ~31 %)
• Clean, high-visibility arrows (large bright for confidence 3, small for normal)
• Zero repainting – signals only on bar close
• Built for GC1! and MG1! (full and micro gold) on the 5-minute timeframe
• Best performance: London open (02:00–04:30 ET) and NY open (09:30–11:30 ET)
How to trade:
1. Arrow appears on closed bar → market order in
2. Stop = red dashed line (already drawn)
3. First target 50 % at +20 ticks, move rest to breakeven at +15 ticks, trail with 21 EMA
“When the 3↑ hits… the bag follows.”
— ASALEH2297

Luxy Sector & Industry RS AnalyzerEver wonder why some stocks soar while others in the same sector barely move? Or why your perfectly timed entry still loses money? Possibly the answer can be found in Relative Strength.
The Luxy Sector & Industry RS Analyzer solves a critical problem that most traders overlook: picking strong stocks in strong sectors AND strong industries . It's not enough for a stock to go up - you want stocks that are crushing their competition at both the sector AND industry level. This indicator does the heavy lifting by automatically comparing your stock against its sector ETF, industry ETF, the broader market, sector leader, and industry leader, giving you a complete multi-level picture of relative performance.
What makes this different?
- Automatic sector AND industry detection - no manual setup required
- Multi-level hierarchy analysis: Market → Sector → Industry → Stock
- Multi-timeframe analysis (1 month to 1 year) in one glance
- Industry ETF mapping (30+ industries covered)
- Clear 0-100 scoring system with letter grades (A+ to F)
- Works on stocks, crypto, forex, and commodities
- Real-time updates with anti-repaint protection
Think of it as your performance dashboard - instantly showing you if you're trading a champion or a laggard at every level of the market hierarchy.
METHODOLOGY & ATTRIBUTION
This indicator is based on classical Relative Strength (RS) analysis principles from technical analysis. RS methodology compares an asset's price performance against a benchmark to identify relative outperformance or underperformance. This concept has been used by professional traders and institutions for decades.
Key Concepts Used:
Relative Strength (RS) - Classical technical analysis concept measuring comparative performance
Multi-Level Hierarchy Analysis - Market → Sector → Industry → Stock comparison
Sector Rotation Analysis - Identifying which sectors are leading or lagging the market
Industry Rotation Analysis - Identifying which industries are leading within their sectors
Multi-period Performance Analysis - Evaluating strength across multiple timeframes
Beta Calculation - Standard statistical measure of volatility relative to a benchmark
DISCLAIMER: This indicator is for educational and informational purposes only. It should not be considered financial advice or a recommendation to buy or sell. Past performance does not guarantee future results. Trading involves risk and may not be suitable for all investors. Always do your own research and consult with a financial advisor before making investment decisions.
with all rows visible - capture when stock has strong RS score (70+) so users can see what a "good" setup looks like]
WHAT THE INDICATOR SHOWS
1. AUTOMATIC ASSET TYPE DETECTION
The indicator automatically identifies what you're analyzing and adjusts accordingly:
Stocks - Compares to sector ETF (XLK, XLF, XLV, etc.) and SPY
Crypto - Compares to Total Crypto Market Cap and Bitcoin
Forex - Compares to relevant currency index (DXY, EXY, etc.)
Commodities - Compares to Gold (GLD) as benchmark
Indices - Compares to broader market indices
How it works: The indicator reads your chart's asset type and ticker, then automatically maps it to the correct sector or benchmark. For stocks, it uses intelligent sector detection (looking at the sector field) to match you with the right sector ETF. For example:
- Technology stocks get compared to XLK (Technology Select Sector SPDR)
- Financial stocks get compared to XLF (Financial Select Sector SPDR)
- Healthcare stocks get compared to XLV (Health Care Select Sector SPDR)
This happens instantly when you add the indicator to any chart - no configuration needed.
2. SECTOR & MARKET BENCHMARKS
What is a Sector ETF?
A sector ETF is an exchange-traded fund that tracks a specific industry group. For example, XLK contains all major technology companies. By comparing your stock to its sector ETF, you can see if your stock is outperforming or underperforming its peers.
The indicator shows three key comparison points:
Stock vs Sector (Benchmark)
This tells you how your stock performs compared to companies in the same industry. Positive numbers mean your stock is beating the sector average. Negative numbers mean it's lagging behind.
Stock vs Market (SPY)
This shows performance against the broader S&P 500 index. This is important because even if a stock beats its sector, the entire sector might be weak. You want stocks that beat both their sector AND the market.
Sector vs Market
This reveals "sector rotation" - whether money is flowing into or out of this sector. When this number is positive, the whole sector is hot and leading the market. This is powerful because strong sectors tend to lift all boats, making it easier to find winners.
3. MULTI-PERIOD PERFORMANCE ANALYSIS
The indicator calculates performance across four timeframes simultaneously:
1 Month (1M) - Recent short-term momentum
3 Months (3M) - Medium-term trend strength
6 Months (6M) - Longer-term positioning
1 Year (1Y) - Full-cycle performance view
Why multiple periods matter:
A stock might look great over 1 month but terrible over 6 months - that's a red flag. The best stocks show consistent strength across all timeframes . When you see positive RS (Relative Strength) values across all four periods, you've found a stock with sustained outperformance.
Each row in the table shows:
- Raw performance percentage for that period
- RS value (the difference compared to benchmark)
- Color coding: Green for positive, red for negative, white for neutral
4. SECTOR LEADER COMPARISON
The indicator automatically identifies and compares your stock to the sector leader - the dominant stock in that industry.
Sector leaders by industry:
Technology: Apple (AAPL)
Healthcare: UnitedHealth (UNH)
Financial: JPMorgan Chase (JPM)
Energy: ExxonMobil (XOM)
Consumer Discretionary: Amazon (AMZN)
Consumer Staples: Walmart (WMT)
And more...
Why this matters:
Comparing to the leader shows you if you're trading a champion or a follower. If your stock consistently beats the sector leader, you've found something special. If it's lagging the leader, you might want to trade the leader instead.
Optional Custom Leader:
You can override the automatic leader and compare to any stock you choose. This is useful if you want to benchmark against a specific competitor or reference stock.
NEW! INDUSTRY ANALYSIS (STOCKS ONLY)
The indicator now provides multi-level analysis by automatically detecting and comparing your stock to its specific industry , not just the broad sector.
Why Industry matters:
Technology sector (XLK) contains many different industries: Software, Semiconductors, Hardware, etc. A software stock might beat the broad tech sector but lag behind other software companies. Industry analysis provides this granular view.
Industry ETF Mapping (30+ industries):
Software/Applications: IGV (iShares Software ETF)
Semiconductors: SMH (VanEck Semiconductor ETF)
Biotech: IBB (iShares Biotechnology ETF)
Pharmaceuticals: XPH (SPDR Pharmaceuticals ETF)
Banks: KBE (SPDR S&P Bank ETF)
Regional Banks: KRE (SPDR Regional Banking ETF)
Oil & Gas Exploration: XOP (SPDR Oil & Gas Exploration ETF)
Homebuilders: XHB (SPDR Homebuilders ETF)
Retail: XRT (SPDR S&P Retail ETF)
Aerospace & Defense: ITA (iShares U.S. Aerospace & Defense ETF)
And many more...
Industry Leader Mapping:
The indicator also identifies the leader within each industry:
Software: Microsoft (MSFT)
Semiconductors: NVIDIA (NVDA)
Biotech: Amgen (AMGN)
Pharmaceuticals: Eli Lilly (LLY)
Banks: JPMorgan (JPM)
Oil Exploration: ConocoPhillips (COP)
And more...
New Table Rows for Stocks:
Industry ETF Performance - How the specific industry performed (green background)
Industry Leader Performance - How the top stock in the industry performed
vs Industry RS - Your stock's outperformance vs its industry ETF
Industry vs Sector RS - Is this industry hot or cold within its sector?
vs Industry Leader RS - Your stock's performance vs the industry's best
Why this is powerful:
A stock that beats both its sector AND its industry is showing strength at every level. This indicates true relative strength, not just riding sector-wide momentum.
Optional Custom Industry:
You can override automatic detection for both Industry ETF and Industry Leader in settings.
5. RS SCORE & GRADING SYSTEM (0-100)
The heart of the indicator is the RS Score - a weighted calculation that distills all the performance data into one clear number from 0 to 100.
How the score is calculated:
FOR STOCKS (with Industry data):
The indicator splits the weight between Sector (60%) and Industry (40%):
SECTOR RS (60% of total weight):
1 Month RS: 24% weight (40% × 0.6)
3 Month RS: 18% weight (30% × 0.6)
6 Month RS: 12% weight (20% × 0.6)
1 Year RS: 6% weight (10% × 0.6)
INDUSTRY RS (40% of total weight):
1 Month RS: 16% weight (40% × 0.4)
3 Month RS: 12% weight (30% × 0.4)
6 Month RS: 8% weight (20% × 0.4)
1 Year RS: 4% weight (10% × 0.4)
FOR OTHER ASSETS (Crypto, Forex, Commodities):
Uses full 100% weight on benchmark:
1 Month RS: 40% weight
3 Month RS: 30% weight
6 Month RS: 20% weight
1 Year RS: 10% weight
It starts at 50 (neutral) and adds or subtracts points based on your asset's relative strength in each period.
Bonus points:
+5 points if the sector is outperforming the market (sector rotation is bullish)
+5 points if the industry is outperforming its sector (hot industry) - STOCKS ONLY
+5 points if RS momentum is improving (getting stronger over time)
-5 points if RS momentum is declining (getting weaker)
The final score is capped between 0-100.
Letter Grade System:
90-100: A+ - Elite performer, crushing the sector
85-89: A - Excellent, strong outperformer
80-84: A- - Very good, above average
75-79: B+ - Good, solid performer
70-74: B - Above average, decent strength
65-69: B- - Slightly above average
60-64: C+ - Average, neutral strength
55-59: C - Below average
50-54: C- - Weak, slight underperformance
45-49: D+ - Concerning weakness
40-44: D - Poor, significant underperformance
0-39: F - Failing, avoid this stock
What scores mean for trading:
- RS Score above 70: Strong stocks worth considering for long positions
- RS Score 50-70: Average stocks, better opportunities elsewhere
- RS Score below 50: Weak stocks, avoid or consider for shorts
6. CONSISTENCY SCORE
This metric shows what percentage of time periods show positive RS .
For STOCKS (with Industry data):
Counts both Sector RS periods AND Industry RS periods (up to 8 total periods):
- If a stock beats both sector and industry in all 4 periods each: Consistency = 100% (8/8)
- If it beats in 6 out of 8 total periods: Consistency = 75%
- If it beats in 4 out of 8 total periods: Consistency = 50%
For OTHER ASSETS:
Counts benchmark periods only (4 total):
- If it beats benchmark in all 4 periods (1M, 3M, 6M, 1Y): Consistency = 100%
- If it beats in 3 out of 4 periods: Consistency = 75%
- If it beats in 2 out of 4 periods: Consistency = 50%
Why consistency matters:
A high RS Score with low consistency might indicate a recent spike that could fade. The best stocks show both high RS Score AND high consistency - they're strong now AND have been strong historically at both the sector AND industry level.
Look for stocks with:
Consistency above 75%: Very reliable strength across all levels
Consistency 50-75%: Decent but check other metrics
Consistency below 50%: Weak or erratic, proceed with caution
7. BETA CALCULATION (Volatility Measure)
Beta measures how much more volatile your stock is compared to its sector.
Beta > 1.2 : High volatility - stock moves more aggressively than sector (marked as "High")
Beta 0.8-1.2 : Normal volatility - moves roughly in line with sector
Beta < 0.8 : Low volatility - stock is more stable than sector (marked as "Low")
Formula used:
Beta = Correlation(Stock, Sector) × (Standard Deviation of Stock / Standard Deviation of Sector)
This uses a 20-period calculation for reliability.
How to use Beta:
- High Beta stocks offer bigger gains but also bigger risks - good for aggressive traders
- Low Beta stocks are more defensive - good for conservative positions
- Match Beta to your risk tolerance and strategy
8. DAYS ABOVE/BELOW SECTOR
This tracks consecutive periods (bars) where your stock outperforms or underperforms its sector.
Days Above Sector:
Counts how many bars in a row your stock has beaten the sector.
10+ days: Strong sustained strength (shown in bright green)
5-9 days: Building momentum (shown in yellow)
1-4 days: Early strength (shown in white)
0 days: Not currently outperforming
Days Below Sector:
Counts how many bars in a row your stock has lagged the sector.
10+ days: Sustained weakness (shown in bright red)
5-9 days: Losing momentum (shown in orange)
1-4 days: Minor weakness (shown in white)
0 days: Not underperforming (this is good!)
Why this matters:
Long streaks show trend persistence. A stock with 15+ days above sector is riding strong momentum. A stock with 15+ days below sector is in a sustained downtrend relative to peers.
9. PRICE VS 52-WEEK HIGH
Shows where current price sits relative to its 52-week high (or equivalent for your timeframe).
95%+ (green) : Stock is near all-time highs - strong positioning
80-94% (yellow) : Stock is in a pullback but still relatively strong
Below 80% : Stock has pulled back significantly from highs
Why this matters:
The strongest stocks stay near their highs. When you see a stock with high RS Score AND price near 52W high, you've found a stock with institutional support and strong buying pressure.
10. RELATIVE VOLUME
Compares current volume to the 20-period average volume.
1.5x+ (green) : High volume - significant interest and participation
Around 1.0x : Average volume - normal trading activity
Below 1.0x : Low volume - less interest or inactive period
Why volume matters:
High relative volume confirms price moves. When a stock makes a strong move on 2x or 3x normal volume, it's more likely to sustain. Low volume moves are often just noise.
11. AVERAGE RS STRENGTH
This calculates the average absolute value of all RS readings across the four timeframes.
It shows the magnitude of divergence from the sector, regardless of direction. A high number means the stock moves very differently from its sector (could be much stronger or much weaker). A low number means it tracks closely with the sector.
High Average RS: Stock has strong character, moves independently
Low Average RS: Stock follows sector closely, lacks individual strength
12. SECTOR ROTATION SIGNAL
This indicator automatically detects when a sector is experiencing bullish rotation - meaning money is flowing into the sector and it's outperforming the broader market.
Condition for bullish rotation:
Sector must be beating SPY (market) in both 1-month AND 3-month periods.
Why this matters:
Stocks in hot sectors tend to perform better because they have tailwinds from sector-wide buying. When sector rotation is bullish and your stock has a high RS Score, you've found an ideal setup.
The indicator adds +5 bonus points to the RS Score when sector rotation is bullish.
13. MOMENTUM DETECTION
The indicator compares 1-month RS to 3-month RS to detect if momentum is improving or declining.
RS Momentum Improving: 1M RS is better than 3M RS - stock is getting stronger (adds +5 to score)
RS Momentum Declining: 1M RS is worse than 3M RS - stock is getting weaker (subtracts -5 from score)
Why momentum matters:
You want to catch stocks as momentum is building, not after it's already peaked. Improving momentum suggests the strength is accelerating, not fading.
14. OVERALL ASSESSMENT & RECOMMENDATION
The indicator provides two quick summary rows:
Overall Rating:
Based on grade and RS Score, you get an instant quality rating:
Strong Leader (A/A+) - Top tier stock, crushing it
Above Average (A-/B+) - Solid performer, better than most
Average (B/B-) - Middle of the pack
Below Average (C/C+) - Struggling, watch carefully
Underperformer (D/F) - Weak stock, underperforming badly
Trading Signal:
Combines multiple factors to give setup quality:
STRONG BUY SETUP - RS Score 70+, Consistency 75+, AND sector rotation bullish. This is the perfect storm - strong stock, consistent strength, hot sector.
BULLISH - RS Score 60+, Consistency 50+. Good quality stock worth considering.
NEUTRAL - RS Score 50+. Okay but not exciting, better opportunities exist.
WEAK - RS Score 40-49. Below average, risky.
AVOID - RS Score below 40. Stay away, too weak.
IMPORTANT: These are educational signals only, not financial advice. Always do your own analysis and risk management.
KEY FEATURES
1. AUTOMATIC EVERYTHING
- Auto-detects asset type (stock, crypto, forex, commodity, index)
- Auto-maps stocks to correct sector ETF (11 sectors covered)
- Auto-maps stocks to correct industry ETF (30+ industries covered)
- Auto-identifies sector leader AND industry leader
- Auto-selects appropriate market benchmark
- Zero configuration required - just add to chart
2. MULTI-ASSET SUPPORT
Works on all asset classes:
US Stocks - Compares to sector ETFs (XLK, XLF, XLV, etc.)
Crypto - Compares to Total Crypto Market Cap
Forex - Compares to currency indices (DXY, EXY, etc.)
Commodities - Compares to Gold (GLD)
Indices - Compares to broader market benchmarks
3. FLEXIBLE DISPLAY
9 table positions (top/middle/bottom, left/center/right)
4 size options (tiny, small, normal, large)
Show/hide table completely
Real-time indicator toggle
4. TIMEFRAME FLEXIBILITY
Choose your analysis timeframe:
Chart Timeframe (default) - Uses whatever timeframe your chart is on
Fixed: 1 Hour, 4 Hours, Daily, Weekly - Forces calculations to specific timeframe
This means you can be on a 5-minute chart but analyze RS on Daily timeframe if you prefer.
5. RS SCORE FILTERING
Set a minimum RS Score threshold to only see strong stocks:
Set to 0 - Shows all stocks
Set to 70 - Only displays stocks with RS Score 70+ (strong stocks only)
Warning message displays if stock doesn't meet threshold
Perfect for screening - quickly scan multiple charts and the indicator only shows tables for stocks that pass your quality filter.
6. CUSTOM LEADER COMPARISON
Override automatic leader detection:
Compare to any ticker you choose
Benchmark against specific competitors
Use your own reference stocks
7. COMPREHENSIVE TOOLTIPS
Every input parameter and every table row has detailed tooltips explaining:
What the metric measures
How to interpret the values
What thresholds indicate strength/weakness
Why it matters for trading
Hover over any element to learn - it's like having a trading coach built in.
8. SMART ALERTS
Built-in alert system for key events:
Divergence Alerts:
Get notified when your stock diverges significantly from its sector.
Bullish Divergence: Stock beating sector by threshold percentage
Bearish Divergence: Stock losing to sector by threshold percentage
Set your threshold (default 5%) - this determines how big a divergence triggers the alert.
RS Score Alerts:
Get notified when RS Score crosses your threshold:
Crossed Above: RS Score went from below to above your threshold (bullish)
Crossed Below: RS Score dropped from above to below threshold (bearish)
Set your threshold (default 70) to focus on strong stocks.
Sector Rotation Alert:
Fires when sector shows bullish rotation (outperforming market).
HOW TO USE THE INDICATOR
FOR SWING TRADERS:
1. Add indicator to your watchlist stocks
2. Look for RS Score 70+ with Consistency 75%+
3. Check if sector rotation is bullish (bonus!)
4. Verify price is near 52W high (95%+)
5. Wait for entry setup on your chart
6. Use stop loss below key support
Example Setup:
Stock shows:
- RS Score: 82 (Grade: A-)
- Consistency: 100% (strong across all periods)
- Sector Rotation: Bullish
- Price vs 52W High: 96%
- Days Above Sector: 12 days
- Relative Volume: 1.8x
This is a textbook strong stock in a hot sector near highs - ideal for swing long.
FOR POSITION TRADERS:
1. Focus on 6-month and 1-year RS values
2. Look for sustained outperformance (Consistency 75%+)
3. Prefer lower Beta stocks (less volatility)
4. Check Days Above Sector for trend persistence
5. Monitor RS Score monthly, exit if drops below 60
FOR ACTIVE TRADERS:
1. Use on intraday timeframes (1H or 4H)
2. Set RS Score filter to 60+ for quick screening
3. Enable Divergence Alerts
4. Watch for momentum improving signal
5. Higher Beta stocks offer more movement
FOR SHORT SELLERS:
1. Look for RS Score below 40 (Grade: D or F)
2. Check for declining momentum
3. Verify Days Below Sector is increasing (10+)
4. Sector rotation should be bearish
5. Price should be well off 52W high
WHAT MAKES A PERFECT SETUP:
The holy grail combination:
RS Score: 75+ (A- or better)
Consistency: 80%+ (strong across time - beats sector AND industry)
Sector Rotation: Bullish (hot sector)
Industry vs Sector: Positive (hot industry within sector)
Days Above Sector: 10+ (sustained strength)
Momentum: Improving (getting stronger)
Price vs 52W High: 90%+ (near highs)
Relative Volume: 1.5x+ (volume confirmation)
When you find this combination, you've located a stock with every advantage in its favor - strong at the stock level, industry level, AND sector level. That's multi-level confirmation of relative strength.
IMPORTANT NOTES
Data Reliability:
All calculations use lookahead=off for anti-repaint protection
Historical values will never change
Real-time indicator toggle only affects the visual clock icon, not data reliability
All security requests are properly configured to prevent future data leakage
Sector Mapping Notes:
Sector detection uses TradingView's sector field
Some stocks may not have sector data - indicator will adapt
Sector ETFs used: XLK, XLF, XLV, XLE, XLY, XLP, XLI, XLB, XLRE, XLU, XLC
Major market ETFs (SPY, QQQ, DIA) are treated as market benchmarks, not stocks
Multi-Asset Notes:
Crypto compares to CRYPTOCAP:TOTAL (total crypto market cap)
Forex compares to relevant currency index based on base currency
Commodities compare to Gold (GLD) as primary commodity benchmark
Custom leaders can be set for any asset type
FREQUENTLY ASKED QUESTIONS
Q: What does RS Score of 75 actually mean?
A: It means your stock is strongly outperforming its sector across multiple timeframes. The score is weighted toward recent performance (1-month gets 40% weight), so 75 indicates sustained relative strength with emphasis on current momentum.
Q: My stock has high RS Score but is going down. Why?
A: RS Score measures relative performance (vs sector/market), not absolute price direction. A stock can fall 5% while its sector falls 10% - that's still positive relative strength. In bear markets or sector corrections, high RS stocks often fall less than peers.
Q: Should I only trade stocks with RS Score above 70?
A: For long positions, yes - focus on 70+ scores. These stocks have proven they can beat their sector. However, for pairs trading or relative value plays, you might also short stocks with scores below 40 while longing stocks above 70.
Q: What if my stock doesn't have a sector?
A: The indicator handles this gracefully. If no sector is detected, it will compare directly to the market (SPY for stocks). Some rows may show N/A, but the indicator will still provide useful market-relative data.
Q: Why does the sector sometimes show N/A?
A: This happens when: 1) Your asset has no sector classification, 2) The stock IS the sector ETF itself, 3) You're analyzing a non-stock asset (crypto, forex, commodity). The indicator adapts by focusing on market-relative metrics instead.
Q: Can I use this on cryptocurrencies?
A: Yes! The indicator automatically detects crypto and compares to the Total Crypto Market Cap (CRYPTOCAP:TOTAL). You can also set a custom leader like Bitcoin (BTCUSD) to compare against the dominant crypto.
Q: What's the difference between RS Score and Consistency?
A: RS Score is the weighted average of how much you're beating the sector (magnitude). Consistency is what percentage of time periods show outperformance (reliability). You want both high - that means strong AND consistent.
Q: Do the alerts repaint?
A: No. All alerts fire only on bar close (barstate.isconfirmed) and use properly configured data with lookahead=off. Once an alert fires, it's final and won't change.
Q: What timeframe should I use?
A: For swing trading: Daily or Weekly. For day trading: 1H or 4H. For position trading: Weekly. Use "Chart Timeframe" mode and switch your chart timeframe to change the analysis period easily.
Q: Why is Days Above Sector showing 0?
A: This means your stock is not currently outperforming its sector. If Days Below Sector is also 0, it means the RS is exactly neutral (very rare). Check the actual RS values to see current standing.
Q: Can I compare to a different market benchmark than SPY?
A: Currently the indicator uses SPY (S&P 500) as the default US stock market benchmark. For crypto it uses CRYPTOCAP:TOTAL, for forex it uses currency indices, etc. The benchmark auto-adjusts based on asset type.
Q: What's a good Beta value?
A: It depends on your strategy. Aggressive traders prefer Beta above 1.2 (more volatility = bigger moves). Conservative traders prefer Beta 0.8-1.0 (more stable). Beta is neutral - it's about matching your risk tolerance.
Q: How often does the table update?
A: With Real-time Indicator enabled: Every tick (constant updates). With it disabled: Only on bar close. Either way, the underlying data is identical and non-repainting - the toggle only affects update frequency and the clock icon display.
Q: My stock is showing "AVOID" but it's up 50% this year. Is the indicator wrong?
A: Not necessarily. The indicator measures RELATIVE performance. If your stock is up 50% but the sector is up 100%, your stock is actually underperforming by 50%. The indicator helps you identify when you should switch to stronger stocks in the same sector.
Q: What does "Strong Buy Setup" really mean?
A: It means three things aligned: 1) RS Score above 70 (strong stock), 2) Consistency above 75% (reliable strength), 3) Sector rotation is bullish (hot sector). This combination historically correlates with stocks that continue outperforming. However, this is NOT financial advice - always do your own analysis.
Q: Can I use this for options trading?
A: Yes! High RS Score stocks make good candidates for call options (bullish bets) while low RS Score stocks may work for puts (bearish bets). Higher Beta stocks will have more volatile options (higher premiums but more movement).
Q: Why is my crypto showing N/A for sector?
A: Cryptocurrencies don't have "sectors" like stocks do. Instead, the indicator compares crypto to the total crypto market cap. This is normal and expected behavior.
Q: What happens if I'm analyzing an ETF?
A: If you're analyzing a sector ETF (like XLK), it will compare to SPY (market). If you're analyzing SPY itself, some comparisons won't be available (can't compare SPY to itself). The indicator intelligently adapts to avoid circular comparisons.
Q: What if my stock doesn't have industry data?
A: Not all stocks are mapped to specific industries (only 30+ major industries are covered). If no industry is detected, the indicator will still work using only sector analysis. The RS Score calculation will use 100% sector weight instead of the 60%/40% split.
Q: Why does Industry vs Sector matter?
A: Industry vs Sector shows if your specific industry is hot or cold within its broader sector. For example, Semiconductors (SMH) might be outperforming Technology sector (XLK) even though both are up. This helps you find not just strong sectors, but the strongest industries within those sectors.
Q: Can I disable Industry analysis?
A: Yes! In the "Industry Analysis" settings group, you can toggle off "Show Industry Analysis in Table" to hide all industry rows. However, even when hidden, industry data still contributes to the RS Score calculation for stocks.
Q: Why is my Consistency Score lower for stocks than other assets?
A: For stocks with industry data, Consistency counts 8 periods (4 Sector + 4 Industry periods) instead of just 4. This means the bar is higher - your stock needs to beat both sector AND industry consistently. A stock that beats sector in all 4 periods but lags industry in 2 periods will show 75% consistency (6/8), not 100%.
BEST PRACTICES
Use as a screening tool - Set RS Score filter to 70+ and quickly scan your watchlist. Only strong stocks will show the table.
Combine with technical analysis - RS Score tells you WHAT to trade, your chart tells you WHEN to enter.
Check multiple timeframes - Switch between Daily and Weekly to see if strength holds across different time horizons.
Monitor sector rotation - When sector goes from bearish to bullish rotation, it's often a great time to enter stocks in that sector.
Watch Industry vs Sector - Stocks in hot industries within hot sectors have double tailwinds. Prioritize Industry vs Sector positive values.
Pay attention to consistency - High RS Score with low consistency might be a spike that fades. Look for 70%+ consistency across BOTH sector and industry.
Use the leader comparison - If your stock consistently beats both sector leader AND industry leader, you may have found the next champion.
Watch days above/below sector - Long streaks (15+ days) indicate strong trends. Look for these in conjunction with high RS Score.
Set alerts on key stocks - Enable RS Score alerts at 70 threshold to get notified when watchlist stocks become strong.
Consider Beta for position sizing - Size smaller positions in high Beta stocks, larger in low Beta stocks for balanced risk.
Exit when RS Score drops - If a stock's RS Score falls below 60, consider reducing or exiting - the strength may be fading.
Leverage industry-level insight - If Industry ETF is weak but stock is strong, that's standout strength. If Industry is hot but stock is lagging, consider switching to the industry leader instead.
SETTINGS EXPLAINED
Display Settings:
Show Performance Table - Master on/off switch for the table
Table Position - 9 positions available (corners, edges, center)
Table Size - 4 sizes (tiny, small, normal, large) for different screen sizes
Timeframe Settings:
Chart Timeframe (recommended) - Dynamic, uses whatever chart TF you're on
Fixed Timeframes - Locks analysis to 1H, 4H, Daily, or Weekly regardless of chart
Filtering Settings:
Minimum RS Score - Set threshold (0-100) for displaying table
Show Warning - When enabled, displays message if stock doesn't meet filter
Alert Settings:
Divergence Alerts - Enable alerts when stock diverges from sector
Threshold (%) - How big a divergence triggers alert (default 5%)
RS Score Alerts - Enable alerts when RS Score crosses threshold
Threshold - What RS Score level triggers alert (default 70)
Sector Analysis Settings:
Use Custom Sector ETF - Override automatic sector ETF detection
Sector ETF Symbol - Enter any sector ETF to compare against
Use Custom Sector Leader - Override automatic sector leader detection
Sector Leader Symbol - Enter any ticker as sector leader
Industry Analysis Settings:
Use Custom Industry ETF - Override automatic industry ETF detection
Industry ETF Symbol - Enter specific industry ETF (e.g., IGV, SMH)
Use Custom Industry Leader - Override automatic industry leader detection
Industry Leader Symbol - Enter specific industry leader
Show Industry Analysis - Toggle all industry rows on/off
Display Settings:
Show Real-time Indicator - Toggle clock icon in header (doesn't affect data)
WHAT THIS INDICATOR DOESN'T DO
To set proper expectations:
Does NOT provide entry/exit signals - this is a strength analyzer, not a trading system
Does NOT predict future price movement - shows current and historical relative strength
Does NOT guarantee profits - strong RS stocks can still decline
Does NOT replace your own analysis - use as one tool among many
Does NOT work on stocks with no sector data - will adapt but some rows show N/A
This indicator is a decision support tool . It helps you identify which stocks are showing relative strength so you can make more informed trading decisions. You still need your own entry strategy, risk management, and position sizing rules.
SUPPORT & CONTACT
Questions or feedback? Use the comments section below or send me a message.
If you find this indicator useful, please give it a boost and share with other traders who might benefit from relative strength analysis.
FINAL REMINDER
This indicator is a tool for analyzing relative strength - it shows you which stocks are outperforming their sector and market. It does NOT provide financial advice or trade signals. Always conduct your own research, manage your risk appropriately, and consult with a financial advisor before making investment decisions.
Past performance of relative strength does not guarantee future results. Strong stocks can become weak, and sectors rotate in and out of favor. Use this indicator as part of a comprehensive trading strategy, not as a standalone decision-making system.
Trade smart, manage risk, and may your RS Scores stay high!
If you got till here and you like my work a BOOST and a COMMENT would make me happy

Trend-S&R-WiP11-15-2025: This new indicator is my 5/15-Min-ORB-Trend-Finder-WiP indicator simplified to only have:
> Market Open
> 5-Min & 15-Min High/Low
> Support/Resistance lines
> Fair Value Gaps (FVGs)
> a Trend Line
> a Trend table
Recommended to be used with my other indicator: Buy-or-Sell-WiP
Strategy:
> I only trade one ticker, SPX, with ODTE CALL/PUT Credit Spreads
> use Break & Retest with 5-Min High/Low or 15-Min High/Low or FVGs
> 📈 Bullish Trend
Trade: PUT Credit Spread
Trend Confirmations:
Trend Line is green
MACD Histogram is green
Price Condition: Nearest resistance 8-10 points above market price
> 📉 Bearish Trend
Trade: CALL Credit Spread
Trend Confirmations:
Trend Line is purple
MACD Histogram is red
Price Condition: Nearest support 8-10 points below market price
> Fair Value Gaps (FVGs)
- Trade anytime during the day using Break & Retest and all indicator confirmations shown above

Ram Trend Scoring (Current TF Enhanced)Overview
The Ram Trend Scoring indicator is a trend & momentum scoring tool for Forex and other instruments. It evaluates multiple technical factors on the current timeframe to classify pairs as:
8 EMA Momentum Pair – strong trending momentum
20 EMA Pullback Pair – weaker trend, possible pullback setups
It uses a points-based system, where points are added for positive factors or subtracted for failed EMA conditions.
Scoring Components
Trend Structure – price relative to EMA20
ADX Strength – trend strength (>25 strong, >20 moderate)
Distance from EMA8 – price proximity to short-term EMA
Candle Body Strength – larger bodies indicate stronger momentum
Pullback Depth – evaluates how deep the retracement is
EMA8 Wick Rejection – bullish/bearish rejection near EMA8
EMA Separation – priority #1; ≥20 pips difference required, penalty -2 if not
EMA Angle – priority #2; slope ≥30° required, penalty -2 if not
EMA Order – priority #3; correct EMA8/EMA20 alignment, penalty -2 if not
Total Score = Sum of all factor scores.
Classification Threshold: default 12
Total ≥ threshold → “8 EMA Momentum Pair”
Total < threshold → “20 EMA Pullback Pair”
Table Display
2 columns × 11 rows:
Left column = factor name
Right column = score or value
Shows total score, individual scores, and classification
Usage / How to Trade
Trend Identification
Use the indicator to quickly see momentum strength
Check EMA plots and table scores for alignment
Priority Factors
First check EMA Separation (≥20 pips)
Then EMA Angle (≥30° slope)
Then EMA Order
Only if all conditions are met, consider the setup strong
Trade Planning
8 EMA Momentum Pair → Trend continuation setups
20 EMA Pullback Pair → Wait for retracement or reversal signals
Confirmation
Combine with your usual support/resistance, FVG, or price action for entry
Higher total scores → higher probability setups
Alerts
Use the built-in alerts for “8 EMA Momentum Pair” and “20 EMA Pullback Pair”
Key Advantages
Works entirely on current timeframe → no HTF errors
Easy visual scoring table
Adjustable parameters: EMAs, ADX, ATR, angle, separation
Helps identify high-probability trend continuation or pullback trades

Volatility-Targeted Momentum Portfolio [BackQuant]Volatility-Targeted Momentum Portfolio
A complete momentum portfolio engine that ranks assets, targets a user-defined volatility, builds long, short, or delta-neutral books, and reports performance with metrics, attribution, Monte Carlo scenarios, allocation pie, and efficiency scatter plots. This description explains the theory and the mechanics so you can configure, validate, and deploy it with intent.
Table of contents
What the script does at a glance
Momentum, what it is, how to know if it is present
Volatility targeting, why and how it is done here
Portfolio construction modes: Long Only, Short Only, Delta Neutral
Regime filter and when the strategy goes to cash
Transaction cost modelling in this script
Backtest metrics and definitions
Performance attribution chart
Monte Carlo simulation
Scatter plot analysis modes
Asset allocation pie chart
Inputs, presets, and deployment checklist
Suggested workflow
1) What the script does at a glance
Pulls a list of up to 15 tickers, computes a simple momentum score on each over a configurable lookback, then volatility-scales their bar-to-bar return stream to a target annualized volatility.
Ranks assets by raw momentum, selects the top 3 and bottom 3, builds positions according to the chosen mode, and gates exposure with a fast regime filter.
Accumulates a portfolio equity curve with risk and performance metrics, optional benchmark buy-and-hold for comparison, and a full alert suite.
Adds visual diagnostics: performance attribution bars, Monte Carlo forward paths, an allocation pie, and scatter plots for risk-return and factor views.
2) Momentum: definition, detection, and validation
Momentum is the tendency of assets that have performed well to continue to perform well, and of underperformers to continue underperforming, over a specific horizon. You operationalize it by selecting a horizon, defining a signal, ranking assets, and trading the leaders versus laggards subject to risk constraints.
Signal choices . Common signals include cumulative return over a lookback window, regression slope on log-price, or normalized rate-of-change. This script uses cumulative return over lookback bars for ranking (variable cr = price/price - 1). It keeps the ranking simple and lets volatility targeting handle risk normalization.
How to know momentum is present .
Leaders and laggards persist across adjacent windows rather than flipping every bar.
Spread between average momentum of leaders and laggards is materially positive in sample.
Cross-sectional dispersion is non-trivial. If everything is flat or highly correlated with no separation, momentum selection will be weak.
Your validation should include a diagnostic that measures whether returns are explained by a momentum regression on the timeseries.
Recommended diagnostic tool . Before running any momentum portfolio, verify that a timeseries exhibits stable directional drift. Use this indicator as a pre-check: It fits a regression to price, exposes slope and goodness-of-fit style context, and helps confirm if there is usable momentum before you force a ranking into a flat regime.
3) Volatility targeting: purpose and implementation here
Purpose . Volatility targeting seeks a more stable risk footprint. High-vol assets get sized down, low-vol assets get sized up, so each contributes more evenly to total risk.
Computation in this script (per asset, rolling):
Return series ret = log(price/price ).
Annualized volatility estimate vol = stdev(ret, lookback) * sqrt(tradingdays).
Leverage multiplier volMult = clamp(targetVol / vol, 0.1, 5.0).
This caps sizing so extremely low-vol assets don’t explode weight and extremely high-vol assets don’t go to zero.
Scaled return stream sr = ret * volMult. This is the per-bar, risk-adjusted building block used in the portfolio combinations.
Interpretation . You are not levering your account on the exchange, you are rescaling the contribution each asset’s daily move has on the modeled equity. In live trading you would reflect this with position sizing or notional exposure.
4) Portfolio construction modes
Cross-sectional ranking . Assets are sorted by cr over the chosen lookback. Top and bottom indices are extracted without ties.
Long Only . Averages the volatility-scaled returns of the top 3 assets: avgRet = mean(sr_top1, sr_top2, sr_top3). Position table shows per-asset leverages and weights proportional to their current volMult.
Short Only . Averages the negative of the volatility-scaled returns of the bottom 3: avgRet = mean(-sr_bot1, -sr_bot2, -sr_bot3). Position table shows short legs.
Delta Neutral . Long the top 3 and short the bottom 3 in equal book sizes. Each side is sized to 50 percent notional internally, with weights within each side proportional to volMult. The return stream mixes the two sides: avgRet = mean(sr_top1,sr_top2,sr_top3, -sr_bot1,-sr_bot2,-sr_bot3).
Notes .
The selection metric is raw momentum, the execution stream is volatility-scaled returns. This separation is deliberate. It avoids letting volatility dominate ranking while still enforcing risk parity at the return contribution stage.
If everything rallies together and dispersion collapses, Long Only may behave like a single beta. Delta Neutral is designed to extract cross-sectional momentum with low net beta.
5) Regime filter
A fast EMA(12) vs EMA(21) filter gates exposure.
Long Only active when EMA12 > EMA21. Otherwise the book is set to cash.
Short Only active when EMA12 < EMA21. Otherwise cash.
Delta Neutral is always active.
This prevents taking long momentum entries during obvious local downtrends and vice versa for shorts. When the filter is false, equity is held flat for that bar.
6) Transaction cost modelling
There are two cost touchpoints in the script.
Per-bar drag . When the regime filter is active, the per-bar return is reduced by fee_rate * avgRet inside netRet = avgRet - (fee_rate * avgRet). This models proportional friction relative to traded impact on that bar.
Turnover-linked fee . The script tracks changes in membership of the top and bottom baskets (top1..top3, bot1..bot3). The intent is to charge fees when composition changes. The template counts changes and scales a fee by change count divided by 6 for the six slots.
Use case: increase fee_rate to reflect taker fees and slippage if you rebalance every bar or trade illiquid assets. Reduce it if you rebalance less often or use maker orders.
Practical advice .
If you rebalance daily, start with 5–20 bps round-trip per switch on liquid futures and adjust per venue.
For crypto perp microcaps, stress higher cost assumptions and add slippage buffers.
If you only rotate on lookback boundaries or at signals, use alert-driven rebalances and lower per-bar drag.
7) Backtest metrics and definitions
The script computes a standard set of portfolio statistics once the start date is reached.
Net Profit percent over the full test.
Max Drawdown percent, tracked from running peaks.
Annualized Mean and Stdev using the chosen trading day count.
Variance is the square of annualized stdev.
Sharpe uses daily mean adjusted by risk-free rate and annualized.
Sortino uses downside stdev only.
Omega ratio of sum of gains to sum of losses.
Gain-to-Pain total gains divided by total losses absolute.
CAGR compounded annual growth from start date to now.
Alpha, Beta versus a user-selected benchmark. Beta from covariance of daily returns, Alpha from CAPM.
Skewness of daily returns.
VaR 95 linear-interpolated 5th percentile of daily returns.
CVaR average of the worst 5 percent of daily returns.
Benchmark Buy-and-Hold equity path for comparison.
8) Performance attribution
Cumulative contribution per asset, adjusted for whether it was held long or short and for its volatility multiplier, aggregated across the backtest. You can filter to winners only or show both sides. The panel is sorted by contribution and includes percent labels.
9) Monte Carlo simulation
The panel draws forward equity paths from either a Normal model parameterized by recent mean and stdev, or non-parametric bootstrap of recent daily returns. You control the sample length, number of simulations, forecast horizon, visibility of individual paths, confidence bands, and a reproducible seed.
Normal uses Box-Muller with your seed. Good for quick, smooth envelopes.
Bootstrap resamples realized returns, preserving fat tails and volatility clustering better than a Gaussian assumption.
Bands show 10th, 25th, 75th, 90th percentiles and the path mean.
10) Scatter plot analysis
Four point-cloud modes, each plotting all assets and a star for the current portfolio position, with quadrant guides and labels.
Risk-Return Efficiency . X is risk proxy from leverage, Y is expected return from annualized momentum. The star shows the current book’s composite.
Momentum vs Volatility . Visualizes whether leaders are also high vol, a cue for turnover and cost expectations.
Beta vs Alpha . X is a beta proxy, Y is risk-adjusted excess return proxy. Useful to see if leaders are just beta.
Leverage vs Momentum . X is volMult, Y is momentum. Shows how volatility targeting is redistributing risk.
11) Asset allocation pie chart
Builds a wheel of current allocations.
Long Only, weights are proportional to each long asset’s current volMult and sum to 100 percent.
Short Only, weights show the short book as positive slices that sum to 100 percent.
Delta Neutral, 50 percent long and 50 percent short books, each side leverage-proportional.
Labels can show asset, percent, and current leverage.
12) Inputs and quick presets
Core
Portfolio Strategy . Long Only, Short Only, Delta Neutral.
Initial Capital . For equity scaling in the panel.
Trading Days/Year . 252 for stocks, 365 for crypto.
Target Volatility . Annualized, drives volMult.
Transaction Fees . Per-bar drag and composition change penalty, see the modelling notes above.
Momentum Lookback . Ranking horizon. Shorter is more reactive, longer is steadier.
Start Date . Ensure every symbol has data back to this date to avoid bias.
Benchmark . Used for alpha, beta, and B&H line.
Diagnostics
Metrics, Equity, B&H, Curve labels, Daily return line, Rolling drawdown fill.
Attribution panel. Toggle winners only to focus on what matters.
Monte Carlo mode with Normal or Bootstrap and confidence bands.
Scatter plot type and styling, labels, and portfolio star.
Pie chart and labels for current allocation.
Presets
Crypto Daily, Long Only . Lookback 25, Target Vol 50 percent, Fees 10 bps, Regime filter on, Metrics and Drawdown on. Monte Carlo Bootstrap with Recent 200 bars for bands.
Crypto Daily, Delta Neutral . Lookback 25, Target Vol 50 percent, Fees 15–25 bps, Regime filter always active for this mode. Use Scatter Risk-Return to monitor efficiency and keep the star near upper left quadrants without drifting rightward.
Equities Daily, Long Only . Lookback 60–120, Target Vol 15–20 percent, Fees 5–10 bps, Regime filter on. Use Benchmark SPX and watch Alpha and Beta to keep the book from becoming index beta.
13) Suggested workflow
Universe sanity check . Pick liquid tickers with stable data. Thin assets distort vol estimates and fees.
Check momentum existence . Run on your timeframe. If slope and fit are weak, widen lookback or avoid that asset or timeframe.
Set risk budget . Choose a target volatility that matches your drawdown tolerance. Higher target increases turnover and cost sensitivity.
Pick mode . Long Only for bull regimes, Short Only for sustained downtrends, Delta Neutral for cross-sectional harvesting when index direction is unclear.
Tune lookback . If leaders rotate too often, lengthen it. If entries lag, shorten it.
Validate cost assumptions . Increase fee_rate and stress Monte Carlo. If the edge vanishes with modest friction, refine selection or lengthen rebalance cadence.
Run attribution . Confirm the strategy’s winners align with intuition and not one unstable outlier.
Use alerts . Enable position change, drawdown, volatility breach, regime, momentum shift, and crash alerts to supervise live runs.
Important implementation details mapped to code
Momentum measure . cr = price / price - 1 per symbol for ranking. Simplicity helps avoid overfitting.
Volatility targeting . vol = stdev(log returns, lookback) * sqrt(tradingdays), volMult = clamp(targetVol / vol, 0.1, 5), sr = ret * volMult.
Selection . Extract indices for top1..top3 and bot1..bot3. The arrays rets, scRets, lev_vals, and ticks_arr track momentum, scaled returns, leverage multipliers, and display tickers respectively.
Regime filter . EMA12 vs EMA21 switch determines if the strategy takes risk for Long or Short modes. Delta Neutral ignores the gate.
Equity update . Equity multiplies by 1 + netRet only when the regime was active in the prior bar. Buy-and-hold benchmark is computed separately for comparison.
Tables . Position tables show current top or bottom assets with leverage and weights. Metric table prints all risk and performance figures.
Visualization panels . Attribution, Monte Carlo, scatter, and pie use the last bars to draw overlays that update as the backtest proceeds.
Final notes
Momentum is a portfolio effect. The edge comes from cross-sectional dispersion, adequate risk normalization, and disciplined turnover control, not from a single best asset call.
Volatility targeting stabilizes path but does not fix selection. Use the momentum regression link above to confirm structure exists before you size into it.
Always test higher lag costs and slippage, then recheck metrics, attribution, and Monte Carlo envelopes. If the edge persists under stress, you have something robust.

Aquantprice: Institutional Structure MatrixSETUP GUIDE
Open TradingView
Go to Indicators
Search: Aquantprice: Institutional Structure Matrix
Click Add to Chart
Customize:
Min Buy = 10, Min Sell = 7
Show only PP, R1, S1, TC, BC
Set Decimals = 5 (Forex) or 8 (Crypto)
USE CASES & TRADING STRATEGIES
1. CPR Confluence Trading (Most Popular)
Rule: Enter when ≥3 timeframes show Buy ≥10/15 or Sell ≥7/13
text Example:
Daily: 12/15 Buy
Weekly: 11/15 Buy
Monthly: 10/15 Buy
→ **STRONG LONG BIAS**
Enter on pullback to nearest **S1 or L3**
2. Hot Zone Scalping (Forex & Indices)
Rule: Trade only when price is in Hot Zone (closest 2 levels)
text Hot: S1-PP → Expect bounce or breakout
Action:
- Buy at S1 if Buy Count ↑
- Sell at PP if Sell Count ↑
3. Institutional Reversal Setup
Rule: Price at H3/L3 + Reversal Condition
text Scenario:
Price touches **Monthly L3**
L3 in **Hot Zone**
Buy Count = 13/15
→ **High-Probability Reversal Long**
4. CPR Width Filter (Avoid Choppy Markets)
Rule: Trade only if CPR Label = "Strong Trend"
text CPR Size < 0.25 → Trending
CPR Size > 0.75 → Sideways (Avoid)
5. Multi-Timeframe Bias Dashboard
Use "Buy" and "Sell" columns as a sentiment meter
TimeframeBuySellBiasDaily123BullishWeekly89BearishMonthly112Bullish
→ Wait for alignment before entering
HOW TO READ THE TABLE
Column Meaning Time frame D, W, M, 3M, 6M, 12MOpen Price Current session open PP, TC, BC, etc. Pivot levels (color-coded if in Hot Zone) Buy X/15 conditions met (≥10 = Strong Buy)Sell X/13 conditions met (≥7 = Strong Sell)CPR Size Histogram + Label (Trend vs Range)Zone Hot: PP-S1, Med: S2-L3, etc. + PP Distance
PRO TIPS
Best on 5M–1H charts for entries
Use with volume or order flow for confirmation
Set alerts on Buy ≥12/15 or Sell ≥10/13
Hide unused levels to reduce clutter
Combine with AQuantPrice Dashboard (Small TF) for full system
IDEAL MARKETS
Forex (EURUSD, GBPUSD, USDJPY)
Indices (NAS100, SPX500, DAX)
Crypto (BTC, ETH – use 6–8 decimals)
Commodities (Gold, Oil)
🚀 **NEW INDICATOR ALERT**
**Aquantprice: Institutional Structure Matrix**
The **ALL-IN-ONE CPR Dashboard** used by smart money traders.
✅ **6 Timeframes in 1 Table** (Daily → Yearly)
✅ **15 Buy + 13 Sell Conditions** (Institutional Logic)
✅ **Hot Zones, CPR Width, PP Distance**
✅ **Fully Customizable – Show/Hide Any Level**
✅ **Real-Time Zone Detection** (Hot, Med, Low)
✅ **Precision up to 8 Decimals**
**No more switching charts. No more confusion.**
See **where institutions are positioned** — instantly.
👉 **Add to Chart Now**: Search **"Aquantprice: Institutional Structure Matrix"**
🔥 **Free Access | Pro-Level Insights**
*By AQuant – Trusted by 10,000+ Traders*
#CPR #PivotTrading #SmartMoney #TradingView
FINAL TAGLINE
"See What Institutions See — Before They Move."
Aquantprice: Institutional Structure Matrix
Your Edge. One Dashboard.

Trendline Detector - 3 TimeframesThis advanced Pine Script indicator automatically identifies and draws diagonal support and resistance trendlines across three customizable timeframes simultaneously.
Key Features:
Multi-Timeframe Analysis: Configure three independent sets (A, B, C) to analyze different timeframes on a single chart
Smart Pivot Detection: Identifies local minimums and maximums based on open/close prices rather than wicks, reducing false signals from volatile candle shadows
Automatic Trendline Drawing: Calculates ascending support lines from pivot lows and descending resistance lines from pivot highs
Touch Validation: Only displays trendlines that meet your minimum touch requirements, ensuring statistical significance
Customizable Parameters: Full control over lookback period, pivot window size, deviation tolerance, and minimum touches for each timeframe
Visual Pivot Markers: Optional display of all detected pivot points with color-coded arrows (green for lows, red for highs)
Extended Lines: All valid trendlines extend to the right for forward projection
How It Works:
The indicator scans historical bars within your specified lookback period to identify pivot points. It then evaluates all possible trendline combinations, counting how many price points touch each potential line within your deviation tolerance. The trendline with the most touches (meeting your minimum requirement) is displayed.
Parameter Breakdown:
Each set (A, B, C) includes five critical parameters:
Timeframe: The chart timeframe for analysis (e.g., "1" for 1-minute, "15" for 15-minute, "1D" for daily)
Lookback Bars: How many historical bars to scan for pivot points (default: 250). Higher values capture longer-term trends but may increase computation time.
Min Touches: Minimum number of price touches required for a trendline to be considered valid (default: 3). Higher values ensure stronger, more reliable trendlines but may filter out emerging trends.
Deviation %: Percentage tolerance for what constitutes a "touch" (default: 0.1-1.0%). A 0.5% deviation means prices within 0.5% of the theoretical trendline are counted as touches. Lower values create stricter trendlines; higher values are more forgiving.
Pivot Window: Number of bars on each side used to identify local highs/lows (default: 5). A pivot window of 5 means the center bar must be the highest/lowest among 11 bars total (5 left + center + 5 right). Larger values identify more significant pivots but may miss shorter-term turning points.
Display Options:
Show Min/Max Points: Toggle visibility of pivot point markers to see exactly which price levels the algorithm identified as potential trendline anchors.
Perfect For:
Swing traders looking for multi-timeframe confluence zones
Technical analysts who rely on diagonal support/resistance levels
Traders who want automated trendline detection without manual drawing
Anyone seeking to identify trend channels and breakout opportunities
Color Coding:
Support lines are displayed in green with varying transparency, while resistance lines appear in red. Each timeframe set can be independently enabled/disabled based on which chart timeframe you're currently viewing, preventing clutter and maintaining clarity.
Technical Notes:
The indicator uses efficient algorithms to process large datasets while maintaining accuracy. It avoids repainting by only considering confirmed pivot points. The algorithm prioritizes trendlines with more touches and, in case of ties, favors more recent formations with steeper angles for maximum relevance.

📋 Trading Checklist – Precision Entry SystemTake your trading discipline to the next level with this Precision Trading Checklist for TradingView. Designed for intraday traders following liquidity, structure, and Smart Money Concepts (SMC) AKA ICT Concepts, this overlay ensures you never miss a key confirmation before entering a trade.
Features:
✅ Pre-Market Preparation: Track previous session highs/lows, AM/PM sessions, and key liquidity zones.
✅ Bias & Narrative Check: Quickly confirm daily trend, price position relative to daily open, and higher timeframe confluence.
✅ Session-Specific Rules: Focused sessions like Silver Bullet (10:00–11:30), Afternoon (13:30–15:00), and Final Hour (15:00–16:00).
✅ Structure & Setup Validation: Confirm liquidity sweeps, market structure shifts, expansion candles, fair value gaps, and order blocks.
✅ Risk Management Reminders: Stop-loss, target points, risk percentage, breakeven management, and pyramiding rules.
✅ Post-Trade Journaling: Document entries, session, setup type, trade outcome, and grading for continuous improvement.
✅ Golden Rules: Visual reminders to enforce discipline, avoid emotional trades, and respect session limits.
Why Use It:
This checklist is perfect for traders who want to stay consistent, minimise mistakes, and follow a disciplined routine. Displayed as an overlay on your chart, it provides all essential checks in one glance, keeping you focused on the setup rather than scrolling through notes or separate trackers.
How to use:
Add the indicator to your chart
Click the settings/gear icon
Check off items as you complete them
The checklist on your chart updates in real-time with green checkmarks!
The checkboxes will persist as long as the indicator is on your chart,
making it perfect for tracking your pre-trade and post-trade routines!
Follow the checklist items step by step before entering trades.
Use the session-specific guidelines to filter setups.
Journal your trades post-execution for growth and analysis.

Session ParmezanForex Session Range Boxes (Asia, Europe, US) — visual intraday session tracker for Forex and metals.
This indicator automatically marks the three major Forex trading sessions — Asian (Tokyo), European (London), and American (New York) — directly on your chart using dynamic colored boxes.
Each box represents the full price range (High–Low) formed during that session, helping traders visualize how volatility and liquidity evolve across the global trading day.
The script is built for intraday traders and session-based strategies, especially those who monitor breakouts from the Asian range or reactions during London–New York overlaps.
⚙️ Features
• Accurate session timing (UTC+3 / Moscow Time) — Asia: 03:00–12:00, Europe: 11:00–20:00, US: 16:00–01:00.
• Dynamic range boxes: each box expands in real time as new highs and lows are set during the session.
• Clear visual separation: each session is shown in its own color (blue for Asia, orange for Europe, green for US).
• Automatic daily reset — new boxes start every new session.
• Intraday focus only — visible up to the 1-hour timeframe (M1–H1) for clarity.
• Transparent design — semi-transparent fills keep candles readable even when sessions overlap.
• Lightweight performance — optimized use of box.new() and var variables avoids lag on lower timeframes.
🧭 Typical Use-Cases
• Identify Asian session ranges and watch for London breakouts or New York reversals.
• Visually align your intraday strategy with session volatility cycles.
• Combine with VWAP, liquidity zones, or market profile indicators for deeper confluence.
• Spot overlapping sessions — often the most active periods of the day.
