Volume RatioDefinition:
Volume ratio can be obtained in a similar way to RSI.
Volume Ratio (%) = 100 - 100/(1+vr)
The parameter "vr" is defined as
vr=(A+U/2)/(D+U/2)
A=Total volume of the periods when the price advanced
D=Total volume of the periods when the price declined
U=Total volume of the periods when the price unchanged
After substitution, following expression can be derived and the denominator represents total volume of all periods.
Volume Ratio (%) = 100 x (A+U/2)/(A+D+U)
Notes:
A similar method to interpret RSI can be employed.
1) Overbought level over 70% and oversold level under 30%. These levels need to be adjusted according to the periods, time frames and issues.
2) Bullish picture over 50% line and bearish picture under 50% line.
3) Crossing oversold level to the upside can be taken as a confirmation of bullish reversal. - and vice versa for a bearish reversal.
4) After a long-term bearish market, the increase of volume can happen in the early stage of a bullish market.
5) Buying opportunity can be suggested when the volume ratio is declining and the price is either advancing or leveling off.
在脚本中搜索"美元指数跌破100大关"

CCI with Volume Weighted EMA Here is an attempt to improve on the CCI using a volume weighted ema which is then plugged into the CCI formula.
Use:
The CCI with VW EMA is an oscillator that gives readings between -100 and +100. The usual use is to 'go long' with values over +100 and short on values less than -100.
Another use of this oscillator is a countertrend indicator where one sells at crosses under +100 and buys on crosses over -100.

Multi-Functional Fisher Transform MTF with MACDL TRIGGERWhat this indicator gives you is a true signal when price is exhausted and ready for a fast turnaround. Fisher Transform is set for multi-time frame and also allows the user to change the length. This way a user can compare two or more time spans and lengths to look for these MACDL divergent triggers after a Fisher exhaustion. With so many indicators, it's probably best to merge these indicators and change the Fisher and Trigger colors so you can still have a look at price action (remember to scale right after merger). I've noticed from time to time when you have Fisher 34 100 and 300 up and running on two different time frames such as 5 and 15 min charts, with MACDL triggers on the 100/300 or 34/100 you get a high probability trade trigger. However, there are rare exceptions such as when price moves in a parabolic state up or down for a long period where this indication does not work. Ideally this indicator works best in a sideways market or slow rising/descending moving market.
This indicator was worked on by Glaz, nmike and myself
LazyBear also introduced the MACDL indicator

CCI Crossover AlertThis very simple indicator will give you a blue background where the CCI crossed from below -100 to above -100, and a red background where it crossed from above 100 to below 100.

Ripster: DTR/ATR + SMA Div + RVOL🧭 Overview
The indicator combines three major analytical tools into one TradingView Pine v6 script — designed for clean, at-a-glance insight into range, divergence, and volume activity.
It shows:
DTR vs ATR Table – current Daily True Range compared to Average True Range.
SMA Price Divergence + EMA Signal – a histogram with color-coded momentum bands.
RVOL Table + Candle Coloring + Change Labels – relative-volume analysis with visual cues on the chart.
Short title: ripcombo
Runs on chart overlay (no separate pane).
📊 1. DTR vs ATR Table
Compares today’s price range (High-Low) to the average true range over a selectable length.
Supports multiple smoothing methods: EMA, RMA, SMA, WMA.
Table position and text size are configurable.
Color logic:
🟢 ≤ 70 % of ATR → low volatility
🟡 70–90 % → average
🔴 ≥ 90 % → expanded range
📈 2. SMA Divergence + EMA Signal
Computes fast (14 SMA) and slow (30 SMA) divergences of price.
Plots two histograms plus an EMA signal line of the slow divergence.
Visuals:
Columns shaded by transparency for clarity.
Rising EMA → lime line (up momentum).
Falling EMA → red line (down momentum).
Optional upper/lower bands and zero line provide quick overbought/oversold zones.
🔥 3. RVOL (Relative Volume)
Adds powerful volume-based context:
a. Table Display
Shows:
Candle Volume
RVOL (Now)
RVOL (Prev)
Δ RVOL (change Now − Prev)
Colors:
🔴 > 200 % (very high volume)
🟠 100–200 % (high volume)
🟡 < 100 % (normal/low volume)
Δ column is green ▲ for increase, red ▼ for decrease.
b. Candle Coloring (optional)
Colors price candles themselves by current RVOL threshold so high-volume candles visually stand out.
c. Last-Bar Label (optional)
Prints a compact label on the latest candle showing:
RVOL: ### % Δ: ▲/▼## %
so you can instantly see the current volume strength and how it changed from the previous bar.
⚙️ User Settings
All major elements are toggle-controlled:
Enable/disable ATR, Divergence, or RVOL sections.
Choose table positions (top/middle/bottom × left/center/right).
Select text sizes, smoothing types, color modes, and visual transparency.
Candle coloring + label visibility are optional.
🧠 At a Glance
Component Purpose Key Visuals
DTR vs ATR Measures volatility expansion One-cell colored table
SMA Divergence Detects price momentum shifts Columns + EMA line + bands
RVOL Analysis Highlights unusual trading volume Colored table + Δ column + candle colors + label
✅ Result
You get a single on-chart tool that:
Quantifies volatility, momentum, and volume context together.
Highlights strong activity days (ATR & RVOL) in color.
Shows whether current candle’s volume is rising or falling vs the previous.
Perfect for spotting breakouts, reversals, or exhaustion moves without switching indicators.

Ripster Labels + Air Gaps (v6)What it shows (on one chart)
EMA Clouds (current timeframe)
Plots EMA 8/12/21/34/50/200 with three cloud fills:
12–21 = “fast” cloud
34–50 = “mid” cloud
50–200 = “base” cloud
Cloud color: green when the faster EMA is above the slower (bullish), red/maroon/orange when below (bearish).
Toggle lines vs. clouds via A) EMA Clouds settings.
MTF Rails (higher-TF EMAs)
For three higher timeframes (defaults 30m / 60m / 240m), draws two EMAs each (defaults 34 & 50).
These are stepline-like rails you can visually use as higher-TF supports/resistances.
Configure in B) MTF Rails (turn on/off, change TFs/lengths/colors).
Relative Volume Box (RVol)
Small table (top-center) showing:
Candle Vol (formatted K/M/B if enabled)
RVol = current bar volume / SMA 20 of volume (as a %)
Color scale: blue (<100%), yellow (100–150%), red (>150%).
Settings in C) RVol Box.
DTR vs ATR Box
Daily True Range (DTR = day high − day low) vs ATR(14) on the daily timeframe, with DTR as % of ATR.
Placed at top-right; toggle in D) DTR/ATR Box.
Ripster Trend Label (10m 12/50)
Looks at a separate timeframe (default 10m): EMA 12 vs EMA 50.
Bottom-right table cell shows “10m Trend ↑/↓/Sideways” (green/red/gray).
Configure in E) Ripster Trend Labels (TF and lengths).
Air Gaps (single EMA per TF)
Three horizontal, auto-extending lines showing an EMA from 30m / 60m / 240m (default length 12).
“Air gaps” are the price spaces between these lines—often lighter-resistance zones for price.
Start point logic:
All Bars = draw from the chart’s left
Start of Day = draw from today’s first bar
Bars Offset = draw from N bars back (default 100)
Settings in F) Air Gaps (TFs, length, draw-from, bars-back).
Inputs & where to tweak
A) EMA Clouds
Show EMA Clouds: master toggle
Source: close (default)
Lengths: 8/12/21/34/50/200
Show EMA lines: toggle plotted lines (clouds remain)
B) MTF Rails
Show MTF Rails
TF1/TF2/TF3 (defaults 30/60/240)
EMA A/B (defaults 34/50)
C) RVol Box
Show box
Format as K/M/B: K=1e3, M=1e6, B=1e9
D) DTR/ATR Box
Show DTR/ATR
ATR len: default 14 (daily)
E) Ripster Trend Labels
Show labels
Trend TF: default 10 (10-minute)
Trend EMA Fast/Slow: default 12/50
F) Air Gaps
Show Air Gap lines
TF1/TF2/TF3 (30/60/240)
EMA length: default 12
Draw from: All Bars | Start of Day | Bars Offset
Bars back: used if Draw from = Bars Offset
How it makes decisions
Cloud bias = sign of (faster EMA − slower EMA) for each cloud pair.
Example: 12>21 → fast cloud is bullish (green); 34>50 → mid cloud bullish (teal).
10m trend label = sign of (EMA12−EMA50) on the Trend TF (default 10m).
RVol = volume / sma(volume, 20); formatted as a percent and color-coded.
Practical read of the screen
Fast cloud flips (12/21) often mark short-term momentum changes; mid cloud flips (34/50) reflect swing bias.
Air Gap lines from higher TFs frequently act as support/resistance. Larger spaces between lines = “air gaps” where price can move with less friction.
RVol color tells you how “real” a move is: red/yellow often confirms momentum; blue warns of thin/liquidy bars.
DTR vs ATR shows if today’s range is stretched vs recent norm.
Design choices (why your prior errors are gone)
Removed multiline ?: chains → replaced by if/else (Pine v6 is picky about line continuations).
Moved fill() calls outside of local if blocks (Pine limitation).
ta.change(time("D")) != 0 makes the if condition boolean.
Declared G_drawFrom / G_barsBack before startX() so identifiers exist.

RSI// This source code is subject to the terms of the Mozilla Public License 2.0 at mozilla.org
// © xdecow
//@version=5
indicator("RSI", overlay=true)
g_panel = 'Panel Options'
i_orientation = input.string('Vertical', 'Orientation', options = , group = g_panel)
i_position = input.string('Bottom Right', 'Position', options = , group = g_panel)
i_border_width = input.int(1, 'Border Width', minval = 0, maxval = 10, group = g_panel, inline = 'border')
i_color_border = input.color(#000000, '', group = g_panel, inline = 'border')
i_showHeaders = input.bool(true, 'Show Headers', group = g_panel)
i_color_header_bg = input.color(#5d606b, 'Headers Background', group = g_panel, inline = 'header')
i_color_header_text = input.color(color.white, 'Text', group = g_panel, inline = 'header')
i_color_tf_bg = input.color(#2a2e39, 'Timeframe Background', group = g_panel, inline = 'tf')
i_color_tf_text = input.color(color.white, 'Text', group = g_panel, inline = 'tf')
i_debug = input.bool(false, 'Display colors palette (debug)', group = g_panel)
// rsi bg colors
g_rsi = 'RSI Colors'
i_threshold_ob = input.int(70, 'Overbought Threshold', minval=51, maxval=100, group = g_rsi)
i_color_ob = input.color(#128416, 'Overbought Background', inline = 'ob', group = g_rsi)
i_tcolor_ob = input.color(color.white, 'Text', inline = 'ob', group = g_rsi)
i_threshold_uptrend = input.int(60, 'Uptrend Threshold', minval=51, maxval=100, group = g_rsi)
i_color_uptrend = input.color(#2d472e, 'Uptrend Background', inline = 'up', group = g_rsi)
i_tcolor_uptrend = input.color(color.white, 'Text', inline = 'up', group = g_rsi)
i_color_mid = input.color(#131722, 'No Trend Background', group = g_rsi, inline = 'mid')
i_tcolor_mid = input.color(#b2b5be, 'Text', group = g_rsi, inline = 'mid')
i_threshold_downtrend = input.int(40, 'Downtrend Threshold', group = g_rsi, minval=0, maxval=49)
i_color_downtrend = input.color(#5b2e2e, 'Downtrend Background', group = g_rsi, inline = 'down')
i_tcolor_downtrend = input.color(color.white, 'Text', group = g_rsi, inline = 'down')
i_threshold_os = input.int(30, 'Oversold Threshold', minval=0, maxval=49, group = g_rsi)
i_color_os = input.color(#db3240, 'Oversold Background', group = g_rsi, inline = 'os')
i_tcolor_os = input.color(color.white, 'Text', group = g_rsi, inline = 'os')
g_rsi1 = 'RSI #1'
i_rsi1_enabled = input.bool(true, title = 'Enabled', group = g_rsi1)
i_rsi1_tf = input.timeframe('5', 'Timeframe', group = g_rsi1)
i_rsi1_len = input.int(14, 'Length', minval = 1, group = g_rsi1)
i_rsi1_src = input.source(close, 'Source', group = g_rsi1) * 10000
v_rsi1 = i_rsi1_enabled ? request.security(syminfo.tickerid, i_rsi1_tf, ta.rsi(i_rsi1_src, i_rsi1_len)) : na
g_rsi2 = 'RSI #2'
i_rsi2_enabled = input.bool(true, title = 'Enabled', group = g_rsi2)
i_rsi2_tf = input.timeframe('15', 'Timeframe', group = g_rsi2)
i_rsi2_len = input.int(14, 'Length', minval = 1, group = g_rsi2)
i_rsi2_src = input.source(close, 'Source', group = g_rsi2) * 10000
v_rsi2 = i_rsi2_enabled ? request.security(syminfo.tickerid, i_rsi2_tf, ta.rsi(i_rsi2_src, i_rsi2_len)) : na
g_rsi3 = 'RSI #3'
i_rsi3_enabled = input.bool(true, title = 'Enabled', group = g_rsi3)
i_rsi3_tf = input.timeframe('60', 'Timeframe', group = g_rsi3)
i_rsi3_len = input.int(14, 'Length', minval = 1, group = g_rsi3)
i_rsi3_src = input.source(close, 'Source', group = g_rsi3) * 10000
v_rsi3 = i_rsi3_enabled ? request.security(syminfo.tickerid, i_rsi3_tf, ta.rsi(i_rsi3_src, i_rsi3_len)) : na
g_rsi4 = 'RSI #4'
i_rsi4_enabled = input.bool(true, title = 'Enabled', group = g_rsi4)
i_rsi4_tf = input.timeframe('240', 'Timeframe', group = g_rsi4)
i_rsi4_len = input.int(14, 'Length', minval = 1, group = g_rsi4)
i_rsi4_src = input.source(close, 'Source', group = g_rsi4) * 10000
v_rsi4 = i_rsi4_enabled ? request.security(syminfo.tickerid, i_rsi4_tf, ta.rsi(i_rsi4_src, i_rsi4_len)) : na
g_rsi5 = 'RSI #5'
i_rsi5_enabled = input.bool(true, title = 'Enabled', group = g_rsi5)
i_rsi5_tf = input.timeframe('D', 'Timeframe', group = g_rsi5)
i_rsi5_len = input.int(14, 'Length', minval = 1, group = g_rsi5)
i_rsi5_src = input.source(close, 'Source', group = g_rsi5) * 10000
v_rsi5 = i_rsi5_enabled ? request.security(syminfo.tickerid, i_rsi5_tf, ta.rsi(i_rsi5_src, i_rsi5_len)) : na
g_rsi6 = 'RSI #6'
i_rsi6_enabled = input.bool(true, title = 'Enabled', group = g_rsi6)
i_rsi6_tf = input.timeframe('W', 'Timeframe', group = g_rsi6)
i_rsi6_len = input.int(14, 'Length', minval = 1, group = g_rsi6)
i_rsi6_src = input.source(close, 'Source', group = g_rsi6) * 10000
v_rsi6 = i_rsi6_enabled ? request.security(syminfo.tickerid, i_rsi6_tf, ta.rsi(i_rsi6_src, i_rsi6_len)) : na
g_rsi7 = 'RSI #7'
i_rsi7_enabled = input.bool(false, title = 'Enabled', group = g_rsi7)
i_rsi7_tf = input.timeframe('W', 'Timeframe', group = g_rsi7)
i_rsi7_len = input.int(14, 'Length', minval = 1, group = g_rsi7)
i_rsi7_src = input.source(close, 'Source', group = g_rsi7) * 10000
v_rsi7 = i_rsi7_enabled ? request.security(syminfo.tickerid, i_rsi7_tf, ta.rsi(i_rsi7_src, i_rsi7_len)) : na
g_rsi8 = 'RSI #8'
i_rsi8_enabled = input.bool(false, title = 'Enabled', group = g_rsi8)
i_rsi8_tf = input.timeframe('W', 'Timeframe', group = g_rsi8)
i_rsi8_len = input.int(14, 'Length', minval = 1, group = g_rsi8)
i_rsi8_src = input.source(close, 'Source', group = g_rsi8) * 10000
v_rsi8 = i_rsi8_enabled ? request.security(syminfo.tickerid, i_rsi8_tf, ta.rsi(i_rsi8_src, i_rsi8_len)) : na
g_rsi9 = 'RSI #9'
i_rsi9_enabled = input.bool(false, title = 'Enabled', group = g_rsi9)
i_rsi9_tf = input.timeframe('W', 'Timeframe', group = g_rsi9)
i_rsi9_len = input.int(14, 'Length', minval = 1, group = g_rsi9)
i_rsi9_src = input.source(close, 'Source', group = g_rsi9) * 10000
v_rsi9 = i_rsi9_enabled ? request.security(syminfo.tickerid, i_rsi9_tf, ta.rsi(i_rsi9_src, i_rsi9_len)) : na
g_rsi10 = 'RSI #10'
i_rsi10_enabled = input.bool(false, title = 'Enabled', group = g_rsi10)
i_rsi10_tf = input.timeframe('W', 'Timeframe', group = g_rsi10)
i_rsi10_len = input.int(14, 'Length', minval = 1, group = g_rsi10)
i_rsi10_src = input.source(close, 'Source', group = g_rsi10) * 10000
v_rsi10 = i_rsi10_enabled ? request.security(syminfo.tickerid, i_rsi10_tf, ta.rsi(i_rsi10_src, i_rsi10_len)) : na
f_StrPositionToConst(_p) =>
switch _p
'Top Left' => position.top_left
'Top Right' => position.top_right
'Top Center' => position.top_center
'Middle Left' => position.middle_left
'Middle Right' => position.middle_right
'Middle Center' => position.middle_center
'Bottom Left' => position.bottom_left
'Bottom Right' => position.bottom_right
'Bottom Center' => position.bottom_center
=> position.bottom_right
f_timeframeToHuman(_tf) =>
seconds = timeframe.in_seconds(_tf)
if seconds < 60
_tf
else if seconds < 3600
str.tostring(seconds / 60) + 'm'
else if seconds < 86400
str.tostring(seconds / 60 / 60) + 'h'
else
switch _tf
"1D" => "D"
"1W" => "W"
"1M" => "M"
=> str.tostring(_tf)
type TPanel
table src = na
bool vertical_orientation = true
int row = 0
int col = 0
method incCol(TPanel _panel) =>
if _panel.vertical_orientation
_panel.col += 1
else
_panel.row += 1
method incRow(TPanel _panel) =>
if not _panel.vertical_orientation
_panel.col += 1
_panel.row := 0
else
_panel.row += 1
_panel.col := 0
method add(TPanel _panel, string _v1, color _bg1, color _ctext1, string _v2, color _bg2, color _ctext2) =>
table.cell(_panel.src, _panel.col, _panel.row, _v1, text_color = _ctext1, bgcolor = _bg1)
_panel.incCol()
table.cell(_panel.src, _panel.col, _panel.row, _v2, text_color = _ctext2, bgcolor = _bg2)
_panel.incRow()
f_bg(_rsi) =>
c_line = na(_rsi) ? i_color_mid :
_rsi >= i_threshold_ob ? i_color_ob :
_rsi >= i_threshold_uptrend ? i_color_uptrend :
_rsi <= i_threshold_os ? i_color_os :
_rsi <= i_threshold_downtrend ? i_color_downtrend :
i_color_mid
f_rsi_text_color(_rsi) =>
c_line = na(_rsi) ? i_tcolor_mid :
_rsi >= i_threshold_ob ? i_tcolor_ob :
_rsi >= i_threshold_uptrend ? i_tcolor_uptrend :
_rsi <= i_threshold_os ? i_tcolor_os :
_rsi <= i_threshold_downtrend ? i_tcolor_downtrend :
i_tcolor_mid
f_formatRsi(_rsi) => na(_rsi) ? 'N/A' : str.tostring(_rsi, '0.00')
if barstate.islast
v_panel = TPanel.new(vertical_orientation = i_orientation == 'Vertical')
v_max_rows = 20
v_panel.src := table.new(f_StrPositionToConst(i_position), v_max_rows, v_max_rows, border_width = i_border_width, border_color = i_color_border)
if i_showHeaders
v_panel.add('TF', i_color_header_bg, i_color_header_text, 'RSI', i_color_header_bg, i_color_header_text)
if i_rsi1_enabled
v_panel.add(f_timeframeToHuman(i_rsi1_tf), i_color_tf_bg, i_color_tf_text, f_formatRsi(v_rsi1), f_bg(v_rsi1), f_rsi_text_color(v_rsi1))
if i_rsi2_enabled
v_panel.add(f_timeframeToHuman(i_rsi2_tf), i_color_tf_bg, i_color_tf_text, f_formatRsi(v_rsi2), f_bg(v_rsi2), f_rsi_text_color(v_rsi2))
if i_rsi3_enabled
v_panel.add(f_timeframeToHuman(i_rsi3_tf), i_color_tf_bg, i_color_tf_text, f_formatRsi(v_rsi3), f_bg(v_rsi3), f_rsi_text_color(v_rsi3))
if i_rsi4_enabled
v_panel.add(f_timeframeToHuman(i_rsi4_tf), i_color_tf_bg, i_color_tf_text, f_formatRsi(v_rsi4), f_bg(v_rsi4), f_rsi_text_color(v_rsi4))
if i_rsi5_enabled
v_panel.add(f_timeframeToHuman(i_rsi5_tf), i_color_tf_bg, i_color_tf_text, f_formatRsi(v_rsi5), f_bg(v_rsi5), f_rsi_text_color(v_rsi5))
if i_rsi6_enabled
v_panel.add(f_timeframeToHuman(i_rsi6_tf), i_color_tf_bg, i_color_tf_text, f_formatRsi(v_rsi6), f_bg(v_rsi6), f_rsi_text_color(v_rsi6))
if i_rsi7_enabled
v_panel.add(f_timeframeToHuman(i_rsi7_tf), i_color_tf_bg, i_color_tf_text, f_formatRsi(v_rsi7), f_bg(v_rsi7), f_rsi_text_color(v_rsi7))
if i_rsi8_enabled
v_panel.add(f_timeframeToHuman(i_rsi8_tf), i_color_tf_bg, i_color_tf_text, f_formatRsi(v_rsi8), f_bg(v_rsi8), f_rsi_text_color(v_rsi8))
if i_rsi9_enabled
v_panel.add(f_timeframeToHuman(i_rsi9_tf), i_color_tf_bg, i_color_tf_text, f_formatRsi(v_rsi9), f_bg(v_rsi9), f_rsi_text_color(v_rsi9))
if i_rsi10_enabled
v_panel.add(f_timeframeToHuman(i_rsi10_tf), i_color_tf_bg, i_color_tf_text, f_formatRsi(v_rsi10), f_bg(v_rsi10), f_rsi_text_color(v_rsi10))
if i_debug
t = table.new(position.middle_center, 21, 20, border_width = i_border_width, border_color = i_color_border)
v_panel2 = TPanel.new(t, vertical_orientation = i_orientation == 'Vertical')
v_panel2.add('Debug', i_color_header_bg, i_color_header_text, 'Colors', i_color_header_bg, i_color_header_text)
demo = map.new()
map.put(demo, 'Overbought', i_threshold_ob)
map.put(demo, 'Uptrend', i_threshold_uptrend)
map.put(demo, 'No Trend', 50)
map.put(demo, 'Downtrend', i_threshold_downtrend)
map.put(demo, 'Oversold', i_threshold_os)
demoKeys = map.keys(demo)
for key in demoKeys
tf = key
rsi = map.get(demo, key)
v_panel2.add(tf, i_color_tf_bg, i_color_tf_text, f_formatRsi(rsi), f_bg(rsi), f_rsi_text_color(rsi))

ALISH WEEK LABELS THE ALISH WEEK LABELS
Overview
This indicator programmatically delineates each trading week and encapsulates its realized price range in a live-updating, filled rectangle. A week is defined in America/Toronto time from Monday 00:00 to Friday 16:00. Weekly market open to market close, For every week, the script draws:
a vertical start line at the first bar of Monday 00:00,
a vertical end line at the first bar at/after Friday 16:00, and
a white, semi-transparent box whose top tracks the highest price and whose bottom tracks the lowest price observed between those two temporal boundaries.
The drawing is timeframe-agnostic (M1 → 1D): the box expands in real time while the week is open and freezes at the close boundary.
Time Reference and Session Boundaries
All scheduling decisions are computed with time functions called using the fixed timezone string "America/Toronto", ensuring correct behavior across DST transitions without relying on chart timezone. The start condition is met at the first bar where (dayofweek == Monday && hour == 0 && minute == 0); on higher timeframes where an exact 00:00 bar may not exist, a fallback checks for the first Monday bar using ta.change(dayofweek). The close condition is met on the first bar at or after Friday 16:00 (Toronto), which guarantees deterministic closure on intraday and higher timeframes.
State Model
The indicator maintains minimal persistent state using var globals:
week_open (bool): whether the current weekly session is active.
wk_hi / wk_lo (float): rolling extrema for the active week.
wk_box (box): the graphical rectangle spanning × .
wk_start_line and a transient wk_end_line (line): vertical delimiters at the week’s start and end.
Two dynamic arrays (boxes, vlines) store object handles to support bounded history and deterministic garbage collection.
Update Cycle (Per Bar)
On each bar the script executes the following pipeline:
Start Check: If no week is open and the start condition is satisfied, instantiate wk_box anchored at the current bar_index, prime wk_hi/wk_lo with the bar’s high/low, create the start line, and push both handles to their arrays.
Accrual (while week_open): Update wk_hi/wk_lo using math.max/min with current bar extremes. Propagate those values to the active wk_box via box.set_top/bottom and slide box.set_right to the current bar_index to keep the box flush with live price.
Close Check: If at/after Friday 16:00, finalize the week by freezing the right edge (box.set_right), drawing the end line, pushing its handle, and flipping week_open false.
Retention Pruning: Enforce a hard cap on historical elements by deleting the oldest objects when counts exceed configured limits.
Drawing Semantics
The range container is a filled white rectangle (bgcolor = color.new(color.white, 100 − opacity)), with a solid white border for clear contrast on dark or light themes. Start/end boundaries are full-height vertical white lines (y1=+1e10, y2=−1e10) to guarantee visibility across auto-scaled y-axes. This approach avoids reliance on price-dependent anchors for the lines and is robust to large volatility spikes.
Multi-Timeframe Behavior
Because session logic is driven by wall-clock time in the Toronto zone, the indicator remains consistent across chart resolutions. On coarse timeframes where an exact boundary bar might not exist, the script legally approximates by triggering on the first available bar within or immediately after the boundary (e.g., Friday 16:00 occurs between two 4-hour bars). The box therefore represents the true realized high/low of the bars present in that timeframe, which is the correct visual for that resolution.
Inputs and Defaults
Weeks to keep (show_weeks_back): integer, default 40. Controls retention of historical boxes/lines to avoid UI clutter and resource overhead.
Fill opacity (fill_opacity): integer 0–100, default 88. Controls how solid the white fill appears; border color is fixed pure white for crisp edges.
Time zone is intentionally fixed to "America/Toronto" to match the strategy definition and maintain consistent historical backtesting.
Performance and Limits
Objects are reused only within a week; upon closure, handles are stored and later purged when history limits are exceeded. The script sets generous but safe caps (max_boxes_count/max_lines_count) to accommodate 40 weeks while preserving Editor constraints. Per-bar work is O(1), and pruning loops are bounded by the configured history length, keeping runtime predictable on long histories.
Edge Cases and Guarantees
DST Transitions: Using a fixed IANA time zone ensures Friday 16:00 and Monday 00:00 boundaries shift correctly when DST changes in Toronto.
Weekend Gaps/Holidays: If the market lacks bars exactly at boundaries, the nearest subsequent bar triggers the start/close logic; range statistics still reflect observed prices.
Live vs Historical: During live sessions the box edge advances every bar; when replaying history or backtesting, the same rules apply deterministically.
Scope (Intentional Simplicity)
This tool is strictly a visual framing indicator. It does not compute labels, statistics, alerts, or extended S/R projections. Its single responsibility is to clearly present the week’s realized range in the Toronto session window so you can layer your own execution or analytics on top.

Adaptive Vol Gauge [ParadoxAlgo]This is an overlay tool that measures and shows market ups and downs (volatility) based on daily high and low prices. It adjusts automatically to recent price changes and highlights calm or wild market periods. It colors the chart background and bars in shades of blue to cyan, with optional small labels for changes in market mood. Use it for info only—combine with your own analysis and risk controls. It's not a buy/sell signal or promise of results.Key FeaturesSmart Volatility Measure: Tracks price swings with a flexible time window that reacts to market speed.
Market Mood Detection: Spots high-energy (wild) or low-energy (calm) phases to help see shifts.
Visual Style: Uses smooth color fades on the background and bars—cyan for calm, deep blue for wild—to blend nicely on your chart.
Custom Options: Change settings like time periods, sensitivity, colors, and labels.
Chart Fit: Sits right on your main price chart without extra lines, keeping things clean.
How It WorksThe tool figures out volatility like this:Adjustment Factor:Looks at recent price ranges compared to longer ones.
Tweaks the time window (between 10-50 bars) based on how fast prices are moving.
Volatility Calc:Adds up logs of high/low ranges over the adjusted window.
Takes the square root for the final value.
Can scale it to yearly terms for easy comparison across chart timeframes.
Mood Check:Compares current volatility to its recent average and spread.
Flags "high" if above your set level, "low" if below.
Neutral in between.
This setup makes it quicker in busy markets and steadier in quiet ones.Settings You Can ChangeAdjust in the tool's menu:Base Time Window (default: 20): Starting point for calculations. Bigger numbers smooth things out but might miss quick changes.
Adjustment Strength (default: 0.5): How much it reacts to price speed. Low = steady; high = quick changes.
Yearly Scaling (default: on): Makes values comparable across short or long charts. Turn off for raw numbers.
Mood Sensitivity (default: 1.0): How strict for calling high/low moods. Low = more shifts; high = only big ones.
Show Labels (default: on): Adds tiny "High Vol" or "Low Vol" tags when moods change. They point up or down from bars.
Background Fade (default: 80): How see-through the color fill is (0 = invisible, 100 = solid).
Bar Fade (default: 50): How much color blends into your candles or bars (0 = none, 100 = full).
How to Read and Use ItColor Shifts:Background and bars fade based on mood strength:Cyan shades mean calm markets (good for steady, back-and-forth trades).
Deep blue shades mean wild markets (watch for big moves or turns).
Smooth changes show volatility building or easing.
Labels:"High Vol" (deep blue, from below bar): Start of wild phase.
"Low Vol" (cyan, from above bar): Start of calm phase.
Only shows at changes to avoid clutter. Use for timing strategy tweaks.
Trading Ideas:Mood-Based Plays: In wild phases (deep blue), try chase-momentum or breakout trades since swings are bigger. In calm phases (cyan), stick to bounce-back or range trades.
Risk Tips: Cut trade sizes in wild times to handle bigger losses. Use calm times for longer holds with close stops.
Chart Time Tips: Turn on yearly scaling for matching short and long views. Test settings on past data—loosen for quick trades (more alerts), tighten for longer ones (fewer, stronger).
Mix with Others: Add trend lines or averages—buy in calm up-moves, sell in wild down-moves. Check with volume or key levels too.
Special Cases: In big news events, it reacts faster. On slow assets, it might overstate swings—ease the adjustment strength.
Limits and TipsIt looks back at past data, so it trails real-time action and can't predict ahead.
Results differ by stock or timeframe—test on history first.
Colors and tags are just visuals; set your own alerts if needed.
Follows TradingView rules: No win promises, for learning only. Open for sharing; share thoughts in forums.
With this, you can spot market energy and tweak your trades smarter. Start on practice charts.

Tick-Based Delta Volume BubblesTICK-BASED DELTA VOLUME BUBBLES
OVERVIEW
A real-time order flow indicator that displays volume delta at the tick level, helping traders identify buying and selling pressure as it develops during live market hours. Unlike traditional volume delta indicators that rely on bar close data, this indicator captures actual tick-by-tick volume changes and directional bias, providing granular insight into market dynamics.
HOW IT WORKS
The indicator monitors live tick data during real-time trading by tracking volume increases between consecutive price updates. Each time volume increments, the script calculates the volume delta, determines price direction, assigns directional bias to the volume, and accumulates net delta for each bar.
This methodology is identical to the tick detection mechanism used in professional cumulative volume delta tools, ensuring accuracy and reliability.
FEATURES
Real-Time Tick Detection
- Captures genuine tick-by-tick volume flow using varip persistence
- Not estimated from OHLC data
- Processes actual market ticks as they occur
Adaptive Bubble Sizing
- Bubbles scale based on delta strength relative to a customizable moving average (default 20 bars)
- Highlights significant order flow imbalances
- Five size levels from tiny to huge
Dual Display Modes
- Normal Mode: Sized bubbles with optional volume labels positioned at bar midpoint
- Minimal Mode: Clean dots above/below bars for unobtrusive delta visualization
Flow Classification
- Aggressive Buy (bright green): Strong positive delta with greater than 1.2x strength
- Aggressive Sell (bright red): Strong negative delta with greater than 1.2x strength
- Passive Buy (light green): Moderate positive delta
- Passive Sell (light red): Moderate negative delta
Intensity Mode (Optional)
- Gray: Low intensity (less than 0.5x average)
- Blue: Medium intensity (0.5-1.0x average)
- Orange: High intensity (1.0-2.0x average)
- Red: Extreme intensity (greater than 2.0x average)
Smart Filtering
- Percentile-based filters (customizable) ensure only significant delta events are displayed
- Reduces chart clutter while highlighting important order flow
- Separate thresholds for bubble display and numeric labels
Data Collection Status
- Optional progress box in top-right corner
- Shows real-time bar collection progress
- Displays percentage completion and bars remaining
- Automatically hides when sufficient data is collected
Hide Until Ready Option
- Suppresses bubble display until the averaging period is complete
- Prevents misleading signals from incomplete data
- Default requires 20 bars before displaying bubbles
SETTINGS
Delta Average Length (1-200, default 20)
- Lookback period for calculating delta strength baseline
- Higher values = longer-term delta comparison
- Lower values = more sensitive to recent changes
Hide Bubbles Until Enough Data
- Prevents display until averaging period completes
- Ensures reliable delta strength calculations
Show Data Collection Status Box
- Displays progress indicator during initialization
- Can be disabled if you understand the warmup period
Minimal Mode
- Switches to simple dot display above/below bars
- Green dots above bars = positive delta
- Red dots below bars = negative delta
- Maintains color intensity or flow type classification
Show Bubbles
- Master toggle for bubble display
Bubble Volume Percentile (0-100, default 60)
- Minimum percentile rank required to display bubble
- Higher values = fewer, more significant bubbles
- Lower values = more bubbles displayed
Show Numbers in Bubbles
- Toggle delta value labels
- Only appears in normal mode
- Disabled automatically in minimal mode
Label Volume Percentile (0-100, default 90)
- Higher threshold for displaying numeric labels
- Typically set higher than bubble percentile
- Reduces label clutter on chart
Intensity Mode
- Switch from flow-type coloring to magnitude-based coloring
- Useful for identifying volume spikes regardless of direction
IMPORTANT NOTES
Real-Time Only: This indicator processes live tick data and does not provide historical analysis. It begins collecting data when added to a live chart.
Volume Required: Symbol must have volume data available. Will not function on symbols without volume (most forex pairs from retail brokers).
Initialization Period: Requires the specified number of bars (default 20) to calculate accurate delta strength. Use the "Hide Until Ready" option to prevent premature signals.
Market Hours: Only collects data during live market hours. Does not backfill historical data.
CREDITS
Tick detection methodology inspired by the Kioseff Trading Tick CVD indicator. This implementation adapts the same core tick-level volume delta calculation for bubble-style visualization and per-bar delta analysis.

EMAs de JahazielThis indicator displays seven Exponential Moving Averages (EMA 5, 6, 9, 20, 50, 100, and 200) to help identify short-, medium-, and long-term market trends.
When shorter EMAs (5, 6, 9) cross above longer EMAs (50, 100, 200), it suggests increasing bullish momentum and potential uptrend continuation.
Conversely, when shorter EMAs cross below longer EMAs, it indicates potential bearish momentum and a possible downtrend.
📈 The combination of these EMAs helps traders visualize market structure, momentum shifts, and key dynamic support/resistance levels.
🧠 Suitable for scalping, intraday trading, swing trading, or confirming higher time frame trends across any market — Forex, indices, crypto, or commodities.

Forecast PriceTime Oracle [CHE] Forecast PriceTime Oracle — Prioritizes quality over quantity by using Power Pivots via RSI %B metric to forecast future pivot highs/lows in price and time
Summary
This indicator identifies potential pivot highs and lows based on out-of-bounds conditions in a modified RSI %B metric, then projects future occurrences by estimating time intervals and price changes from historical medians. It provides visual forecasts via diagonal and horizontal lines, tracks achievement with color changes and symbols, and displays a dashboard for statistical overview including hit rates. Signals are robust due to median-based aggregation, which reduces outlier influence, and optional tolerance settings for near-misses, making it suitable for anticipating reversals in ranging or trending markets.
Motivation: Why this design?
Standard pivot detection often lags or generates false signals in volatile conditions, missing the timing of true extrema. This design leverages out-of-bounds excursions in RSI %B to capture "Power Pivots" early—focusing on quality over quantity by prioritizing significant extrema rather than every minor swing—then uses historical deltas in time and price to forecast the next ones, addressing the need for proactive rather than reactive analysis. It assumes that pivot spacing follows statistical patterns, allowing users to prepare entries or exits ahead of confirmation.
What’s different vs. standard approaches?
- Reference baseline: Diverges from traditional ta.pivothigh/low, which require fixed left/right lengths and confirm only after bars close, often too late for dynamic markets.
- Architecture differences:
- Detects extrema during OOB runs rather than post-bar symmetry.
- Aggregates deltas via medians (or alternatives) over a user-defined history, capping arrays to manage resources.
- Applies tolerance thresholds for hit detection, with options for percentage, absolute, or volatility-adjusted (ATR) flexibility.
- Freezes achieved forecasts with visual states to avoid clutter.
- Practical effect: Charts show proactive dashed projections instead of retrospective dots; the dashboard reveals evolving hit rates, helping users gauge reliability over time without manual calculation.
How it works (technical)
The indicator first computes a smoothed RSI over a specified length, then applies Bollinger Bands to derive %B, flagging out-of-bounds below zero or above one hundred as potential run starts. During these runs, it tracks the extreme high or low price and bar index. Upon exit from the OOB state, it confirms the Power Pivot at that extreme and records the time delta (bars since prior) and price change percentage to rolling arrays.
For forecasts, it calculates the median (or selected statistic) of recent deltas, subtracts the confirmation delay (bars from apex to exit), and projects ahead by that adjusted amount. Price targets use the median change applied to the origin pivot value. Lines are drawn from the apex to the target bar and price, with a short horizontal at the endpoint. Arrays store up to five active forecasts, pruning oldest on overflow.
Tolerance adjusts hit checks: for highs, if the high reaches or exceeds the target (adjusted by tolerance); for lows, if the low drops to or below. Once hit, the forecast freezes, changing colors and symbols, and extends the horizontal to the hit bar. Persistent variables maintain last pivot states across bars; arrays initialize empty and grow until capped at history length.
Parameter Guide
Source: Specifies the data input for the RSI computation, influencing how price action is captured. Default is close. For conservative signals in noisy environments, switch to high; using low boosts responsiveness but may increase false positives.
RSI Length: Sets the smoothing period for the RSI calculation, with longer values helping to filter out whipsaws. Default is 32. Opt for shorter lengths like 14 to 21 on faster timeframes for quicker reactions, or extend to 50 or more in strong trends to enhance stability at the cost of some lag.
BB Length: Defines the period for the Bollinger Bands applied to %B, directly affecting how often out-of-bounds conditions are triggered. Default is 20. Align it with the RSI length: shorter periods detect more potential runs but risk added noise, while longer ones provide better filtering yet might overlook emerging extrema.
BB StdDev: Controls the multiplier for the standard deviation in the bands, where wider settings reduce false out-of-bounds alerts. Default is 2.0. Narrow it to 1.5 for highly volatile assets to catch more signals, or broaden to 2.5 or higher to emphasize only major movements.
Show Price Forecast: Enables or disables the display of diagonal and target lines along with their updates. Default is true. Turn it off for simpler chart views, or keep it on to aid in trade planning.
History Length: Determines the number of recent pivot samples used for median-based statistics, where more history leads to smoother but potentially less current estimates. Default is 50. Start with a minimum of 5 to build data; limit to 100 to 200 to prevent outdated regimes from skewing results.
Max Lookahead: Limits the number of bars projected forward to avoid overly extended lines. Default is 500. Reduce to 100 to 200 for intraday focus, or increase for longer swing horizons.
Stat Method: Selects the aggregation technique for time and price deltas: Median for robustness against outliers, Trimmed Mean (20%) for a balanced trim of extremes, or 75th Percentile for a conservative upward tilt. Default is Median. Use Median for even distributions; switch to Percentile when emphasizing potential upside in trending conditions.
Tolerance Type: Chooses the approach for flexible hit detection: None for exact matches, Percentage for relative adjustments, Absolute for fixed point offsets, or ATR for scaling with volatility. Default is None. Begin with Percentage at 0.5 percent for currency pairs, or ATR for adapting to cryptocurrency swings.
Tolerance %: Provides the relative buffer when using Percentage mode, forgiving small deviations. Default is 0.5. Set between 0.2 and 1.0 percent; higher values accommodate gaps but can overstate hit counts.
Tolerance Points: Establishes a fixed offset in price units for Absolute mode. Default is 0.0010. Tailor to the asset, such as 0.0001 for forex pairs, and validate against past wick behavior.
ATR Length: Specifies the period for the Average True Range in dynamic tolerance calculations. Default is 14. This is the standard setting; shorten to 10 to reflect more recent volatility.
ATR Multiplier: Adjusts the ATR scale for tolerance width in ATR mode. Default is 0.5. Range from 0.3 for tighter precision to 0.8 for greater leniency.
Dashboard Location: Positions the summary table on the chart. Default is Bottom Right. Consider Top Left for better visibility on mobile devices.
Dashboard Size: Controls the text scaling for dashboard readability. Default is Normal. Choose Tiny for dense overlays or Large for detailed review sessions.
Text/Frame Color: Sets the color scheme for dashboard text and borders. Default is gray. Align with your chart theme, opting for lighter shades on dark backgrounds.
Reading & Interpretation
Forecast lines appear as dashed diagonals from confirmed pivots to projected targets, with solid horizontals at endpoints marking price levels. Open targets show a target symbol (🎯); achieved ones switch to a trophy symbol (🏆) in gray, with lines fading to gray. The dashboard summarizes median time/price deltas, sample counts, and hit rates—rising rates indicate improving forecast alignment. Colors differentiate highs (red) from lows (lime); frozen states signal validated projections.
Practical Workflows & Combinations
- Trend following: Enter long on low forecast hits during uptrends (higher highs/lower lows structure); filter with EMA crossovers to ignore counter-trend signals.
- Reversal setups: Short above high projections in overextended rallies; use volume spikes as confirmation to reduce false breaks.
- Exits/Stops: Trail stops to prior pivot lows; conservative on low hit rates (below 50%), aggressive above 70% with tight tolerance.
- Multi-TF: Apply on 1H for entries, 4H for time projections; combine with Ichimoku clouds for confluence on targets.
- Risk management: Position size inversely to delta uncertainty (wider history = smaller bets); avoid low-liquidity sessions.
Behavior, Constraints & Performance
Confirmation occurs on OOB exit, so live-bar pivots may adjust until close, but projections update only on events to minimize repaint. No security or HTF calls, so no external lookahead issues. Arrays cap at history length with shifts; forecasts limited to five active, pruning FIFO. Loops iterate over small fixed sizes (e.g., up to 50 for stats), efficient on most hardware. Max lines/labels at 500 prevent overflow.
Known limits: Sensitive to OOB parameter tuning—too tight misses runs; assumes stationary pivot stats, which may shift in regime changes like low vol. Gaps or holidays distort time deltas.
Sensible Defaults & Quick Tuning
Defaults suit forex/crypto on 1H–4H: RSI 32/BB 20 for balanced detection, Median stats over 50 samples, None tolerance for exactness.
- Too many false runs: Increase BB StdDev to 2.5 or RSI Length to 50 for filtering.
- Lagging forecasts: Shorten History Length to 20; switch to 75th Percentile for forward bias.
- Missed near-hits: Enable Percentage tolerance at 0.3% to capture wicks without overcounting.
- Cluttered charts: Reduce Max Lookahead to 200; disable dashboard on lower TFs.
What this indicator is—and isn’t
This is a forecasting visualization layer for pivot-based analysis, highlighting statistical projections from historical patterns. It is not a standalone system—pair with price action, volume, and risk rules. Not predictive of all turns; focuses on OOB-derived extrema, ignoring volume or news impacts.
Disclaimer
The content provided, including all code and materials, is strictly for educational and informational purposes only. It is not intended as, and should not be interpreted as, financial advice, a recommendation to buy or sell any financial instrument, or an offer of any financial product or service. All strategies, tools, and examples discussed are provided for illustrative purposes to demonstrate coding techniques and the functionality of Pine Script within a trading context.
Any results from strategies or tools provided are hypothetical, and past performance is not indicative of future results. Trading and investing involve high risk, including the potential loss of principal, and may not be suitable for all individuals. Before making any trading decisions, please consult with a qualified financial professional to understand the risks involved.
By using this script, you acknowledge and agree that any trading decisions are made solely at your discretion and risk.
Do not use this indicator on Heikin-Ashi, Renko, Kagi, Point-and-Figure, or Range charts, as these chart types can produce unrealistic results for signal markers and alerts.
Best regards and happy trading
Chervolino

Diwali Lights Pro — 7-Diyas Signal Matrix [KedArc Quant]🎯 Overview
“Diwali Lights Pro — 7-Diyas Signal Matrix” is a precision-built trend-sentiment indicator that blends the glow of seven technical “diyas” — each representing a different momentum or strength dimension — into one intuitive signal matrix. It was designed to celebrate light, discipline, and clarity in trading — helping traders filter noise, identify strong trend shifts, and take trades with conviction. Each diya is powered by a proven indicator component: RSI, Stochastic, EMA trend strength, and momentum slopes.Together, they light up your chart with buy/sell signals only when technical confluence aligns — like the diyas of Diwali shining in harmony.
💡 Core Concept
The indicator computes a composite score (–9 to +9) by evaluating seven key parameters:
| # | Diya | Logic | Interpretation |
| 1 | RSI | Overbought / Oversold | Short-term momentum exhaustion |
| 2 | Stochastic | Direction & zones | Confirmation of RSI |
| 3 | Price vs EMA20 | Position of price | Near-term trend bias |
| 4 | EMA20 Slope | Short-term momentum | Strength confirmation |
| 5 | EMA50 Slope | Mid-term trend | Trend stability |
| 6 | EMA100 Slope | Medium-term sentiment | Institutional bias |
| 7 | EMA200 Slope | Long-term sentiment | Market direction baseline |
The total of these 7 diyas creates a signal matrix that dynamically adapts to trend conditions.
⚙️ Inputs & Configuration
| RSI Length | 14 | Standard RSI window |
| Stochastic Length | 14 | Measures momentum oscillation |
| EMA Periods | 20, 50, 100, 200 | Multi-layer trend structure |
| Overbought / Oversold Zones | 70 / 30 | Configurable thresholds |
| Show Buy/Sell Labels | ✅ | Toggle signal markers |
| Show Banner | ✅ | Festive Diwali header with fireworks |
| Twinkle Interval | 10 bars | Animation timing |
| Fireworks Count | 18 | Visual celebration intensity |
| Background Opacity | 100% | Style preference |
🧭 Entry & Exit Logic
# ✅ Buy Signal (🪔)
A Buy triggers when:
* The total diya score crosses above zero,
* And at least four of seven components turn bullish.
This indicates that short-term oscillators, price action, and moving averages are all turning in unison — a strong entry zone after a pullback.
# 🔥 Sell Signal (🔥)
A Sell triggers when:
* The total diya score crosses below zero,
* And multiple slopes or price conditions flip bearish.
This flags weakening momentum and possible trend exhaustion.
# 💬 Suggested Usage
* Works beautifully on 5-min to 1-hour charts.
* Best when used with trend confirmation tools (volume, price structure).
* Avoid entering trades when signals flip rapidly within narrow ranges (sideways zones).
🧪 Mathematical Formulae
1. RSI Bucket (p₁):
p₁ =
2 if RSI < Very Oversold
1 if RSI < Oversold
0 if neutral
-1 if RSI > Overbought
-2 if RSI > Very Overbought
2. Stochastic Bucket (p₂): Similar to RSI bucketing.
3. Price vs EMA20 (p₃):
p₃ = sign(close - EMA20)
4–7. Slope Sign (EMA20, 50, 100, 200):
p₄₋₇ = sign(EMA - EMA )
Total Score = Σ(p₁…p₇)
→ Crossover(total_score, 0) → Buy Signal
→ Crossunder(total_score, 0) → Sell Signal
📊 Why It’s Not Just a Mash-Up
Diwali Lights Pro uses:
* A unified scoring engine with weighted logic rather than conflicting triggers.
* Each component (diya) contributes equally, creating a normalized sentiment index.
* Smart signal filtering prevents repetitive false flips by enforcing trend alignment across multiple time frames.
* A dynamic, responsive structure optimized for clarity and minimal repainting.
🎆 Unique Add-Ons
* Top-Right Diwali Banner: Festive “Happy Diwali” with animated fireworks 🎇 and diyas 🪔.
* Signal Filtering: Reduces noise in volatile ranges.
* EMA Cloud Context: Visual clarity of multi-layer trend zones.
* Optional Light Mode: Change fireworks opacity for a subtle or bright effect.
📘 FAQ
Q1: Does this repaint?
No — it uses confirmed values (RSI, Stochastic, EMA slopes). Signals appear only after the bar closes.
Q2: Which timeframes work best?
Between 5m and 1h, depending on your strategy.
Use higher EMAs for swing setups.
Q3: Can I use it with alerts?
Yes, both Buy and Sell triggers come with built-in `alertcondition()` for instant notifications.
Q4: Can it be combined with other indicators?
Absolutely — it pairs well with volume profiles, volatility bands, or order-flow systems.
🪔 Glossary
| Diya | Candle or light — here, each diya = one technical indicator |
| EMA | Exponential Moving Average — measures smoothed trend bias |
| RSI | Relative Strength Index — momentum overbought/oversold oscillator |
| Stochastic | Momentum oscillator measuring closing levels relative to highs/lows |
| Slope Sign | Direction of EMA movement — rising or falling |
| Signal Matrix | The combined system of all seven diyas generating a unified score |
🧭 Final Note
> *Diwali Lights Pro* is not just a trading tool — it’s a visual celebration of confluence and discipline.
> When the diyas align, trends shine. Use it to trade in harmony with light, not against it. 🌟
⚠️ Disclaimer
This script is provided for educational purposes only.
Past performance does not guarantee future results.
Trading involves risk, and users should exercise caution and use proper risk management when applying this strategy.

True Single Line Fusion [by TitikSona]🧠 Full Description
True Single Line Fusion by TitikSona is an open-source oscillator that unifies Fast Stochastic, Slow Stochastic, and RSI into a single smooth momentum line.
It simplifies multi-oscillator analysis into one clear visual — helping traders recognize potential momentum shifts, exhaustion, and reversal zones.
⚙️ Core Logic
The indicator calculates:
Fast Stochastic (12,3,3) → short-term swing sensitivity
Slow Stochastic (100,8,8) → broad trend context
RSI (26) → overall strength and directional bias
All three are normalized (0–100) and averaged to form the Fusion Line, creating a single unified momentum curve.
A Signal Line (SMA-9) and Histogram are added to highlight short-term acceleration or deceleration.
Formula: Fusion = (FastK + SlowK + RSI) / 3
🔍 Interpretation
Fusion Line rising → momentum strengthening upward
Fusion Line falling → momentum weakening
Histogram color (green/red) shows the direction and intensity of the move
Background highlights identify potential extremes:
🟩 Green = potential oversold region
🟥 Red = potential overbought region
💡 How to Use
Works on any symbol and timeframe.
Use the Fusion Line’s direction and slope as momentum context, not as direct buy/sell signals.
Combine with price structure, support/resistance, or volume analysis to confirm potential reversals.
Example:
Fusion Line turning upward from green zone → possible bullish momentum shift
Fusion Line turning downward from red zone → possible bearish exhaustion
📘 Notes
Ideal for identifying turning points in ranging or consolidating markets.
Does not generate automated signals or predictions.
Open-source for learning, modification, and educational use.
Designed for clarity, low lag, and clean visualization.
🧩 Developed and shared by TitikSona — made to unify oscillators into one adaptive momentum tool.

Moving Averages PowerMoving Averages Power — Trend + Normalized Strength
Lightweight indicator that plots up to 15 SMAs (5 → 4320) and shows a compact table with each MA’s:
Slope % (per-bar)
Trend (Bullish/Bearish/Neutral)
Normalized “Strength” bars comparable across MA lengths and, optionally, across timeframes via ATR%
Not financial advice. For research/education only.
What it does
Plots 15 SMA lines on the price chart
Colors match trend: Bullish (green), Bearish (red), Neutral (gray)
Bottom-right table: MA, Slope %, Trend, Strength bars
Strength normalization modes:
None: raw |slope%|
Length: scales by length relative to a reference length
ATR%: scales by volatility (ATR as % of price)
Length+ATR%: combines both for better cross-timeframe comparability
How it works (concepts)
Slope % per bar: 100 × (MA − MA ) / MA
Normalization:
None: S = |slope%|
Length: S = |slope%| × (length / normRefLen)
ATR%: S = |slope%| / ATR%, where ATR% = 100 × ATR(atrLen) / close
Length+ATR%: S = (|slope%| × (length / normRefLen)) / ATR%
Bars: floor(S / strengthStep), clamped to Max bars (default 10)
Notes:
normRefLen (default 240) keeps Length scaling stable across very short and very long MAs
In ATR modes, Strength shows blank until there’s enough history for ATR
How to use
Add the indicator to your chart (Indicators → search this title → Add).
Open Settings:
Show/hide any of the 15 SMAs
Choose Strength normalization mode
Tune Strength step, Max bars, Reference length, and ATR Length
Read the table:
MA: period
Slope %: per-bar percent change of the MA
Trend: green (bullish), red (bearish), gray (neutral)
Strength: more bars = stronger trend under the chosen normalization
Inputs (quick reference)
Display:
15 toggles: Show SMA 5 … Show SMA 4320
Strength Settings:
Strength normalization: None | Length | ATR% | Length+ATR%
Strength step (normalized units): sensitivity of bar count
Max bars: clamp for the bar count (default 10)
Normalization reference length: baseline for Length scaling (default 240)
ATR Length (for ATR%): ATR lookback used for ATR%
Text:
Label font size, Table font size
Line + label colors
Bullish (slope > 0): green
Bearish (slope < 0): red
Neutral (otherwise): gray
The MA lines, end-of-series labels, and table trend cell use the same colors
Recommended presets (examples)
Intraday (e.g., BTCUSD, 1h):
Strength normalization: Length+ATR%
normRefLen: 240
Strength step: 0.02–0.05
Max bars: 10
ATR Length: 14
Daily (e.g., AAPL, 1D):
Strength normalization: Length
normRefLen: 240–480
Strength step: 0.01–0.03
Max bars: 10
Calibration tips
Bars often at max (pegged)?
Increase Strength step (e.g., 0.01 → 0.03 → 0.05)
Or increase normRefLen (e.g., 240 → 480 → 720)
Bars too few?
Decrease Strength step (e.g., 0.02 → 0.01 → 0.005)
Or decrease normRefLen (e.g., 240 → 120)
Cross-timeframe comparability:
Prefer Length+ATR%; start with Strength step ≈ 0.02–0.05 and tune
Limitations
SMA only (no EMA/WMA/etc.)
Per-bar slope is inherently timeframe-sensitive; use ATR% or Length+ATR% for better cross-timeframe comparisons
ATR modes require atrLen bars; Strength shows blank until ready
The longest SMA (4320) needs sufficient chart history
Troubleshooting
Strength always looks maxed:
You might be on Length mode with a very small step; increase Strength step and/or use Length+ATR%; review normRefLen
Strength blank cells:
In ATR modes, wait for enough history (atrLen) or switch to Length mode
Table bounds:
The script manages rows internally; if you customize periods, ensure the total rows fit the 4×16 table
Compatibility
Pine Script v6
Works on most symbols/timeframes with adequate history
If you find this useful, consider leaving feedback with your preferred defaults (symbol/timeframe) so I can provide better presets.

Relative Strength Index Remastered [CHE]Relative Strength Index Remastered — Enhanced RSI with robust divergence detection using price-based pivots and line-of-sight validation to reduce false signals compared to the standard RSI indicator.
Summary
RSI Remastered builds on the classic Relative Strength Index by adding a more reliable divergence detection system that relies on price pivots rather than RSI pivots alone, incorporating a line-of-sight check to ensure the RSI path between points remains clear. This approach filters out many false divergences that occur in the original RSI indicator due to its volatile pivot detection on the RSI line itself. Users benefit from clearer reversal and continuation signals, especially in noisy markets, with optional hidden divergence support for trend confirmation. The core RSI calculation and smoothing options remain familiar, but the divergence logic provides materially fewer alerts while maintaining sensitivity.
Motivation: Why this design?
The standard RSI indicator often generates misleading divergence signals because it detects pivots directly on the RSI values, which can fluctuate erratically in volatile conditions, leading to frequent false positives that confuse traders during ranging or choppy price action. RSI Remastered addresses this by shifting pivot detection to the underlying price highs and lows, which are more stable, and adding a validation step that confirms the RSI line does not cross the direct path between pivot points. This design targets the real problem of over-signaling in the original, promoting more actionable insights without altering the RSI's core momentum measurement.
What’s different vs. standard approaches?
- Reference baseline: The classical TradingView RSI indicator, which uses simple RSI-based pivot detection for divergences.
- Architecture differences:
- Pivot identification on price extremes (highs and lows) instead of RSI values, extracting RSI levels at those points for comparison.
- Addition of a line-of-sight validation that checks the RSI path bar by bar between pivots to prevent signals where the line is interrupted.
- Inclusion of hidden divergence types alongside regular ones, using the same robust framework.
- Configurable drawing of connecting lines between validated pivot RSI points for visual clarity.
- Practical effect: Charts show fewer but higher-quality divergence markers and lines, reducing clutter from the original's frequent RSI pivot triggers; this matters for avoiding whipsaws in intraday trading, where the standard version might flag dozens of invalid setups per session.
Key Comparison Aspects
Aspect: Title/Shorttitle
Original RSI: "Relative Strength Index" / "RSI"
Robust Variant: "Relative Strength Index Remastered " / "RSI RM"
Aspect: Max. Lines/Labels
Original RSI: No specification (Standard: 50/50)
Robust Variant: max_lines_count=200, max_labels_count=200 (for more lines/markers in divergences)
Aspect: RSI Calculation & Plots
Original RSI: Identical: RSI with RMA, Plots (line, bands, gradient fills)
Robust Variant: Identical: RSI with RMA, Plots (line, bands, gradient fills)
Aspect: Smoothing (MA)
Original RSI: Identical: Inputs for MA types (SMA, EMA etc.), Bollinger Bands optional
Robust Variant: Identical: Inputs for MA types (SMA, EMA etc.), Bollinger Bands optional
Aspect: Divergence Activation
Original RSI: input.bool(false, "Calculate Divergence") (disabled by default)
Robust Variant: input.bool(true, "Calculate Divergence") (enabled by default, with tooltip)
Aspect: Pivot Calculation
Original RSI: Pivots on RSI (ta.pivotlow/high on RSI values)
Robust Variant: Pivots on price (ta.pivotlow/high on low/high), RSI values then extracted
Aspect: Lookback Values
Original RSI: Fixed: lookbackLeft=5, lookbackRight=5
Robust Variant: Input: L=5 (Pivot Left), R=5 (Pivot Right), adjustable (min=1, max=50)
Aspect: Range Between Pivots
Original RSI: Fixed: rangeUpper=60, rangeLower=5 (via _inRange function)
Robust Variant: Input: rangeUpper=60 (Max Bars), rangeLower=5 (Min Bars), adjustable (min=1–6, max=100–300)
Aspect: Divergence Types
Original RSI: Only Regular Bullish/Bearish: - Bull: Price LL + RSI HL - Bear: Price HH + RSI LH
Robust Variant: Regular + Hidden (optional via showHidden=true): - Regular Bull: Price LL + RSI HL - Regular Bear: Price HH + RSI LH - Hidden Bull: Price HL + RSI LL - Hidden Bear: Price LH + RSI HH
Aspect: Validation
Original RSI: No additional check (only pivot + range check)
Robust Variant: Line-of-Sight Check: RSI line must not cross the connecting line between pivots (line_clear function with slope calculation and loop for each bar in between)
Aspect: Signals (Plots/Shapes)
Original RSI: - Plot of pivot points (if divergence) - Shapes: "Bull"/"Bear" at RSI value, offset=-5
Robust Variant: - No pivot plots, instead shapes at RSI , offset=-R (adjustable) - Shapes: "Bull"/"Bear" (Regular), "HBull"/"HBear" (Hidden) - Colors: Lime/Red (Regular), Teal/Orange (Hidden)
Aspect: Line Drawing
Original RSI: No lines
Robust Variant: Optional (showLines=true): Lines between RSI pivots (thick for regular, dashed/thin for hidden), extend=none
Aspect: Alerts
Original RSI: Only Regular Bullish/Bearish (with pivot lookback reference)
Robust Variant: Regular Bullish/Bearish + Hidden Bullish/Bearish (specific "at latest pivot low/high")
Aspect: Robustness
Original RSI: Simple, prone to false signals (RSI pivots can be volatile)
Robust Variant: Higher: Price pivots are more stable, line-of-sight filters "broken" divergences, hidden support for trend continuations
Aspect: Code Length/Structure
Original RSI: ~100 lines, simple if-blocks for bull/bear
Robust Variant: ~150 lines, extended helper functions (e.g., inRange, line_clear), var group for inputs
How it works (technical)
The indicator first computes the core RSI value based on recent price changes, separating upward and downward movements over the specified length and smoothing them to derive a momentum reading scaled between zero and one hundred. This value is then plotted in a separate pane with fixed upper and lower reference lines at seventy and thirty, along with optional gradient fills to highlight overbought and oversold zones.
For smoothing, a moving average type is applied to the RSI if enabled, with an option to add bands around it based on the variability of recent RSI values scaled by a multiplier. Divergence detection activates on confirmed price pivots: lows for bullish checks and highs for bearish. At each new pivot, the system retrieves the bar index and values (price and RSI) for the current and prior pivot, ensuring they fall within a configurable bar range to avoid unrelated points.
Comparisons then assess whether the price has made a lower low (or higher high) while the RSI at those points moves in the opposite direction—higher for bullish regular, lower for bearish regular. For hidden types, the directions reverse to capture trend strength. The line-of-sight check calculates the straight path between the two RSI points and verifies that the actual RSI values in between stay entirely above (for bullish) or below (for bearish) that path, breaking the signal if any bar violates it. Valid signals trigger shapes at the RSI level of the new pivot and optional lines connecting the points. Initialization uses built-in functions to track prior occurrences, with states persisting across bars for accurate historical comparisons. No higher timeframe data is used, so confirmation occurs after the right pivot bars close, minimizing live-bar repaints.
Parameter Guide
Length — Controls the period for measuring price momentum changes — Default: 14 — Trade-offs/Tips: Shorter values increase responsiveness but add noise and more false signals; longer smooths trends but delays entries in fast markets.
Source — Selects the price input for RSI calculation — Default: Close — Trade-offs/Tips: Use high or low for volatility focus, but close works best for most assets; mismatches can skew overbought/oversold reads.
Calculate Divergence — Enables the enhanced divergence logic — Default: True — Trade-offs/Tips: Disable for pure RSI view to save computation; essential for signal reliability over the standard method.
Type (Smoothing) — Chooses the moving average applied to RSI — Default: SMA — Trade-offs/Tips: None for raw RSI; EMA for quicker adaptation, but SMA reduces whipsaws; Bollinger Bands option adds volatility context at cost of added lines.
Length (Smoothing) — Period for the smoothing average — Default: 14 — Trade-offs/Tips: Match RSI length for consistency; shorter boosts signal speed but amplifies noise in the smoothed line.
BB StdDev — Multiplier for band width around smoothed RSI — Default: 2.0 — Trade-offs/Tips: Lower narrows bands for tighter signals, risking more touches; higher widens for fewer but stronger breakouts.
Pivot Left — Bars to the left for confirming price pivots — Default: 5 — Trade-offs/Tips: Increase for stricter pivots in noisy data, reducing signals; too high delays confirmation excessively.
Pivot Right — Bars to the right for confirming price pivots — Default: 5 — Trade-offs/Tips: Balances with left for symmetry; longer right ensures maturity but shifts signals backward.
Max Bars Between Pivots — Upper limit on distance for valid pivot pairs — Default: 60 — Trade-offs/Tips: Tighten for short-term trades to focus recent action; widen for swing setups but risks unrelated comparisons.
Min Bars Between Pivots — Lower limit to avoid clustered pivots — Default: 5 — Trade-offs/Tips: Raise to filter micro-moves; too low invites overlapping signals like the original RSI.
Detect Hidden — Includes trend-continuation hidden types — Default: True — Trade-offs/Tips: Enable for full trend analysis; disable simplifies to reversals only, akin to basic RSI.
Draw Lines — Shows connecting lines between valid pivots — Default: True — Trade-offs/Tips: Turn off for cleaner charts; helps visually confirm line-of-sight in backtests.
Reading & Interpretation
The main RSI line oscillates between zero and one hundred, crossing above fifty suggesting building momentum and below indicating weakness; touches near seventy or thirty flag potential extremes. The optional smoothed line and bands provide a filtered view—price above the upper band on the RSI pane hints at overextension. Divergence shapes appear as upward labels for bullish (lime for regular, teal for hidden) and downward for bearish (red regular, orange hidden) at the pivot's RSI level, signaling a mismatch only after validation. Connecting lines, if drawn, slope between points without RSI interference, their color matching the shape type; a dashed style denotes hidden. Fewer shapes overall compared to the standard RSI mean higher conviction, but always confirm with price structure.
Practical Workflows & Combinations
- Trend following: Enter longs on regular bullish shapes near support with higher highs in price; filter hidden bullish for pullback buys in uptrends, pairing with a rising smoothed RSI above fifty.
- Exits/Stops: Use bearish regular as reversal warnings to tighten stops; hidden bearish in downtrends confirms continuation—exit if lines show RSI crossing the path.
- Multi-asset/Multi-TF: Defaults suit forex and stocks on one-hour charts; for crypto volatility, widen pivot ranges to ten; scale min/max bars proportionally on daily for swings, avoiding the original's intraday spam.
Behavior, Constraints & Performance
Signals confirm only after the right pivot bars close, so live bars may show tentative pivots that vanish on close, unlike the standard RSI's immediate RSI-pivot triggers—plan for this delay in automation. No higher timeframe calls, so no security-related repaints. Resources include up to two hundred lines and labels for dense charts, with a loop in validation scanning up to three hundred bars between pivots, which is efficient but could slow on very long histories. Known limits: Slight lag at pivot confirmation in trending markets; volatile RSI might rarely miss fine path violations; not ideal for gap-heavy assets where pivots skip.
Sensible Defaults & Quick Tuning
Start with defaults for balanced momentum and divergence on most timeframes. For too many signals (like the original), raise pivot left/right to eight and min bars to ten to filter noise. If sluggish in trends, shorten RSI length to nine and enable EMA smoothing for faster adaptation. In high-volatility assets, widen max bars to one hundred but disable hidden to focus essentials. For clean reversal hunts, set smoothing to none and lines on.
What this indicator is—and isn’t
RSI Remastered serves as a refined momentum and divergence visualization tool, enhancing the standard RSI for better signal quality in technical analysis setups. It is not a standalone trading system, nor does it predict price moves—pair it with volume, structure breaks, and risk rules for decisions. Use alongside position sizing and broader context, not in isolation.
Disclaimer
The content provided, including all code and materials, is strictly for educational and informational purposes only. It is not intended as, and should not be interpreted as, financial advice, a recommendation to buy or sell any financial instrument, or an offer of any financial product or service. All strategies, tools, and examples discussed are provided for illustrative purposes to demonstrate coding techniques and the functionality of Pine Script within a trading context.
Any results from strategies or tools provided are hypothetical, and past performance is not indicative of future results. Trading and investing involve high risk, including the potential loss of principal, and may not be suitable for all individuals. Before making any trading decisions, please consult with a qualified financial professional to understand the risks involved.
By using this script, you acknowledge and agree that any trading decisions are made solely at your discretion and risk.
Do not use this indicator on Heikin-Ashi, Renko, Kagi, Point-and-Figure, or Range charts, as these chart types can produce unrealistic results for signal markers and alerts.
Best regards and happy trading
Chervolino

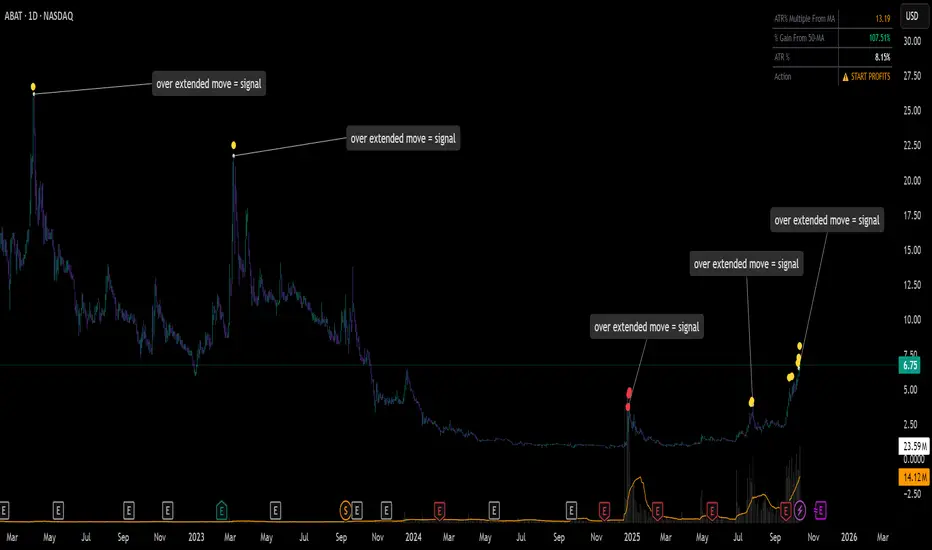
ATR% Multiple From MA - Overextensions trackingATR% Multiple From MA - Quantifiable Profit Taking Indicator
This overlay indicator identifies overextended price moves by calculating how many ATR% multiples price is away from a moving average, providing objective profit-taking signals.
Formula:
A = ATR% = (ATR / Price) × 100
B = % Gain from MA = ((Price - MA) / MA) × 100
ATR% Multiple = B / A
Signals:
Yellow circle at 7x: Start scaling out partial profits
Red circle at 10x+: Heavily overextended, aggressive profit taking recommended
Stats table: Real-time ATR% Multiple, % Gain from MA, ATR%, and action status
For very volatile markets I usually go for 10x and 15x extension instead of 7x and 10x.
This method normalizes moves across different volatility environments, eliminating emotional decision-making. Historical examples include PLTR, SOFI, TSLA, NVDA which stalled after exceeding 10x.
Customizable Settings:
ATR Length (default: 14)
MA Length (default: 50)
Profit Zone thresholds (7x, 10x)
Toggle circles and MA display
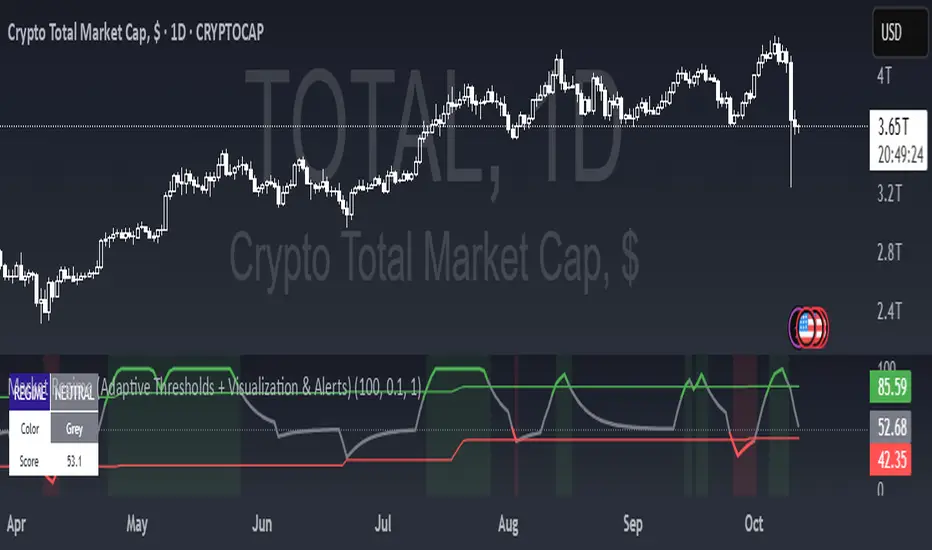
Market Regime (w/ Adaptive Thresholds)Logic Behind This Indicator
This indicator identifies market regimes (trending vs. mean-reverting) using adaptive thresholds that adjust to recent market conditions.
Core Components
1. Regime Score Calculation (0-100 scale)
Starts at 50 (neutral) and adjusts based on two factors:
A. Trend Strength
Compares fast EMA (5) vs. slow EMA (10)
If fast > slow by >1% → +60 points (strong uptrend)
If fast < slow by >1% → -60 points (strong downtrend)
B. RSI Momentum
Uses 7-period RSI smoothed with 3-period EMA
RSI > 70 → +20 points (overbought/trending)
RSI < 30 → -20 points (oversold/mean-reverting)
The score is then smoothed and clamped between 0-100.
2. Adaptive Thresholds
Instead of fixed levels, thresholds adjust to recent market behavior:
Looks back 100 bars to find the min/max regime score
High threshold = 80% of the range (trending regime)
Low threshold = 20% of the range (mean-reverting regime)
This prevents false signals in different volatility environments.
3. Regime Classification
Regime Score Classification Meaning
Above high threshold STRONG TREND Market is trending strongly (follow momentum)
Below low threshold STRONG MEAN REVERSION Market is choppy/oversold (fade moves)
Between thresholds NEUTRAL No clear regime (stay out or wait)
4. Regime Persistence Filter
Requires the regime to hold for a minimum number of bars (default: 1) before confirming
Prevents whipsaws from brief score fluctuations
What It Aims to Detect
When to use trend-following strategies (green = buy breakouts, ride momentum)
When to use mean-reversion strategies (red = buy dips, sell rallies)
When to stay out (gray = unclear conditions, high risk of false signals)
Visual Cues
Green background = Strong trend (momentum strategies work)
Red background = Strong mean reversion (contrarian strategies work)
Table = Shows current regime, color, and score
Alerts = Notifies when regime changes
Digital RPM HUD — 4 Feeds + Confidence + Timeline (v3)🏎️ Digital RPM HUD — 4 Feeds + Confidence + Timeline (v3)
A performance-style trading dashboard for momentum-driven traders.
The Digital RPM HUD gives you an instant visual readout of market “engine speed” — combining four customizable data feeds (Trend, Momentum, Volume, Volatility) into a single confidence score (0–100) and a color-coded timeline of regime changes.
Think of it as a racing-inspired control panel: you only “hit the throttle” when confidence is high and all systems agree.
🔧 Key Features
4 Data Feeds – assign your own logic (EMA, RSI, RVOL, ATR, etc.).
Confidence Meter – blends the four feeds into one smooth 0–100 reading.
Timeline Strip – shows recent bullish / bearish / neutral states at a glance.
Visual Trade Cues – optional on-chart LONG / SHORT / EXIT markers.
Fully Customizable – thresholds, weights, smoothing, colors, layout.
HUD Overlay – clean, minimal, and adjustable to any corner of your chart.
💡 How to Use
Configure each feed to reflect your preferred signals (e.g., trend EMA 200, momentum RSI 14, volume RVOL 20, volatility ATR 14).
Watch the Confidence gauge:
✅ Above Bull Threshold → Market acceleration / long bias.
❌ Below Bear Threshold → Momentum loss / short bias.
⚪ Between thresholds → Neutral zone; stay patient.
Use the Timeline to confirm trend consistency — more green = bullish regime, more red = bearish.
⚙️ Recommended Setups
Scalping: Trend EMA 50 + RSI 7 + RVOL 10 + ATR 7 → Fast response.
Intraday: EMA 200 + RSI 14 + RVOL 20 + ATR 14 → Balanced signal.
Swing: Multi-TF Trend + MACD + RVOL + ATR → Smooth and steady.
⚠️ Disclaimer
This script is not a trading strategy and does not execute trades.
All signals are visual aids — always confirm with your own analysis and risk management.

Stop Hunt Candlesticks (Liquidity Wicks)🕯️ Stop Hunt Candlesticks
Wick Highlighter – Spot Extreme Wicks Instantly
This indicator highlights candles where the upper or lower wick exceeds a customizable percentage of the asset’s price — perfect for quickly spotting strong rejections, liquidity grabs, stop hunts or exhaustion moves.
💡 Key Features
Visual Background Highlight: Automatically colors the chart background when a wick surpasses your defined % threshold (default 1%).
Customizable Threshold: Adjust wick sensitivity to suit different assets or timeframes.
Upper & Lower Wick Filters: Choose whether to track upper wicks, lower wicks, or both.
Dynamic Price Basis: Compare wick size relative to Close, Open, HL2, or OC2.
Optional Labels: Display the exact wick percentage directly on the chart.
Alerts Ready: Get notified whenever a candle shows an extreme wick condition.
⚙️ How It Works
The script measures each candle’s wick size relative to your chosen price basis:
Upper wick % = (High − max(Open, Close)) / Basis × 100
Lower wick % = (min(Open, Close) − Low) / Basis × 100
If the result exceeds your chosen threshold, the chart background changes color.
Red for upper wicks, green for lower wicks by default.
🎯 Use Cases
Identify strong rejections or stop hunts near key levels.
Confirm price exhaustion or potential reversals.
Filter fake breakouts or high-volatility events.
🧩 Customization
Tweak colors, transparency, and label visibility to fit seamlessly into your chart setup.

Multiple Smoothed Moving AveragesMultiple Smoothed Moving Averages (SMMAs)
This indicator displays up to 5 Smoothed Moving Averages (SMMAs) on your chart, providing a comprehensive view of multiple trend timeframes simultaneously.
═══════════════════════════════════════
WHAT IS A SMOOTHED MOVING AVERAGE?
═══════════════════════════════════════
The Smoothed Moving Average (SMMA), also known as the Running Moving Average (RMA), is a type of moving average that provides more smoothing than a Simple Moving Average (SMA).
Unlike SMA which gives equal weight to all values in the period, SMMA uses a recursive formula that gives more weight to previous SMMA values, resulting in:
- Smoother price action with less noise
- Slower response to recent price changes
- Better identification of longer-term trends
- Reduced false signals in choppy markets
CALCULATION METHOD:
- First value: Simple Moving Average of the initial period
- Subsequent values: (Previous SMMA × (Length - 1) + Current Price) / Length
This recursive nature makes SMMA particularly effective for identifying sustained trends while filtering out short-term volatility.
═══════════════════════════════════════
FEATURES
═══════════════════════════════════════
✓ 5 Independent SMMAs: Each with its own configurable period length
✓ Individual Toggles: Show/hide each SMMA independently
✓ Distinct Colors: Easy visual identification of each moving average
✓ Customizable Lengths: Adjust each period to match your trading strategy
✓ Shared Source: All SMMAs calculate from the same price source (default: close)
✓ Overlay Display: Plots directly on the price chart
═══════════════════════════════════════
DEFAULT SETTINGS
═══════════════════════════════════════
- SMMA 1: 30 periods (Blue)
- SMMA 2: 50 periods (Orange)
- SMMA 3: 100 periods (Green)
- SMMA 4: 200 periods (Purple)
- SMMA 5: 300 periods (Red)
All SMMAs are enabled by default.
═══════════════════════════════════════
HOW TO USE
═══════════════════════════════════════
TREND IDENTIFICATION:
- Price above all SMMAs = Strong uptrend
- Price below all SMMAs = Strong downtrend
- Price between SMMAs = Transitional phase or consolidation
SUPPORT & RESISTANCE:
- SMMAs often act as dynamic support in uptrends
- SMMAs often act as dynamic resistance in downtrends
- Longer-period SMMAs (200, 300) provide stronger S/R levels
CROSSOVER SIGNALS:
- Faster SMMA crossing above slower SMMA = Bullish signal
- Faster SMMA crossing below slower SMMA = Bearish signal
MULTIPLE TIMEFRAME ANALYSIS:
- Short-term trends: 30, 50 periods
- Medium-term trends: 100 periods
- Long-term trends: 200, 300 periods
═══════════════════════════════════════
CUSTOMIZATION
═══════════════════════════════════════
INPUTS TAB:
- Adjust each SMMA length to suit your trading timeframe
- Toggle individual SMMAs on/off using checkboxes
- Change the source (close, open, high, low, hl2, hlc3, ohlc4)
STYLE TAB:
- Modify line colors for each SMMA
- Adjust line thickness and style
- Change transparency levels
═══════════════════════════════════════
NOTES
═══════════════════════════════════════
- This indicator uses the mathematically correct SMMA calculation with the recursive formula
- All calculations are performed on every bar to ensure data consistency
- SMMAs respond more slowly than EMAs but faster than WMAs to price changes
- Best used in combination with other technical analysis tools
- Use on any timeframe
═══════════════════════════════════════
Perfect for traders who want a clear, multi-timeframe view of market trends using the smooth, reliable SMMA calculation method.

TradeScope: MA Reversion • RVOL • Trendlines • GAPs • TableTradeScope is an all-in-one technical analysis suite that brings together price action, momentum, volume dynamics, and trend structure into one cohesive and fully customizable indicator.
An advanced, modular trading suite that combines moving averages, reversion signals, RSI/CCI momentum, relative volume, gap detection, trendline analysis, and dynamic tables — all within one powerful dashboard.
Perfect for swing traders, intraday traders, and analysts who want to read price strength, volume context, and market structure in real time.
⚙️ Core Components & Inputs
🧮 Moving Average Settings
Moving Average Type & Length:
Choose between SMA or EMA and set your preferred period for smoother or more reactive trend tracking.
Multi-MA Plotting:
Up to 8 customizable moving averages (each with independent type, color, and length).
Includes a “window filter” to show only the last X bars, reducing chart clutter.
MA Reversion Engine:
Detects when price has extended too far from its moving average.
Reversion Lookback: Number of bars analyzed to determine historical extremes.
Reversion Threshold: Sensitivity multiplier—lower = more frequent signals, higher = stricter triggers.
🔄 Trend Settings
Short-Term & Long-Term Trend Lookbacks:
Uses linear regression to detect the slope and direction of the short- and long-term trend.
Results are displayed in the live table with color-coded bias:
🟩 Bullish | 🟥 Bearish
📈 Momentum Indicators
RSI (Relative Strength Index):
Adjustable period; displays the current RSI value, overbought (>70) / oversold (<30) zones, and trending direction.
CCI (Commodity Channel Index):
Customizable length with color-coded bias:
🟩 Oversold (< -100), 🟥 Overbought (> 100).
Tooltip shows whether the CCI is trending up or down.
📊 Volume Analysis
Relative Volume (RVOL):
Estimates end-of-day projected volume using intraday progress and compares it against the 20-day average.
Displays whether today’s volume is expected to exceed yesterday’s, and highlights color by strength.
Volume Trend (Short & Long Lookbacks):
Visual cues for whether current volume is above or below short-term and long-term averages.
Estimated Full-Day Volume & Multiplier:
Converts raw volume into “X” multiples (e.g., 2.3X average) for quick interpretation.
🕳️ Gap Detection
Automatically identifies and plots bullish and bearish price gaps within a defined lookback period.
Gap Lookback: Defines how far back to search for gaps.
Gap Line Width / Visibility: Controls the thickness and display of gap lines on chart.
Displays the closest open gap in the live table, including its distance from current price (%).
🔍 ATR & Volatility
14-day ATR (% of price):
Automatically converts the Average True Range into a percent, providing quick volatility context:
🟩 Low (<3%) | 🟨 Moderate (3–5%) | 🟥 High (>5%)
💬 Candlestick Pattern Recognition
Auto-detects popular reversal and continuation patterns such as:
Bullish/Bearish Engulfing
Hammer / Hanging Man
Shooting Star / Inverted Hammer
Doji / Harami / Kicking / Marubozu / Morning Star
Each pattern is shown with contextual color coding in the table.
🧱 Pivot Points & Support/Resistance
Optional Pivot High / Pivot Low Labels
Adjustable left/right bar lengths for pivot detection
Theme-aware text and label color options
Automatically drawn diagonal trendlines for both support and resistance
Adjustable line style, color, and thickness
Detects and tracks touches for reliability
Includes breakout alerts (with optional volume confirmation)
🚨 Alerts
MA Cross Alerts:
Triggers when price crosses the fast or slow moving average within a tolerance band (default ±0.3%).
Diagonal Breakout Alerts:
Detects and alerts when price breaks diagonal trendlines.
Volume-Confirmed Alerts:
Filters breakouts where volume exceeds 1.5× the 20-bar average.
🧾 Live Market Table
A fully dynamic table displayed on-chart, customizable via input toggles:
Choose which rows to show (e.g., RSI, ATR, RVOL, Gaps, CCI, Trend, MA info, Diff, Low→Close%).
Choose table position (top-right, bottom-left, etc.) and text size.
Theme selection: Light or Dark
Conditional background colors for instant visual interpretation:
🟩 Bullish or Oversold
🟥 Bearish or Overbought
🟨 Neutral / Moderate
🎯 Practical Uses
✅ Identify confluence setups combining MA reversion, volume expansion, and RSI/CCI extremes.
✅ Track trend bias and gap proximity directly in your dashboard.
✅ Monitor relative volume behavior for intraday strength confirmation.
✅ Automate MA cross or breakout alerts to stay ahead of key price action.
🧠 Ideal For
Swing traders seeking confluence-based setups
Intraday traders monitoring multi-factor bias
Analysts looking for compact market health dashboards
💡 Summary
TradeScope is designed as a single-pane-of-glass market view — combining momentum, trend, volume, structure, and reversion into one clear visual system.
Fully customizable. Fully dynamic.
Use it to see what others miss — clarity, confluence, and confidence in every trade.

🐬RSI_CandleRSI_Candle
Calculates the RSI based on the open, high, low, and close prices, and displays it in the form of candles.
The overbought and oversold zones are highlighted with background colors, which become darker as the RSI value approaches 100 or 0.
-----
RSI_Candle
RSI를 시가, 고가, 저가, 종가로 계산하여 캔들로 보여줍니다.
과매수/과매도 구간에서 배경색으로 보여주며, 100/0에 가까울수록 배경색이 짙어집니다.
-----
