CryptoGraph MA DivergenceCryptoGraph MA Divergence is a multifunctional trading tool that identifies aspects of trend trading.
The indicator is based on moving averages, transformed into an oscillator. This way it becomes possible to get a better visualisation of MA's relative to each other, and more importantly, it enables us to spot divergences based on MA's.
This simply yet effective enhancement wasn't seen before as an oscillator, so I decided to make and share it.
Features of the indicator:
- Blue/Purple wave (Based on Moving Averages)
- White line (Average of Blue/Purple Wave)
- Green/Red Dots (Trend reversals)
- Red/Green lines (Wider red and green lines are regular divergences, thinner red and green lines are hidden divergences)
What to look for?
- A red or green dot may be a very early indication of a trend reversal, in times of consolidation they cluster together. Use other CryptoGraph indicators to filter these dot clusters.
- Blue/Purple wave crossing 0 line.
- Divergences. Divergences are automatically spotted in the indicator. HOWEVER, always try to find them manually, since the indicator won't be able to spot them all automatically.
For access contact me through TradingView or Discord.
Signals

NEXT Stochastic 3xVW (Triple Volume Weighted)Overview:
This responsive version of the Stochastic oscillator modifies and extends the original to incorporate volume. It does so on 2 levels: by using Volume-Weighted Moving Average (VWMA) as input and applying a triple volume weighting filter within the internal algorithm, intelligently blending volume with what is otherwise pure momentum/distribution analysis. The result is more binary-like curve behavior (%K and %D oscillator lines), whose polarizing movement acts as both a signal and filter.
Below is a screenshot comparing NEXT Stochastic 3xVW with default settings to the original Stochastic oscillator on NQ M1 chart.
Application and Strategy Ideas:
NEXT Stochastic 3xVW is intended to be used like the original Stochastic oscillator within the context of technical analysis: identifying overvalued (above upper limit) and undervalued (below lower limit) price action, as well as establishing a bias baseline (bullish if over 50; bearish if under 50). Higher NEXT Stochastic 3xVW bottoms compared to lower price bottoms signify bullish divergence; lower NEXT Stochastic 3xVW tops compared to higher price tops signify bearish divergence. Trading %K/%D line crossing is also a popular strategy, with %K crossing over %D indicating bullish sentiment and %K crossing under %D indicating bearish sentiment.
Below is a screenshot showing NEXT Stochastic 3xVW overbought/oversold intraday strategy on SPY M1 chart. NEXT Stochastic 3xVW is set to 5,10,1,3 with long signal issued at lower limit of 30 and short at upper limit of 70.
Input Parameters:
VWMA Length - controls the averaging length of the volume-weighted moving average (based on close price and volume); used as Stochastic input
%K Length - volume-driven averaging length of the %K oscillator line - this is the faster of the two Stochastic lines
%K Smoothing - volume-driven smoothing factor of the %K line
%D Smoothing - volume-driven averaging length of the %D oscillator line (a %K derivative, post smoothing) - this is the slower of the two Stochastic lines
Upper Limit - the NEXT Stochastic 3xVW level above which market is considered overbought, default is 80
Base Bias - the NEXT Stochastic 3xVW level above which market bias is considered bullish, and below bearish
Lower Limit - the NEXT Stochastic 3xVW level below which market is considered oversold, default is 20
Signals and Alerts:
Discover and visualize NEXT Stochastic 3xVW strategies using the companion NEXT Strategy Visualizer indicator. While the %K/%D cross alerts can be set via NEXT Stochastic 3xVW indicator, the Strategy Visualizer will only plot long/short signals when %K or %D cross over or under overbought/oversold levels (as hown in the above SPY M1 screenshot). That being said, the next version of the Strategy Visualizer will also support %K/%D crosses.
Here is how to set NEXT Stochastic 3xVW %K/%D crossing alerts: open a chart, attach NEXT Stochastic 3xVW, and right-click on chart -> Add Alert. Condition: Next Stochastic >> %K >> Crossing >> Next Stochastic >> %D

M.Right Bulls-V-Bears -Tug-of-War- SquidGame Themed(cc)Hello Traders,
I've decided to finally release an indicator I've spent several hours working to get just right and as far as I know, there isn’t one as accurate. And.... decided to add a little Squid Game theme to it just for fun.
……"The game is Tug of War, the side that pulls the rope from the middle to their side wins. Let the game begin."……
This indicator is not a typical one.
1) It shows visually when Bull volume or Bear volume is ‘pulling the rope to their side’.
2) It uses several different formulas to get an accurate read on the level of volume, but still keeps peaks and troughs within 100 for easy reading.
3) Update: It was originally meant to be used strictly with other indicators, but it can now be used as a standalone indicator.
Legend:
1) The top line signals give the major signals –
a. Red cross = Bearish volume strength and continuation.
b. Green cross = Bullish volume strength and continuation.
i. + Green Dot inside enhances signal.
ii. + Red Dot inside weakens signal.
c. Blue circle = Can indicate the beginning of a reversal to the upside or downside.
d. Pink circle = Can indicate the beginning of a reversal to the downside.
2) The Bottom signals are triggered when one circle-rope crosses over the other, these signals give confirmation to the top line signals – Red bearish / Green bullish.
3) As shown on the chart, the Reversal setup usually consists of a blue circle, followed by a red or green cross, then confirmation from the bottom signal.
4) Without the signals: green obviously is Bullish especially above the threshold set --Red bearish. The regular rope gives trend indication.
I've added tooltips to make it easy to understand, feel free to leave a comment if you still have a question!
Features:
-Tooltips (hover over - Info) for understanding.
-Works well on all timeframes; even 5min, I made a tooltip for recommended lengths.
-Customizable Signals; with the ability to turn on and off.
-Reversal signals: Pink and Blue circles can indicate reversals coming.
-Works well as a leading standalone indicator.
-Adjustable top signal row.
-Highlight background.
-Alerts
-Rules added (hover over).
Cheers,
Mike

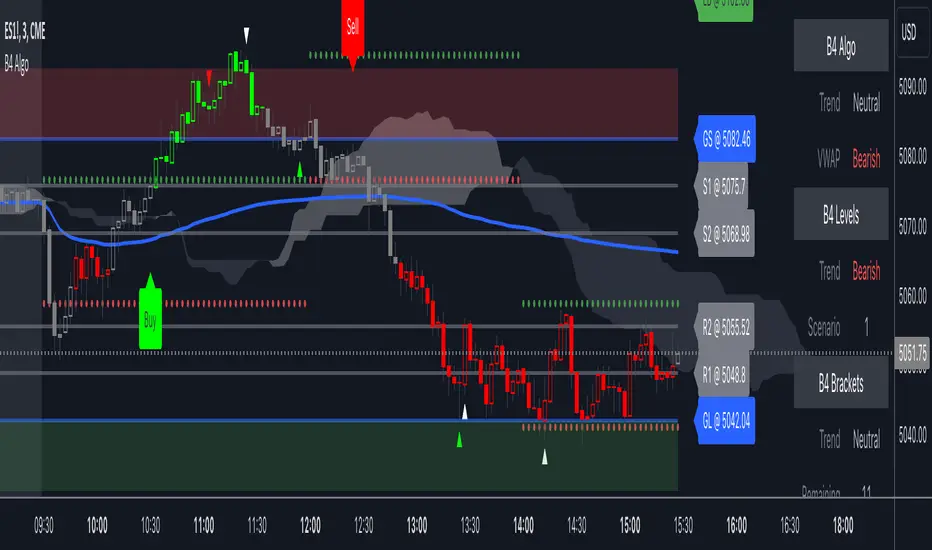
B4Signals Algo PremiumB4Signals Algo indicator is made up of more than 7+ innovative indicators carefully designed to generate high probability buy and sell signals while reducing risk. It derives its entries and exits from the B4Signals Indicator with added trend detection and volatility containment.
B4Signals Algo indicator detects the direction of trends for any asset and on any timeframe allowing traders to increase their confidence in positions, follow trends and stay in positions longer. Profit taking is up to the trader.
B4Signals Algo features:
Automatically generated buy and sell signals
Algo model selection in settings
Algo sensitivity selection in settings
Background chart shading for market hours
B4Signals Algo has two modes to choose from; each with an aggressive and a conservative approach to trading:
Algo 1 - Aggressive = Aims to detect very early trends, and is thus more reactive. Developed to catch both short term and long term trend reversal and provide clarity in the current trend direction. This setting attempts to make it easier to come in early in a new trend as well as to stay longer in that trend.
Algo 1 - Conservative = Aims to detect trend continuation where the stock price is likely to keep its current trend.
Algo 2 - Aggressive = Aims to detect very early confirmed trends, and is thus more reactive. Developed to catch both confirmed short term and confirmed long term trend reversals and provide confirmation in the current trend direction.
Algo 2 - Conservative = Aims to detect very early confirmed trends in conjunction with a filter to keep out false or choppy signals to leave the most accurate ones.
Disclaimer
Copyright by B4Signals.
The information contained in our scripts/indicators/ideas does not constitute financial advice or a solicitation to buy or sell any securities of any type. We will not accept liability for any loss or damage, including without limitation any loss of profit, which may arise directly or indirectly from the use of or reliance on such information.
All investments involve risk, and the past performance of a security, industry, sector, market, financial product, trading strategy, or individual’s trading does not guarantee future results or returns. Investors are fully responsible for any investment decisions they make. Such decisions should be based solely on an evaluation of their financial circumstances, investment objectives, risk tolerance, and liquidity needs.
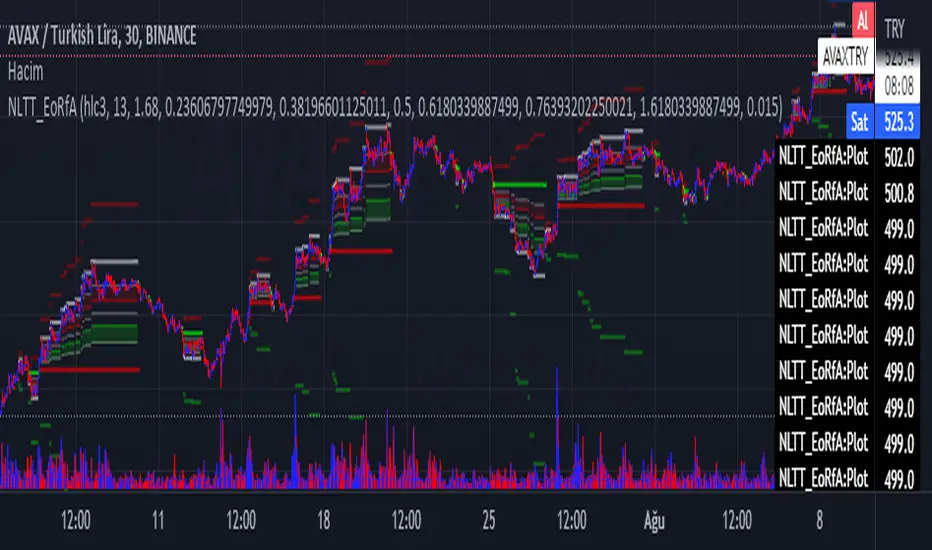
No-lose trading targets (Based on EoRfA) By Mustafa ÖZVERThis code shows expected reaction target prices after sudden moving based on (EoRfA) Escaping of Rate from Avarage. Red area means the price is on overbought area, green area means the price is on oversold area. If you see red area under price, you can make short option to next to the horizontal beginning price of red area. If you see green area over price, you can make long option to next to the horizontal beginning price of green area.
When this code works
- The green area starts where EoRfA value is on oversold
- The red area starts where EoRfA value is on overbought
Of course, this code may be failed, do not forget the target may never come. But hopefully price will cross over the target.
And you (as developers) can develop this code by using anything instead of EoRfA to get up-down target prices.
But only this values can not guarantee good results for trading. BE CAREFUL
Zendog LONG DCA Trigger RSI+StochRSIThis is a script that generates a BUY signal by combining RSI and Stochastic RSI into the same script and that can easily be integrated into an external Backtester like the one I published.
The script uses default values for RSI and Stochastic RSI oversold conditions.
They should be adjusted for specific assets and timeframes so they better match the current trend. Please beware you might overfit settings to match a short timeframe trend (like a few days or hours). If this is the case once the trend changes the signals will not be accurate.
The purpose of this script is to provide some pine code that can be used to further combine multiple indicators into a LONG Deal Start signal.
Integration with the Zendog Backtster:
- add the backtester on the chart
- add this script on the chart
- in the Zendog backtester Deal start type select "External indicator"
- in the Zendog backtester Indicator source and value select "Zendog LONG DCA Trigger RSI+StochRSI: SIGNAL"

MultiToolBox [Forte64]MultiToolBox is designed to be an easy to use multi-functional tool hence the name. It was built to eliminate the need for multiple indicators so users with Basic profiles can have one single indicator that’s effective and versatile enough for decision making. It can be used to supplement a user’s existing setup and to confirm or not confirm a decision particularly when there’s an alignment or none thereof.
VERSATILITY AND MULTIPLE TOOLS
MultiToolBox has several trading tools and strategies built into it. First and most evident, it has multiple Moving Average systems built into it. There are six (6) different MAs grouped into two sets. Each set can be independently set to SMA, EMA, WMA, RMA, VWMA or HMA. Users have the option of setting the length of each of the 6 MAs separately.
ELIMINATING TUNNEL VISION
Secondly, MultiToolBox can help eliminate Tunnel Vision to an extent. It incorporates Multi-Time frame Analysis so users, particularly new traders, can make decisions based on inbuilt settings (setting 1 or setting 2) that function on different time-frames without presenting the user with an overload of time-frame settings.
BULLISH OR BEARISH BACKGROUND
Thirdly, MultiToolBox has bullish or bearish setup information presented as background colors i.e. GREEN for bullish setup and RED for bearish setups. These color presentations on the chart may change depending on the selected setting (1 or 2).
Other features are:
BAR COLORS
Yellow represents a potential top and Purple represents a potential bottom. These vary on chart depending on selected setting 1 or 2.
White and Black colored bars work similarly as yellow and purple respectively. White and black are however the extremes of yellow and purple.
Please note that Purple and yellow need to be turned off before white and black bars can be visible.
TRIANGLES
Blue triangle (below bar and pointing up) shows an alignment for a possible buy/long opportunity.
Red triangle (above bar and pointing down) shows an alignment for a possible sell/short opportunity.
Green (bullish) and Yellow (bearish) double triangles work similarly as Blue and Red triangles above.
POTENTIAL TRADE ENTRIES
An alignment of Blue and Green triangles indicates a potentially strong opportunity for buy/long trade entry.
An alignment of Red and Yellow triangles indicates a potentially potent opportunity for buy/long trade entry.
MultiToolBox can be applied to any Price chart regardless of market or instrument and works on all commonly used time frames (1m, 5m, 10m, 15m, 1H, 4H, 1D, 1W and 1M) as well as some other less common ones.
Development/improvement is a continuous thing!
Disclaimer:
Past performance does not guarantee future results. This tool/indicator is for educational purposes. As always you should fully understand there are high risks involved when trading cryptocurrencies and other digital instruments.

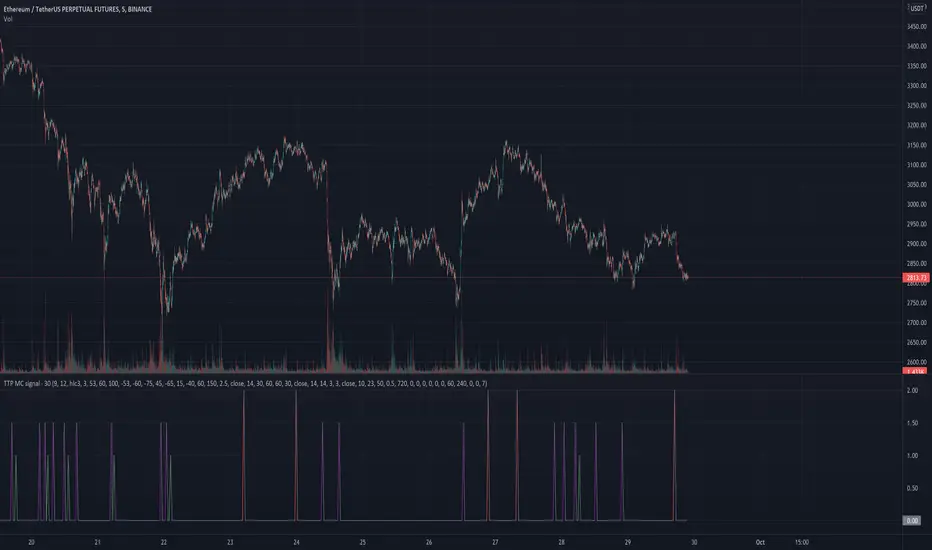
TTP MC signalThis signal is based on Market Cipher.
It triggers a 1 for a buy the divergence signal which is less frequent and more conservative.
It triggers a 1.5 for the normal signal which is more frequent and more risky.
It triggers a 2 for a sell signal which is also using a divergence.
You can use this values to backtest.
It contains alerts for each of the separated signals.
Bollinger Bands with Customizable Expansion DetectorJapanese below / 日本語説明は下記
Bollinger bands with customizable expansion signals
What’s new in this indicator?
This indicator allows users to customize Bollinger bands expansion signal with the conditions below.
1. Target bands
Which bands should be considered as expansion when price crossing?
Available options are plus/minus 1-3 σ.
2. Price
Which price should be considered as bands breakout
Available options are high, low and close
3. Band width increment(volatility)
When band width is N times wider than previous bar. N = ?
This parameter is regarded as volatility expansion, measuring how much band width gets wider than previous bar.
Band width is distance between each band and middle line(SMA).
Expansion signals are displayed when 1, 2 and 3 are all met.
For example, if you select parameters as follows, expansion signals are appeared when;
Bullish expansion:
When prices(highs) cross over plus 2 σ band with band width of the current candle is 1.15 times wider than previous bar.
Bearish expansion:
When prices(lows) cross under minus 2 σ band with band width of the current candle is 1.15 times wider than previous bar.
Selected parameters(Example)
1. 2σ
2. High/low
3. 1.15
Alert can be set when conditions above are met.
You can customize them to be best fit for you!
————————————————————
エクスパンションの発生条件をユーザが独自にカスタマイズし、シグナル表示できるボリンジャーバンドです。
以下の3つの要素を組み合わせることでユーザ独自のエクスパンションシグナルをカスタマイズすることができます。
1. 対象バンド
どのバンドをブレイクした時にエクスパンションの条件の一つとするかを選択
選択可能オプションはプラスマイナス1-3シグマ
2. 価格
どの価格でバンドをブレイクした時にエクスパンションとみなすかを選択
上方ブレイクは高値·終値から、下方ブレイクは安値·終値から選択可能
3. バンドの広がり(ボラティリティ)
現在ローソク足のバンド幅が一つ前のローソク足のバンド幅のN倍の時、エクスパンションとみなすための数値
Nは0.1-10の間で設定可能
バンド幅は各バンドとミドルライン(SMA)の距離です。
エクスパンションのシグナルは上記1-3全てを満たした時に表示されます。
例: 以下のようにパラメーター設定した場合、エクスパンションシグナルは下記の時に表示されます。
選択パラメーター(例)
1. 2σ
2. High/low
3. 1.15
上方エクスパンション:
高値がプラス2シグマバンドを上に抜き、かつ現在ローソク足のバンド幅が一つ前のローソク足のバンド幅の1.15倍を超える場合
下方エクスパンション:
安値がマイナス2シグマバンドを下に抜き、かつ現在ローソク足のバンド幅が一つ前のローソク足のバンド幅の1.15倍を超える場合
上記条件が揃った場合のアラート設定も可能です。

Fx Crusher Scalping Indicator V1█ OVERVIEW
Scalping Indicator with Buy and Sell Signals for the 15 min and 5 min Chart. Works on all assets (Crypto, Forex, Stocks, Indices, Commodities and Metals)
Only use in trending markets. Signals in a ranging market are useless.
This Scalping Indicator is different from others because most of the Buy/ Sell signals actually make sense. No counter trend trading and most signals can be very profitable when used right.The single most important goal was to have an indicator that shows signals with a big possible risk reward ratio. Most false signals are filtered out. The Fx Crusher Scalping Indicator is not perfect but it is amazing. You can customize the indicator to get the highest signal quality.
█ HOW DOES IT WORK?
The indicator determines the trend direction by using 3 different smoothed moving averages. A green background shows an uptrend and a red background shows a downtrend.
The strength of the trend is determined by the slope of the individual SMMAs. You can set the slope of every single SMMA for buys and sells individually.
The indicator only shows signals when there is a clear trend on the current timeframe.
Entry signals are generated by a combination of Williams fractals, SMMA crossover, trend angle and RSI condition.
█ HOW TO USE?
Draw Support & Resistance lines on the 4H Chart
Determine the overall trend on the 1H Timeframe
Go to the 15 min or 5 min Time Frame and have a look at the signals
Adjust the slope of every single SMMA in 0.01 steps until the signals look good
Adjust the RSI settings for overbought and oversold condition if necessary
Only enter a trade after the candle that prints a signal is closed.
Only take buy positions when all SMMAs are going up and don’t touch each other
Only take sell positions when all SMMAs are going down and don’t touch each other
Only use this Scalping Indicator with proper Risk management and a risk reward ratio of around 1:2.
Trail your stop to get the most pips out of the signals. Very often the indicator shows signals right before major moves.
█ ADDITIONAL INFO
Be careful with buy signals when the market on the higher timeframe (4H and 1H) is in a downtrend and vice versa.
You can make the most profit out of this Indicator when you enter with 2 positions. A quick scalp and a runner. Because there's a lot of signals with huge risk reward ratios but also some unprofitable signals . Therefore make sure you make the best out of the good signals and apply proper risk management to limit losses with bad signals. Stop loss placement according to market structure.
Multiple Signals in a row can show a high probability of a very strong upcoming move. Monitor your trades and secure partials to make the best out of it.
You can select how many signals it is going to show once trend conditions are met. Please be aware that the longer a trend goes, the higher is the probability of a reversal. Therefore the first few signals after all conditions are met are most likely the most profitable.
By setting the slope of the slow SMMA correctly you can filter out most signals in a ranging market.
█ DISCLAIMER
This is not financial advice. I do everything I can to provide the most accurate buy and sell signals for scalping but past results are no guarantee for future performance.

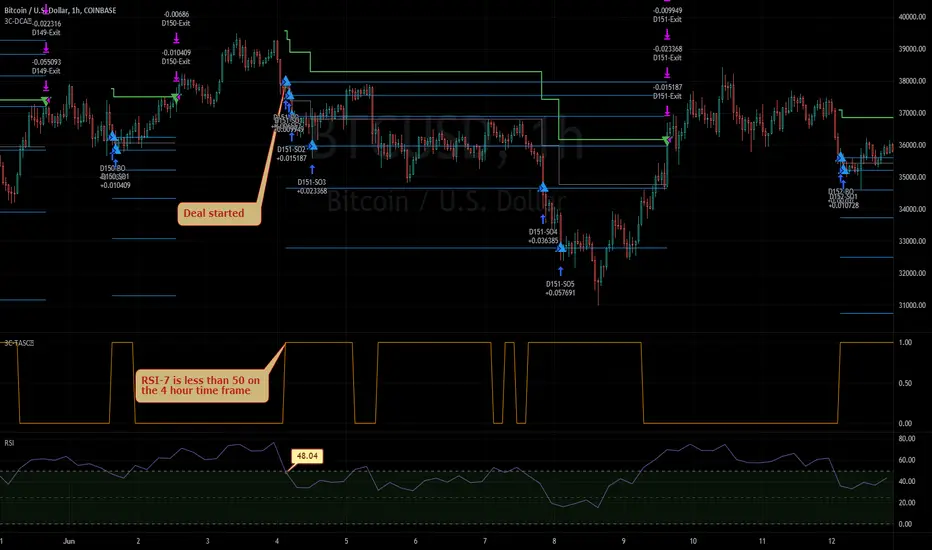
3Commas TA Start Conditions Indicator v1.0Introduction
The indicator attempts to implement the "Technical Analysis Starting Conditions" found in the 3Commas DCA trading bot settings.
How is it original and useful and how does it compare to other scripts in the Public Library?
This indicator is unique in that it's the only one (as of the initial publications) that can handle 5 signal indicator types at the same time as well as output the signal values either to the chart or the data window. The indicator supports all of the following 3Commas built-in indicators on the 3 minute, 5 minute, 15 minute, 30 minute, 1 hour, 2 hour, and 4 hour time frames:
RSI-7
ULT-7-14-2
BB-20-1-LB (Long)
BB-20-2-LB (Long)
MFI-14 crosses 40 (Long)
MFI-14 crosses 20 (Long)
CCI-40 crosses -200 (Long)
BB-20-1-UB (Short)
BB-20-2-UB (Short)
MFI-14 crosses 65 (Short)
CCI-40 crosses 0 (Short)
CCI-40 crosses 100 (Short)
What does it do and how does it do it?
When applied to the chart for the first time, the default settings are completely blank, so the only chart element you will see is the "Start Condition Result" line in orange. Once you start applying settings in the "DEAL START CONDITION" section, the indicator will redraw and display the new values for the "Start Condition Result" line. A value of 1 indicates that the results of the condition(s) is "passing". Conversely, a value of 0 indicates that the results of the condition(s) is NOT passing. If you desire to dig deeper into why the indicator is producing the results, you can enable the "Show TA Indicator # Plot" to visually see the values on the price chart or simply open the Data Window panel to see their values as you hover over the candles in the price chart.
This indicator can be used with any indicator in the Public Library that seeks to emulate the 3Commas Technical Analysis Starting Conditions for a signal provider. For example, this indicator can be used our own 3Commas DCA Bot Strategy v1.0 to aid in your backtesting analysis and build confidence that your bot will perform given historical market data that TradingView provides. When you do so, make sure that the "Strategy" input has the same values with the two indicator settings.
Enjoy! 😊👍
How to obtain access to the script?
You have two choices:
Use the "Website" link below to obtain access to this indicator, or
Send us a private message (PM) in TradingView itself.
3Commas DCA Bot Indicator v1.0Introduction
The indicator attempts to implement a majority all of the settings found on the 3Commas DCA Bot setting page that can be implemented within a TradingView indicator. Specifically, it will implement the "Open new trade ASAP" and "Trading View Custom Signal" deal start conditions. In this way, you can leverage the power of TradingView's backtester to model your settings and analysis past performance as well as leverage TradingView's alert notification subsystem to send Deal Start and Close signals to 3Commas using almost any of the thousands of scripts found in the Public Library (see "What does it do and how does it do it?" section below for more information on how to do this using the RSI indicator as an example).
How is it original and useful?
This indicator is unique in that it's the only one (as of the initial publications) that can handle 28 out of 32 bot settings (88% coverage) that are found on the 3Commas bot settings page. In addition, because it is a TradingView script, you will benefit from the following:
Model your bot's configuration using the backtester on any timeframe and evaluate its performance using the chart's history.
View a table of detailed statistics pertaining to deals started and completed, win/loss rates, daily P&L, true max drawdown, and detailed statistics on bars in deal along with safety orders filled.
View a table of "Used amount for each step" as presented in 3Commas as well.
Ability to link to almost any TradingView chart indicator that provides a single data point for buy/sell signals.
Make use of the 3Commas TA Start Conditions indicator to emulate the 3Commas built-in indicators for further performance evaluation with the backtester.
How does it compare to other scripts in the Public Library?
This indicator offers a very detailed, comprehensive settings and maybe the only one (as of the initial publication) that can handle 28 out of the 32 bot settings that are found on the 3Commas bot settings page (that can be handled within TradingView, because some cannot be modeled due to chart and language constraints). Specifically, the following 3Commas bot settings and inputs are addressed with asterisks denoting specific limitation due to TradingView's platform architecture and/or constraints:
Main settings
✅ Name
❌ Exchange* (Not handled since it is inherited from chart)
⚠ Bot type* (Only Single-pair because you simply apply the indicator to as many pairs you desire in separate charts to simulate a Multi-pair setting)
Pairs
❌ Pairs* (Not handled since it is inheriting the symbol from the chart)
Strategy
✅ Strategy
❌ Profit currency* (Not handled since there is no equivalence in TradingView)
✅ Base order size / unit
✅ Safety order size / unit
✅ Start order type
Deal start condition
⚠ TradingView* (You can modify the "Technical Rating" indicator by TradingView to output a signal yourself like @TheTradingParrot has done in the TV signal for DCA backtest script)
⚠ QFL* (See Quickfingers Luc's Base Breaking Strategy v2.5 - 3Commas Edition for an alternative)
❌ Manually/API* (Not handled since there is no equivalence in TradingView)
✅ Trading View custom signal
✅ Open new trade asap
Take profit
✅ Take profit (%)
✅ Take profit type
✅ Trailing
⚠ Trailing deviation* (modified to handle TradingView's broker emulator properly)
Stop loss
✅ Stop Loss (%)
✅ Stop Loss action
⚠ Stop Loss timeout* (modified to use "bars" as the unit of measure)
Safety orders
✅ Max safety trades count (a total of 100 safety orders are supported!)
⚠ Max active safety trades count* (Not handled since there is no equivalence in TradingView)
✅ Price deviation to open safety orders (% from initial order)
✅ Safety order volume scale
✅ Safety order step scale
Advanced settings
✅ Don't start deal(s) if the daily volume is less than
✅ Minimum price to open deal
✅ Maximum price to open deal
⚠ Deal start delay (QFL and standard TV signals only)* (modified to use "bars" as the unit of measure)
✅ Cooldown between deals
✅ Open deals & stop
Close deal after timeout
⚠ The time after which, deal will be closed automatically* (modified to use "bars" as the unit of measure)
In addition to the above inputs, the script will also support the same output data points that are found on the bot settings page, which are:
Assistant
✅ Balance
✅ Max amount for bot usage (Based on current rate)
✅ Max safety order price deviation
✅ % of available balance to be used by the bot
Table (Used amount for each step)
✅ Order No.
✅ Deviation %
✅ Order Size (Base currency)
✅ Order Volume (Quote currency)
✅ Price
✅ Average price
✅ Required price
✅ Required change
✅ Total Size (Base currency)
✅ Total Volume (Quote currency)
What does it do and how does it do it?
When applied to the chart for the first time, the default settings will work to execute the "Open new trade asap" deal start condition using a take profit of 4%, a base order size of 1.335% of equity (initial capital + net profit), a safety order size of 2.003% of equity (initial capital + net profit), a safety order volume scale of 1.5, a safety order step scale of 1.21, and a max safety trades count of 8. With these settings, as you scroll through the chart's history you should see price action crossing the DCA layers (denoted with blue triangles), and a green take-profit price line will render (with green triangle denoting the crossings). Lastly, in the upper-right corner of the chart the table of DCA statistics will render showing you all the gathered data that took place since the chart's starting history until the current time.
Using the "TV Custom Signal" section will allow you to "link" other chart indicators to supply "Start" and "Close" signals for the script. For example, here's how you can use the standard RSI indicator to generate an entry signal:
1) Add the stock RSI indicator and configure it to your desire.
2) Select the "RSI" indicator in the "Chart/Indicator Data Point" input.
3) Select "Chart/Indicator Data Point" in the "Start Deal When" input.
4) Select "Less Than" in the "Is" input.
5) Select "Custom Value(s)" in the "The Value Of" input.
6) Enter "25" in the "Custom Value 1 (Single or Lower Bound)" input.
7) Select "Trading View Custom Signal" in the "Open new trade" input (in the DEAL START CONDITION section).
8) Lastly, check the checkbox with a horizontal straight line above the "Start Deal When" input.
This means that the indicator will start a deal when the "RSI indicator" is "Less Than" the value of "25".
Strategy Results
The default settings are designed to ensure that the indicator will render chart elements when first loaded as well as to allow the backtester to gather order executions and display performance summary. The chart above is is using $10,000 initial capital, a commission rate of 0.1% for both entries and exits, and a 1 tick slippage setting. It is also using 3.22581% of the equity for the Base Order Size, 6.45161% of equity for the first Safety Order Size. The Maximum Safety Trade Count is 4 with a Safety Order Volume Scale of 2, a Safety Order Step Scale of 1.53, Price Deviation To Option Safety Orders at 5.3, and a take profit of 4.5% with Trailing turned on at a deviation of 1.5%. All other settings are defaults.
It is recommended that the indicator be "tuned" for your specific market in order to best implement the strategy and obtain better desirable results. You do so by using the backtester and statistics table and observe the output values and learn how the indicator is performing in the chart history. Using this information, you can adjust the settings accordingly until you find the settings acceptable to your trading goals and risk tolerance.
Always keep in mind that past performance may not be indicative of future results. Settings that seem favorable for one market may be found to be disastrous in another. Therefore, do take the time needed to understand how the settings will behave with the given chart symbol.
Enjoy! 😊👍
How to obtain access to the script?
You have two choices:
Use the "Website" link below to obtain access to this indicator, or
Send us a private message (PM) in TradingView itself.

B4Signals Ichimoku PremiumB4Signals Ichimoku is an advanced version of the standard ichimoku indicator. It removed the complexity of understanding all parts of the ichimoku indicator and provides a consensus based status of the overall ichimoku system.
B4Signals Ichimoku indicator is a very powerful price forecasting tool. Trade entry points identified with B4Signals Ichimoku are highly accurate on their own but they become very powerful when integrated into the rest of the B4 suite of indicators. Each entry is confirmed and validated with the the B4Signals Trading System before opening a position.
B4Signals Brackets features:
Automatic interpretation of the current price trend
Automatic interpretation of the lagging line
Automatic interpretation of the crosses
Automatic interpretation of the cloud forecast
Resulting trend direction
Trade entry and exit points
Automatic calculation of risk for entries
Setup alerts and get notified:
Trade entries and exits are triggered
Disclaimer
Copyright by B4Signals.
The information contained in our scripts/indicators/ideas does not constitute financial advice or a solicitation to buy or sell any securities of any type. We will not accept liability for any loss or damage, including without limitation any loss of profit, which may arise directly or indirectly from the use of or reliance on such information.
All investments involve risk, and the past performance of a security, industry, sector, market, financial product, trading strategy, or individual’s trading does not guarantee future results or returns. Investors are fully responsible for any investment decisions they make. Such decisions should be based solely on an evaluation of their financial circumstances, investment objectives, risk tolerance, and liquidity needs.

B4Signals Brackets PremiumB4Signals Brackets is a geometrical indicator that quantifies the price action in a pivot zone. It uses historical pricing to identify time and price alignments in order to forecast price levels. Price levels identified by B4Signals Brackets are significant support/resistance points. A decisive price break of these points results in very profitable trade opportunities.
B4Signals Brackets indicator is a very powerful price forecasting tool. Trade entry points identified with B4Signals Brackets are highly accurate on their own but they become very powerful when integrated into the rest of the B4 suite of indicators. Each entry is confirmed and validated with the the B4Signals Trading System before opening a position.
B4Signals Brackets features:
Dynamically calculated price bands during the significant times in the market
Price breakouts and forecast of price targets
Significant support and resistance price points
Traders can enable and customize the following:
Select the dynamic update time blocks and update times (changing these settings are not recommended)
Customize the visibility of the background shading of brackets
Setup alerts and get notified:
Trade entries are triggered
Disclaimer
Copyright by B4Signals.
The information contained in our scripts/indicators/ideas does not constitute financial advice or a solicitation to buy or sell any securities of any type. We will not accept liability for any loss or damage, including without limitation any loss of profit, which may arise directly or indirectly from the use of or reliance on such information.
All investments involve risk, and the past performance of a security, industry, sector, market, financial product, trading strategy, or individual’s trading does not guarantee future results or returns. Investors are fully responsible for any investment decisions they make. Such decisions should be based solely on an evaluation of their financial circumstances, investment objectives, risk tolerance, and liquidity needs.

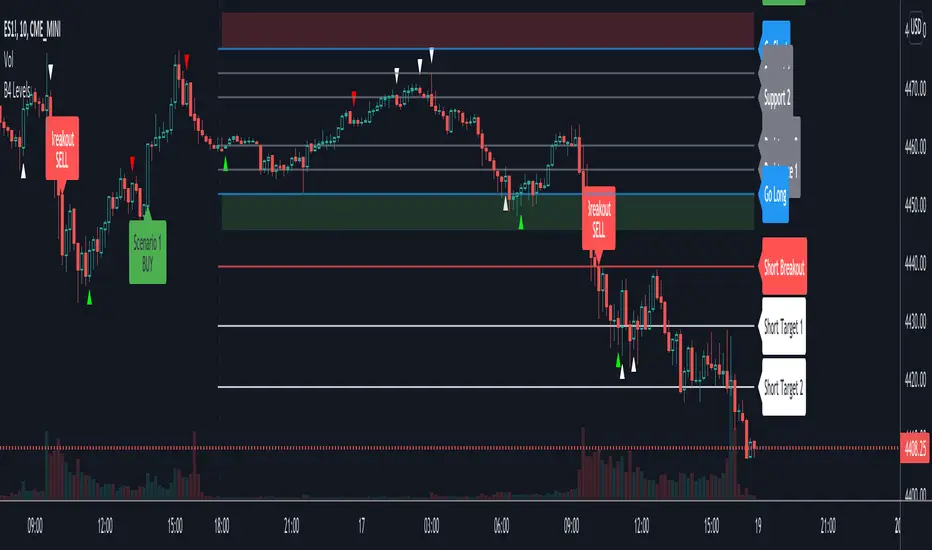
B4Signals Levels PremiumB4Signals Levels is a versatile indicator that allows traders to recognize key price levels, entry and exit points, and appropriate risk management.
B4Signals Levels indicator identifies trade entries for pivot points and breakouts. Trade entry points identified with B4Signals Levels are highly accurate on their own but they become very powerful when integrated into the rest of the B4 suite of indicators. Each entry is confirmed and validated with the the B4Signals Trading System before opening a position.
B4Signals Levels features:
10 clearly identified pivot points that provide traders with key support, resistance, trade entry and exit levels
Trade entry signals with profit target and stop loss levels
Breakout signals with profit target and stop loss levels
Trend reversal arrows for possible peak points of an existing trend
Trend exhaustion arrows for profit taking zones
Traders can enable and customize the following:
Select the aggregation to fit the trader's style of trading (intraday, swing trades, options, etc.)
Customize the visibility of the historical levels for backtesting
Customize the visibility of different types of trade entries
Setup alerts and get notified:
Trade entries are triggered
Price breakouts are triggered
Trend reversal has been identified
Trend exhaustion has been identified
Disclaimer
Copyright by B4Signals.
The information contained in our scripts/indicators/ideas does not constitute financial advice or a solicitation to buy or sell any securities of any type. We will not accept liability for any loss or damage, including without limitation any loss of profit, which may arise directly or indirectly from the use of or reliance on such information.
All investments involve risk, and the past performance of a security, industry, sector, market, financial product, trading strategy, or individual’s trading does not guarantee future results or returns. Investors are fully responsible for any investment decisions they make. Such decisions should be based solely on an evaluation of their financial circumstances, investment objectives, risk tolerance, and liquidity needs.
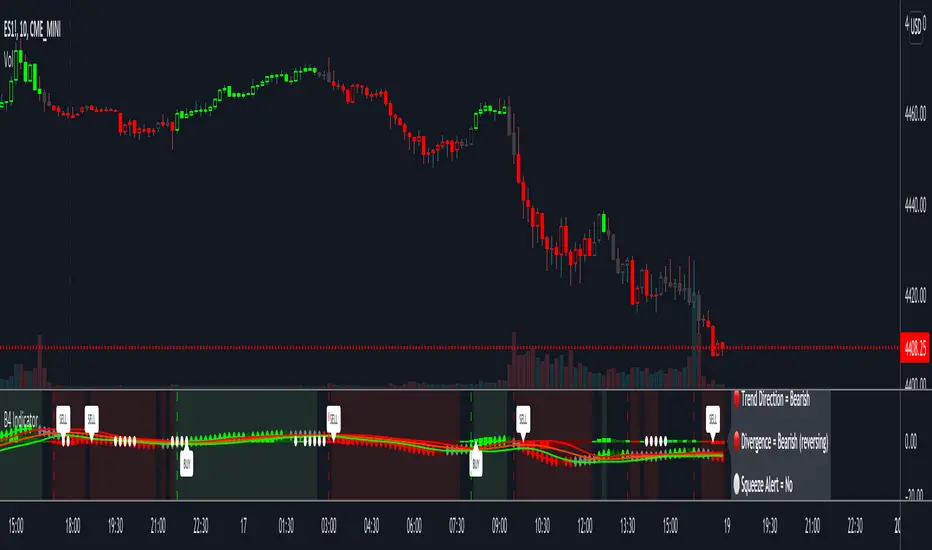
B4Signals IndicatorB4Signals Indicator is part of a suite of technical indicators that will help you target high value trading opportunities no matter what you trade. A successful trader understands the need to take advantage of opportunity when there is a trend that exhibits good momentum. Now, with B4Signals Indicator you can capture momentum while managing risks with our multi-featured indicator that is designed to identify breakouts or breakdowns in every market condition while providing clear trade entries and exists upon a single glance.
B4Signals Indicator is simple and easy to learn, yet robust enough to be reliable across all types of stocks, in all types of market environments. It provides high probability of reliable signals. It harnesses the power of confluence of indicators to confirm buy/sell conditions.
Virtually every day, B4Signals Indicator proves itself in the real world trading arena-rendering profits over a variety of markets and time frames. We combined highly successful trend following strategies to identify breakout or breakdown points as entry signals. B4Signals Indicator is an extremely accurate tool, and a vital and part of our B4 Trading System, a suite of technical indicators that provides amazingly accurate buy and sell entries, protective stops, trailing stops and profit targets. With every trade you will know the precise entry level and whether you are going long or short, how much you need to risk on the trade and when to exit.
Either As A Stand Alone Indicator or As a Part of Our Suite:
B4Signals Indicator can be used standalone or as a part of your current trading strategy.
Let the B4 Trading System show you when to get in a trade, how long to let your profits run, and when to exit. Virtually every possible market contingency is covered by the system rules so you always know exactly what to do. At the time of every entry, you always have a solid protective stop and precise target so you know exactly where to get in and where to get out and what to do in case things don’t go your way. This eliminates many stressful decisions associated with trading errors and unnecessary losses. B4Signals Indicator was designed for both new and seasoned traders.
B4Signals Indicator Features:
Trading Bands - These bands by themselves can be highly effective tools, but the potential for trading success is greatly increased when combined with B4 System
Confluence Conformation Cloud - A special combination of top performing, proven technical indicators that produces an incredibly easy and reliable way to identify the start and end of market trends
Bull Bear Lines - These fire either red or green to alert you to get ready to enter your position
Buy & Sell Signal Entries - When these signals are generated, they alert us to a market ready to possibly explode to new highs or lows
Trend Line - Identifies the prevailing direction of price. It shows the direction and speed of price, clearly and accurately identifying when bullish or bearish momentum is high
Squeeze Dots - Alerts you when markets may break out of a consolidation range
Squeeze Cloud - Changes colors in the bands when a squeeze is present getting you ready for an explosion in price action
Labels - Market Forecast, Trend, Divergence and Squeeze Alert. These labels are color coded to held you identify market turning points
Bar Coloring - Allows several options to color the candles according o strategies within the indicator
Our indicator is completely customizable and clearly identifies buy and short signals based on a combination of 12 unique metrics.
B4Signals Indicator Works In Any Market & Allows Users To:
Stay in positions longer, and catch entries/exits & reversals with crystal clear signals for precision
Designed for both trend following and contrarian traders
Timely filter out noise from the price in order to have clear pictures of the underlying market trend
Catch trends when they change bullish/bearish colors from green to red & vice versa
Improves chances of getting out of a winning position in profit
Disclaimer
Copyright by B4Signals.
The information contained in our scripts/indicators/ideas does not constitute financial advice or a solicitation to buy or sell any securities of any type. We will not accept liability for any loss or damage, including without limitation any loss of profit, which may arise directly or indirectly from the use of or reliance on such information.
All investments involve risk, and the past performance of a security, industry, sector, market, financial product, trading strategy, or individual’s trading does not guarantee future results or returns. Investors are fully responsible for any investment decisions they make. Such decisions should be based solely on an evaluation of their financial circumstances, investment objectives, risk tolerance, and liquidity needs.
VictoriaThis indicator visualises different oscillators processed through Inverse Fisher Transform
What is included:
Inverse Fisher Transform on different oscillators
You can combine multiple oscillators into one
The combination of sources can be calculated in different ways
Set different buy and sell signal thresholds
View selected thresholds in the chart
Use TradingView Technicals Buy and Sell signals to dynamically change threshold values
Convert signal to alerts
Multiple filters to allow or block signals
Backtest compatible
Alerts compatible
Two different chart modes:
You can view multiple oscillators in the same chart
You can view trade signals/alerts on the chart from the thresholds you have selected
Description:
With this indicator you're able to visually review the signal strength of one or multiple oscillators processed with Inverse Fisher Transform (IFT), combine them and choose the method of calculation when they are combined. This produces a signal which strongly fluctuates between -1 and +1 instead of the more common 0-100 most oscillators uses. The intention is to make the decision making clearer and easier when you decide when to enter or exit a trade. This aims to help you remove the feelings from your trading.
Inverse Fisher Transform was first presented by John Ehlers in Stocks & Commodities V. 22:5 where he proposes to process RSI with the formula for hyperbolic tangent, tanh(x). This transforms the oscillator into a smoother and more compressed version with quicker oscillations.
Within a bull or bear period of the traded asset the signal have different strengths. To harness this to our advantage we use the combined strength of the TradingView Technical indicator which gives us a Buy, Strong Buy, Sell or a Strong Sell on the selected timeframe and asset. This makes it possible to delay the buy in bearish conditions to only trigger when it is really oversold and also allow the signal be more relaxed and exit the trade sooner. While on the other hand if the condition is bullish the buy signal is relaxed and the sell requires a stronger signal. All of this is possible to change in the indicator to fine tune the settings for the specific asset and timeframe selected. We also have the possibility of blocking the buy signals with different filters.

Trend Bot Signal Detector by [ToplaninKizlarUcuyoruz]- This indicator working as a detector to receive my previous indicator's (Trend Bot, below) signals and appear all of the coins' signals in one table.
- You can also set alarms to receive notifications when signals.
- The indicator allow only 4 coins and four time intervals for each coins. (15 min - 1 hour - 4 hour - 1 day)
- You can add the indicator multiple times to keep track of coins more than 4 or track different exchanges.
** You can see a more descriptive page in my website. (Link is below and on my profile) **
The indicator (Trend Bot) which signals were received:
(you can also find more information about how it works, click on this chart picture)

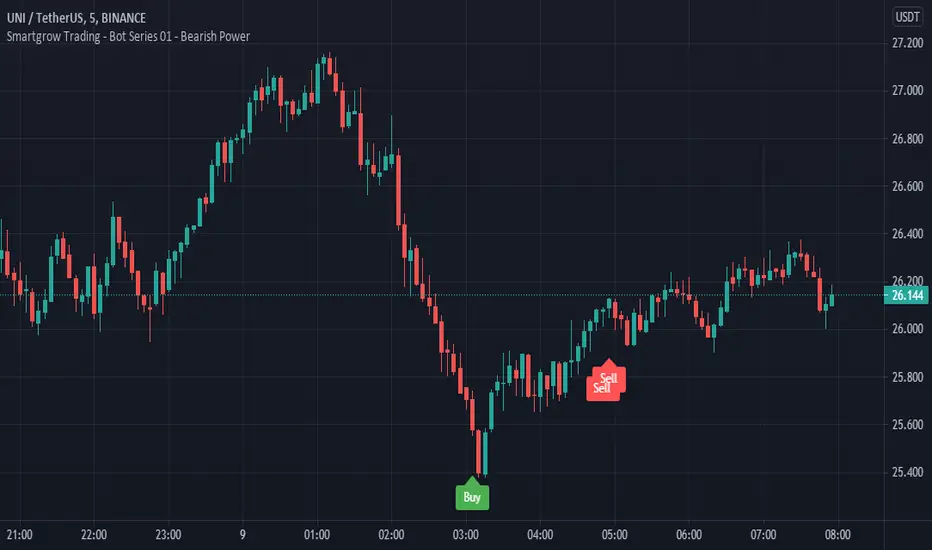
Smartgrow Trading - Bot Series 01 - Bearish PowerWelcome to our first Tradingview trading bot.
We develop signals which have been specially developed for crypto trading bots. We publish new indicators at regular intervals.
The main idea behind the bot is to use custom created indicators in a short and longer term timeframe to signal potential trendreversals in downtrends or ranging markets. The bot is not waiting for a trend confirmation signal before entering a trade, on the contrary, the bot waits for statistical extreme values to open a trade. When potential signals are detected we are trailing price to find the best spot to enter a trade. With this approach we buy in strong oversold areas as these have great potential to move in the other direction again. The sell signals are also generated by this custom indicator only selling off, if a stronger recovery in the market has occured. The potential profit margin is therefore between the best possible entry into a heavily oversold market and a recovery of the market.
So this tradingbot isnt designed to work with take profit, stop loss or trailing stop loss. This would result in a long term loss and is therefore not recommented. Also the bot is not tested in any other market like futures or stocks. So we recommend to use it in crypto spot market only.
Depending on market situations, potential losses can occur when a market is strongly bearish and does not want to recover over a long range, or when the bot has entered a trade to early. We have built in a safety mechanism for detecting further downtrends to avoid major losses. This mechanism is part of the needed risk management Therefore we are suggesting to use a proper risk management so only use 2-5% of your funds per trade. We use this bot with 2,5% funds per trade for our personal use. The study needs to be set up in the 5 min chart to work and you need to set up one buy alarm and one sell alarm per pair. The Signals are very picky therefore it is suitable to apply it on all possible pairs on your exchange excluding stable and shitcoins. You could test it in other financial markets but the bot was developed especially for crypto markets. If you have questions regarding pairs or want to see real life performance, feel free to contact us.
This indicator using different timeframes so it is sending a repainting warning. Cause it calculates values in a different timeframe. But thats normal and it wont recalculate results.
We sell this indicator so it is invite only. But of cause you can test it before buying.
If there are questions, write them into the comments or contact us directly over the direct message. Happy Trading!
Skript nur auf Einladung
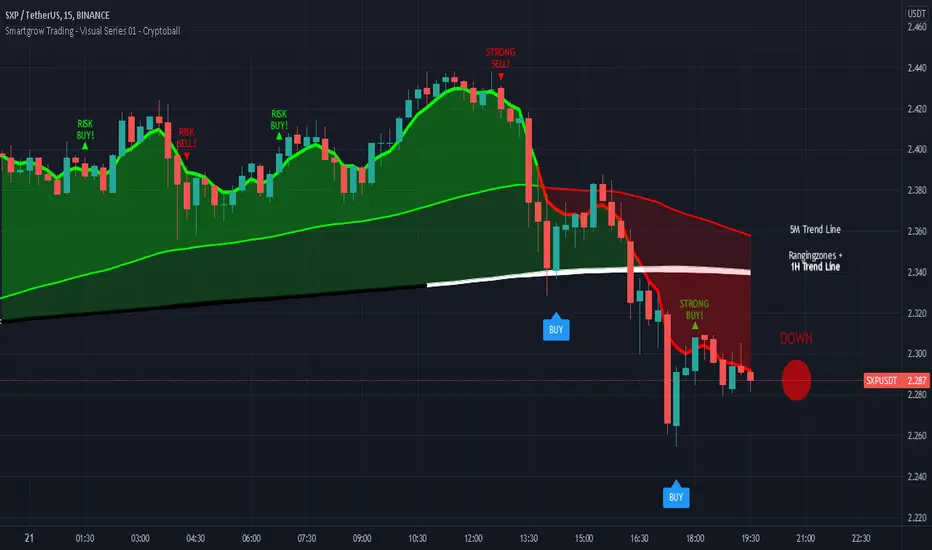
Smartgrow Trading - Visual Series - CryptoballWelcome to our Tradingview buy signal indicator with visual support.
We develop signals which have been specially developed for crypto trading bots. We will publish new indicators at regular intervals.
At the moment our all-in-one indicator includes the following indicators:
- "Crypto Bot Signal 01 - Optimized RSI Momentum"
- "Trading Bot Buy Signal 02 - MTF Stochastic"
- "Trading Bot Buy Signal 03 - MTF StochRSI"
- "Smartgrow Trading - Bearish Power Signals"
The basic idea of this all-in-one indicator is to decrease the needed number of alarms and to provide an all-in-one script for our users trading long direction only. We only include indicators which are relatively robust against false breakouts, even if these can of course never be avoided. These signals alone occur relatively rare, but you can set an alarm up on different pairs simultaneously. The strategy can only be used in 5 min chart and in crypto pairs. It wasnt tested in Forex etc. but feel free to test it.
The main idea behind the signals is to identify strong oversold areas as these have great potential to move in the other direction again. To determine this, we use custom oversold indicators to create buy signals. You could automate these buy signals but we suggest to use these instructions instead:
If an alarm is triggered it is showing points with a strong reversal chance for long signals. We recommend watching the chart closely and finding a good entry point. For visual support, we have visualized the basic trend in color on the one hand. If the 5 minute trend line is above the 1 hour trend line , then there is an upward trend which is marked with a corresponding note. If the 5 minute trend line is below the 1 hour trendline, then there is a downward trend. If you only want to look at the trend line of the 5 minute chart, deactivate the 1 hour trendline in the settings. When the 5 period Exponential Moving Average is higher then the 90 period Exponential Moving Average then the area between them is colored in green, otherwise in red. The same is the case when the 5 period Exponential Moving Average is higher then the 1 hour trendline.
As a second visual support, we have marked volatile zones in the market with the colors black and white. The color black generally denotes a market with low volatility and entry into these areas is therefore not recommended or involves risks. To show potential entry points based on market momentum we added note signs showing either buy or sell spots based on crossovers. If a crossover is within an area of low volatility we marked it as risk buy. if a crossover is within an area of higher volatility we marked it as a strong buy.
To find a good point to exit a trade we added also note signs showing possible sell spots. When these occure an crossover in momentum has allready occured and a potential trend reserval may occur. You could also use this indicator in combination with oversold indicators like RSI or Stochastic to see potential reversal spots when a market is oversold. As a last helper we implemented the Cryptoball on the right side of the chart to vizualize the currently price movement. Therefore it is looking only a few candles back to show you the smoothed price direction. When the color of the indicator is switching from green to red it is a sign that a smaller price drop may occure amd indicates a possible sell.
We sell this indicator so it is invite only. But of cause you can test the single indicators before buying.
If there are questions, write them into the comments or contact us directly over the direct message. Happy Trading!
Prophit Ninja: Shuriken DojoMaster the art of entries and exits with "Prophit Ninja: Shuriken Dojo".
Our dojo will set up sparring matches for you to improve your in-battle techniques without you having to track down the fight yourself. Find the strike, dodge and parry you are best at, or keep yourself well rounded to handle any environment by selecting any or all of the possible signal/alert outputs.
═════════════════════════════════════════════════════════════════════════
█ INTERPRETATION
Quickly and easily find/spot trade set ups with custom pre-built signals and alerts. Sit back and allow the market to find the set-ups for you.
═════════════════════════════════════════════════════════════════════════
█ OVERVIEW
Fully adaptable multi time frame signals and alerts based on your Shuriken settings for:
1 — Six RSI formula variations: Original, Prophit Ninja Composite, Absolute Strength, Cutlers RSI, True Strength Index and Stochastic RSI.
2 — Four MACD formula variations: Original, Lagless, Absolute and Absolute Lagless; along with momentum and volume variants of each.
3 — A toggle-able neutral range filter to grey out readings in the neutral range.
4 — An original and physically accurate momentum oscillator .
5 — A custom volatility oscillator.
6 — A custom volume oscillator with built in accumulation/distribution.
7 — A fibonacci adapted formula based on money flow.
8 — A fibonacci adapted formula based on rate of change along with momentum and volume variants.
9 — A histogram easter egg for those who need it.
10 — 11 completely separate indicators built into a quick and easy-to-read display called "Confluence Bands".
(Included free with " Prophit Ninja: Shuriken ".)
═════════════════════════════════════════════════════════════════════════
█ EASY CUSTOMIZATION
i.imgur.com
With a fully customizable and easy-to-use input menu , this indicator gives you the ability to tailor your trading experience to your needs and see as much (or as little) information as you want to; presented in the manner you deem most viable with the following options in just a few clicks:
Color Theme- There are four color themes available which include original, colorful, monochrome and solid. These not only allow you a quick and easy way to change the colors to suit your style; they also make it so you can challenge your bias in an instant by viewing the data in a completely different way.
Attack Modes- Whether you"re a scalper, day trader, swing trader, or investor; this option allows you to see the chart based on four different risk tolerance/time expectancy mentalities in just two clicks. Investors can see what the scalpers are thinking and vice/versa to broaden their decision making and/or hone in when optimal.
Sharpness Levels- This algorithm allows the user to display the data on five different smoothness levels without suffering the inherent lag that accompanies most other indicators. Whether you like to see every tick of a choppy movement, or filter out the false signals into smooth readings, you can do so at any moment.
═════════════════════════════════════════════════════════════════════════
█ PRE-BUILT ALERTS
With Prophit Ninja: Shuriken Dojo's built-in alerts you can enable alerts for any piece of the Shuriken in just a few clicks. These alerts are way more specific and optimized than you can possibly achieve with the custom alert settings. Each checking for multiple possible activation triggers instead of one and populating the message field automatically so you can just click create.
═════════════════════════════════════════════════════════════════════════
As you can see; this dojo has the ability to adapt to any ninja and give those in control of its power the upper hand. Any mode of battle, any opponent, any circumstance- "Prophit Ninja: Shuriken Dojo" was built by our finest architects to improve any trainee and make sure they know when to attack, defend or simply allow the fight to play out by its easy-to-read coloring system. As long as you show up for the matches you"ll have a much better chance of finding sparring matches than when you didn't.
This state-of-the-art add-on is great for experienced traders, those who just started learning to trade, or anyone in between- truly made to suit the needs of any trader, in any moment, with any mindset (along with the other indicators in our Prophit Ninja bundle) you"ll notice an immediate improvement in your Prophit Ninja: Shuriken skill after acquiring it.
═════════════════════════════════════════════════════════════════════════
*everything displayed is part of the Prophit Ninja indicator bundle; this is an otherwise blank chart*

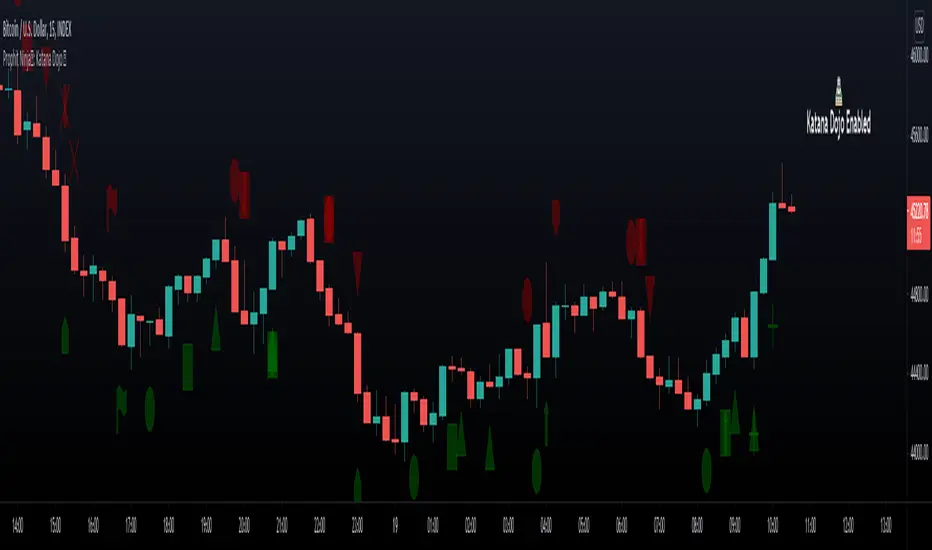
Prophit Ninja: Katana DojoMaster the art of trend reading with “Prophit Ninja: Katana Dojo”.
Our dojo will set up sparring matches for you to improve your in-battle techniques without you having to track down the fight yourself. Find the strike, dodge and parry you are best at, or keep yourself well rounded to handle any environment by selecting any or all of the possible signal/alert outputs.
═════════════════════════════════════════════════════════════════════════
█ INTERPRETATION
Quickly and easily find/spot chart setups with custom pre-built signals and alerts. Sit back and allow the market to find the set-ups for you.
═════════════════════════════════════════════════════════════════════════
█ OVERVIEW
Fully adaptable multi time frame signals and alerts based on your Katana settings for:
1 — Three customizable MA lengths with 12 formula variations and an average MA of the three; each one with the ability to toggle on or off not only itself- but an adaptive glow to filter out volatility, as well as a no lag feature that removes inherit lag that exists in all moving averages.
2 — A toggle-able fibonacci adapted formula based on ichimoku cloud.
3 — A toggle-able fibonacci adapted formula based on ssl channel.
4 — A toggle-able auto fibonacci retracement with a customizable golden pocket level.
5 — A fibonacci adapted formula based on bollinger bands.
6 — A fibonacci adapted formula based on keltner channels.
7 — Adaptive Pivot Point Labels.
8 — A fibonacci adapted formula based on chandelier stops.
9 — A fibonacci adapted formula based on parabolic stop and reverses.
10 — Fibonacci based auto support and resistance levels.
11 — Fibonacci based adaptive auto trendlines.
( Included free with “ Prophit Ninja: Katana ”.)
═════════════════════════════════════════════════════════════════════════
█ EASY CUSTOMIZATION
i.imgur.com
With a fully customizable and easy-to-use input menu, this indicator gives you the ability to tailor your trading experience to your needs and see as much (or as little) information as you want to; presented in the manner you deem most viable with the following options in just a few clicks:
Color Theme- There are four color themes available which include original, colorful, monochrome and solid. These not only allow you a quick and easy way to change the colors to suit your style; they also make it so you can challenge your bias in an instant by viewing the data in a completely different way.
Attack Mode- Whether you’re a scalper, day trader, swing trader, or investor; this option allows you to see the chart based on four different risk tolerance/time expectancy mentalities in just two clicks. Investors can see what the scalpers are thinking and vice/versa to broaden their decision making and/or hone in when optimal.
Sharpness Level- This algorithm allows the user to display the data on five different smoothness levels without suffering the inherent lag that accompanies most other indicators. Whether you like to see every tick of a choppy movement, or filter out the false signals into smooth readings, you can do so at any moment.
═════════════════════════════════════════════════════════════════════════
█ PRE-BUILT ALERTS
With Prophit Ninja: Katana Dojo’s built-in alerts you can enable alerts for any piece of the Katana in just a few clicks. These alerts are way more specific and optimized than you can possibly achieve with the custom alert settings. Each checking for multiple possible activation triggers instead of one and populating the message field automatically so you can just click create.
═════════════════════════════════════════════════════════════════════════
As you can see; this dojo has the ability to adapt to any ninja and give those in control of its power the upper hand. Any mode of battle, any opponent, any circumstance- "Prophit Ninja: Katana Dojo" was built by our finest architects to improve any trainee and make sure they know when to attack, defend or simply allow the fight to play out by its easy-to-read coloring system. As long as you show up for the matches you'll have a much better chance of finding sparring matches than when you didn't.
This state-of-the-art add-on is great for experienced traders, those who just started learning to trade, or anyone in between- truly made to suit the needs of any trader, in any moment, with any mindset (along with the other indicators in our Prophit Ninja bundle) you'll notice an immediate improvement in your Prophit Ninja: Katana skill after acquiring it.
═════════════════════════════════════════════════════════════════════════
*everything displayed is part of the Prophit Ninja indicator bundle; this is an otherwise blank chart*
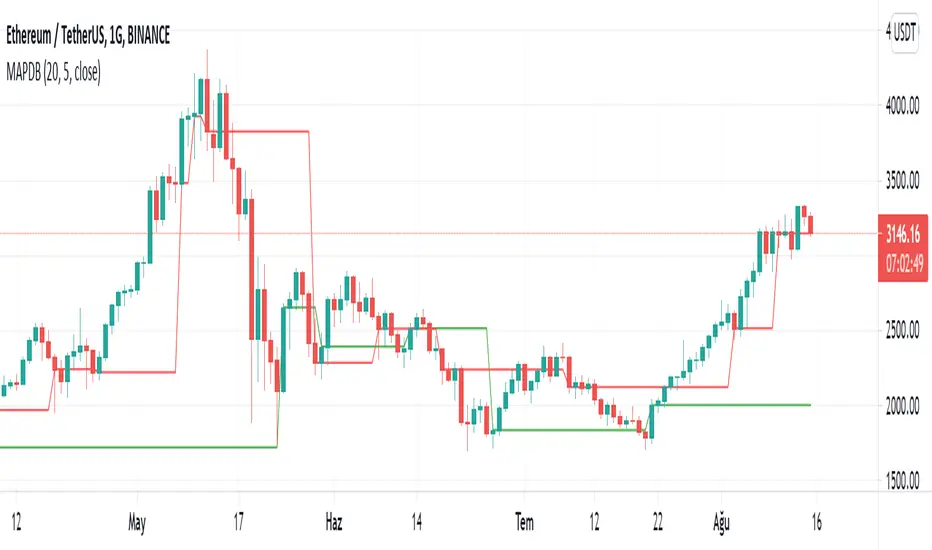
Moving Avarage Percentage difference bands It creates a buy and sell signal according to the up and down percentage differences of fast and slow moving averages. Green band breaks are buy and red band breaks are sell signals difference there is a threshold value for optimization, high values generate more signals, but the risk of these signals increases..
hızlı ve yavaş hareketli ortalamaların yüzdesel farklarının aşağıya ve yukarıya kırılımlarına göre alım ve satım sinyali oluşturur yeşil bant kırılımları al kırmızı bant kırılımları sat sinyalidir optimizasyon için eşik değeri eklenmiştir yüksek değerler daha fazla sinyal almanıza sebep olur ama riskli sinyal sayısı artar düşük değerler daha az sinyal almanızı sağlar ama riskli sinyal sayısıda azalır.