ALT Risk Metric StrategyHere's a professional write-up for your ALT Risk Strategy script:
ALT/BTC Risk Strategy - Multi-Crypto DCA with Bitcoin Correlation Analysis
Overview
This strategy uses Bitcoin correlation as a risk indicator to time entries and exits for altcoins. By analyzing how your chosen altcoin performs relative to Bitcoin, the strategy identifies optimal accumulation periods (when alt/BTC is oversold) and profit-taking opportunities (when alt/BTC is overbought). Perfect for traders who want to outperform Bitcoin by strategically timing altcoin positions.
Key Innovation: Why Alt/BTC Matters
Most traders focus solely on USD price, but Alt/BTC ratios reveal true altcoin strength:
When Alt/BTC is low → Altcoin is undervalued relative to Bitcoin (buy opportunity)
When Alt/BTC is high → Altcoin has outperformed Bitcoin (take profits)
This approach captures the rotation between BTC and alts that drives crypto cycles
Key Features
📊 Advanced Technical Analysis
RSI (60% weight): Primary momentum indicator on weekly timeframe
Long-term MA Deviation (35% weight): Measures distance from 150-period baseline
MACD (5% weight): Minor confirmation signal
EMA Smoothing: Filters noise while maintaining responsiveness
All calculations performed on Alt/BTC pairs for superior market timing
💰 3-Tier DCA System
Level 1 (Risk ≤ 70): Conservative entry, base allocation
Level 2 (Risk ≤ 50): Increased allocation, strong opportunity
Level 3 (Risk ≤ 30): Maximum allocation, extreme undervaluation
Continuous buying: Executes every bar while below threshold for true DCA behavior
Cumulative sizing: L3 triggers = L1 + L2 + L3 amounts combined
📈 Smart Profit Management
Sequential selling: Must complete L1 before L2, L2 before L3
Percentage-based exits: Sell portions of position, not fixed amounts
Auto-reset on re-entry: New buy signals reset sell progression
Prevents premature full exits during volatile conditions
🤖 3Commas Automation
Pre-configured JSON webhooks for Custom Signal Bots
Multi-exchange support: Binance, Coinbase, Kraken, Bitfinex, Bybit
Flexible quote currency: USD, USDT, or BUSD
Dynamic order sizing: Automatically adjusts to your tier thresholds
Full webhook documentation compliance
🎨 Multi-Asset Support
Pre-configured for popular altcoins:
ETH (Ethereum)
SOL (Solana)
ADA (Cardano)
LINK (Chainlink)
UNI (Uniswap)
XRP (Ripple)
DOGE
RENDER
Custom option for any other crypto
How It Works
Risk Metric Calculation (0-100 scale):
Fetches weekly Alt/BTC price data for stability
Calculates RSI, MACD, and deviation from 150-period MA
Normalizes MACD to 0-100 range using 500-bar lookback
Combines weighted components: (MACD × 0.05) + (RSI × 0.60) + (Deviation × 0.35)
Applies 5-period EMA smoothing for cleaner signals
Color-Coded Risk Zones:
Green (0-30): Extreme buying opportunity - Alt heavily oversold vs BTC
Lime/Yellow (30-70): Accumulation range - favorable risk/reward
Orange (70-85): Caution zone - consider taking initial profits
Red/Maroon (85-100+): Euphoria zone - aggressive profit-taking
Entry Logic:
Buys execute every candle when risk is below threshold
As risk decreases, position sizing automatically scales up
Example: If risk drops from 60→25, you'll be buying at L1 rate until it hits 50, then L2 rate, then L3 rate
Exit Logic:
Sells only trigger when in profit AND risk exceeds thresholds
Sequential execution ensures partial profit-taking
If new buy signal occurs before all sells complete, sell levels reset to L1
Configuration Guide
Choosing Your Altcoin:
Select crypto from dropdown (or use CUSTOM for unlisted coins)
Pick your exchange
Choose quote currency (USD, USDT, BUSD)
Risk Metric Tuning:
Long Term MA (default 150): Higher = more extreme signals, Lower = more frequent
RSI Length (default 10): Lower = more volatile, Higher = smoother
Smoothing (default 5): Increase for less noise, decrease for faster reaction
Buy Settings (Aggressive DCA Example):
L1 Threshold: 70 | Amount: $5
L2 Threshold: 50 | Amount: $6
L3 Threshold: 30 | Amount: $7
Total L3 buy = $18 per candle when deeply oversold
Sell Settings (Balanced Exit Example):
L1: 70 threshold, 25% position
L2: 85 threshold, 35% position
L3: 100 threshold, 40% position (final exit)
3Commas Setup
Bot Configuration:
Create Custom Signal Bot in 3Commas
Set trading pair to your altcoin/USD (e.g., ETH/USD, SOL/USDT)
Order size: Select "Send in webhook, quote" to use strategy's dollar amounts
Copy Bot UUID and Secret Token
Script Configuration:
Paste credentials into 3Commas section inputs
Check "Enable 3Commas Alerts"
Save and apply to chart
TradingView Alert:
Create Alert → Condition: "alert() function calls only"
Webhook URL: api.3commas.io
Enable "Webhook URL" checkbox
Expiration: Open-ended
Strategy Advantages
✅ Outperform Bitcoin: Designed specifically to beat BTC by timing alt rotations
✅ Capture Alt Seasons: Automatically accumulates when alts lag, sells when they pump
✅ Risk-Adjusted Sizing: Buys more when cheaper (better risk/reward)
✅ Emotional Discipline: Systematic approach removes fear and FOMO
✅ Multi-Asset: Run same strategy across multiple altcoins simultaneously
✅ Proven Indicators: Combines RSI, MACD, and MA deviation - battle-tested tools
Backtesting Insights
Optimal Timeframes:
Daily chart: Best for backtesting and signal generation
Weekly data is fetched internally regardless of display timeframe
Historical Performance Characteristics:
Accumulates heavily during bear markets and BTC dominance periods
Captures explosive altcoin rallies when BTC stagnates
Sequential selling preserves capital during extended downtrends
Works best on established altcoins with multi-year history
Risk Considerations:
Requires capital reserves for extended accumulation periods
Some altcoins may never recover if fundamentals deteriorate
Past correlation patterns may not predict future performance
Always size positions according to personal risk tolerance
Visual Interface
Indicator Panel Displays:
Dynamic color line: Green→Lime→Yellow→Orange→Red as risk increases
Horizontal threshold lines: Dashed lines mark your buy/sell levels
Entry/Exit labels: Green labels for buys, Orange/Red/Maroon for sells
Real-time risk value: Numerical display on price scale
Customization:
All threshold lines are adjustable via inputs
Color scheme clearly differentiates buy zones (green spectrum) from sell zones (red spectrum)
Line weights emphasize most extreme thresholds (L3 buy and L3 sell)
Strategy Philosophy
This strategy is built on the principle that altcoins move in cycles relative to Bitcoin. During Bitcoin rallies, alts often bleed against BTC (high sell, accumulate). When Bitcoin consolidates, alts pump (take profits). By measuring risk on the Alt/BTC chart instead of USD price, we time these rotations with precision.
The 3-tier system ensures you're always averaging in at better prices and scaling out at better prices, maximizing your Bitcoin-denominated returns.
Advanced Tips
Multi-Bot Strategy:
Run this on 5-10 different altcoins simultaneously to:
Diversify correlation risk
Capture whichever alt is pumping
Smooth equity curve through rotation
Pairing with BTC Strategy:
Use alongside the BTC DCA Risk Strategy for complete portfolio coverage:
BTC strategy for core holdings
ALT strategies for alpha generation
Rebalance between them based on BTC dominance
Threshold Calibration:
Check 2-3 years of historical data for your chosen alt
Note where risk metric sat during major bottoms (set buy thresholds)
Note where it peaked during euphoria (set sell thresholds)
Adjust for your risk tolerance and holding period
Credits
Strategy Development & 3Commas Integration: Claude AI (Anthropic)
Technical Analysis Framework: RSI, MACD, Moving Average theory
Implementation: pommesUNDwurst
Disclaimer
This strategy is for educational purposes only. Cryptocurrency trading involves substantial risk of loss. Altcoins are especially volatile and many fail completely. The strategy assumes liquid markets and reliable Alt/BTC price data. Always do your own research, understand the fundamentals of any asset you trade, and never risk more than you can afford to lose. Past performance does not guarantee future results. The authors are not financial advisors and assume no liability for trading decisions.
Additional Warning: Using leverage or trading illiquid altcoins amplifies risk significantly. This strategy is designed for spot trading of established cryptocurrencies with deep liquidity.
Tags: Altcoin, Alt/BTC, DCA, Risk Metric, Dollar Cost Averaging, 3Commas, ETH, SOL, Crypto Rotation, Bitcoin Correlation, Automated Trading, Alt Season
Feel free to modify any sections to better match your style or add specific backtesting results you've observed! 🚀Claude is AI and can make mistakes. Please double-check responses. Sonnet 4.5
SOL

NEESON Plus Crypto Market Sentiment IndicatorCore Features
1. Multi-Factor Sentiment Scoring System
Comprehensive Algorithm: Combines 6 different market indicators
Weighted Scoring: Each factor contributes with different weights
Real-time Calculation: Updates with every new bar
Smoothing Mechanism: Triple EMA smoothing for stable signals
2. Advanced Technical Indicators Integration
Multi-Timeframe RSI: 1H, 4H, and Daily RSI analysis
Volume Analysis: Volume spikes and decline detection
ATR Volatility: Market volatility assessment
MACD Momentum: Trend momentum confirmation
Bollinger Bands: Price position analysis
3. Proprietary Indicator Calculations
AHR999 Proxy: Enhanced version for crypto markets
Puell Multiple Proxy: Dynamic calculation with RSI adjustment
PI Cycle Top: Multi-moving average cycle analysis
CBBI Enhanced: Crypto Bull Bear Index with momentum
Market Volatility Sentiment: Volatility-based sentiment scoring
Volume Sentiment: Volume-based market sentiment
Signal Generation System
4. Multi-Condition Signal Filters
Strong Buy/Sell Signals: Multiple confirmation requirements
Warning Signals: Early entry/exit indications
Confirmation Bars: User-configurable signal confirmation
Trend Filter: Optional trend alignment requirement
Volume Filter: Volume spike confirmation
Volatility Filter: ATR-based market condition filtering
Momentum Filter: MACD momentum confirmation
5. Advanced Signal Management
Signal State Tracking: Maintains current position state
Duration Tracking: Tracks how long signals have been active
Entry Score Recording: Records sentiment score at entry
Consecutive Signal Counting: Prevents signal flipping
Exit Conditions: Multiple exit criteria for risk management
Visualization Features
6. Professional Chart Display
Dual Score Plotting: Comprehensive and raw sentiment scores
Color-Coded Background: Real-time market sentiment coloring
Threshold Lines: Clear visual reference levels
Area Fills: Colored zones for different sentiment levels
Signal Markers: Visual indicators for buy/sell signals
7. Information Panel
Real-time Data Display: Current scores and signals
Position Tracking: Duration and entry information
Performance Metrics: Floating P/L calculation
Market Status: RSI, Volume, Volatility, MACD status
Configuration Status: Current filter settings
Customization Options
8. User-Configurable Parameters
Threshold Settings: Adjustable buy/sell/exit levels
Filter Toggles: Enable/disable various filters
Indicator Periods: Customizable calculation periods
Color Settings: Fully customizable color scheme
Signal Duration: Minimum signal duration requirements
9. Alert System
Strong Buy/Sell Alerts: Immediate notification for strong signals
Warning Alerts: Early signal notifications
Custom Alert Messages: Clear, descriptive alert texts
Multiple Timeframe Compatibility: Works across all timeframes
Risk Management Features
10. Built-in Protection Mechanisms
Signal Confirmation: Prevents false signals
Exit Triggers: Multiple exit conditions
Position Duration Limits: Automatic exit after prolonged periods
Profit/Loss Tracking: Real-time performance monitoring
Volatility Adjustment: Adapts to market conditions
Technical Specifications
11. Performance Optimization
Efficient Calculation: Optimized for real-time performance
Multi-Timeframe Support: Works on all chart timeframes
Resource Management: Controlled line and label counts
Precision Control: Adjustable decimal precision
12. Compatibility
Cryptocurrency Focus: Specifically designed for crypto markets
Multi-Asset Support: Works with all TradingView symbols
Platform Compatibility: Fully compatible with TradingView platform
Mobile Support: Responsive design for mobile devices
Usage Benefits
Comprehensive Analysis: Single indicator providing multiple insights
Clear Signals: Easy-to-understand buy/sell indications
Customizable: Adaptable to different trading styles
Risk-Aware: Built-in risk management features
Professional Grade: Institutional-level analysis tools
User-Friendly: Intuitive visual interface
Educational: Helps understand market sentiment dynamics
This indicator is designed to provide traders with a comprehensive market sentiment analysis tool specifically optimized for cryptocurrency markets, combining traditional technical analysis with crypto-specific metrics.

NFTs vs SOL - Momentum Divergence DetectionNFTs vs SOL – Momentum Divergence Detection:
See when NFT activity (proxy volumes) leads or lags SOL momentum.
This is an indicator that I designed to compare Solana’s price momentum with aggregated NFT market activity. It converts both into standardized z-scores for direct comparison, then measures their divergence. The resulting signal highlights when NFT trading activity begins to move ahead of, or behind, SOL price action.
Core Function:
• Measures SOL’s momentum using Rate of Change (ROC), then standardizes and smooths it.
• Combines multiple NFT-related token volumes (BLUR, LOOKS, TNSR, MAGIC, APE, optionally ME and PENGU), applies log normalization, weighting, and smoothing to form a composite NFT activity score.
• Plots their difference (NFT Z − SOL Z) as a histogram to visualize lead/lag phases.
Interpretation:
• div > 0: NFT activity exceeds SOL momentum → potential early signal for upside.
• div < 0: NFT activity trails SOL momentum → possible cooling or lag.
• Zero-line crosses: indicate leadership changes between NFTs and SOL.
On-Chart Visualization:
• Orange histogram: divergence (lead/lag strength).
• Purple line: NFT composite z-score.
• Blue line: SOL momentum z-score.
• Green/Red markers: lead or lag signals.
• Top-right table: rolling correlation and active proxies.
Usage:
Apply to 30m–1D charts.
Enter exchange-prefixed NFT tickers (e.g., KUCOIN:BLURUSDT).
Adjust weights to emphasize liquid tokens.
Interpret lead/lag crosses within the broader market structure, using trend and volume as confirmation.
Recommended Presets:
• Swing trading: 1D or 4H charts, smoother settings for stability.
• Active setups: 2H or 1H charts, lower smoothing for responsiveness.
Key Notes:
• Requires valid tickers and sufficient lookback history.
• Use crosses as context, not direct trade signals.
• High correlation = synchronous behavior; low correlation = decoupled regime.
Summary:
A contextual radar for Solana traders tracking NFT market flow. It helps identify when NFT trading activity begins leading or lagging SOL’s momentum which often signals shifts in speculative energy and trend strength.
Copyright © 2025 imaclone (Zen Silva). All rights reserved.
License: Private. No copying, sharing, or derivative works.

Cycle Indicator CS7This indicator visualizes cyclical structures (including inverse cycles) for financial instruments.
It is highly customizable and comes with a default configuration optimized for cryptocurrencies on a 45-minute timeframe, highlighting the following cycles:
• T-3: Daily cycles
• T-2: Approximately 2-day cycles
• T+1: Bi-weekly cycles
• T-1: Approximately 4-day cycles
• T: Weekly cycles
The same setup can also be applied effectively on a 24-hour timeframe, highlighting the following longer-term cycles:
• T+2: Monthly cycles
• T+3: Quarterly cycles
• T+4: Semi-annual cycles
• T+5: Annual cycles
• T+6: Bi-annual cycles
Users can customize the configurations to suit the specific characteristics of any financial instrument.
Additionally, the indicator includes a prediction system that approximates future cycles, marking them with a “?”.

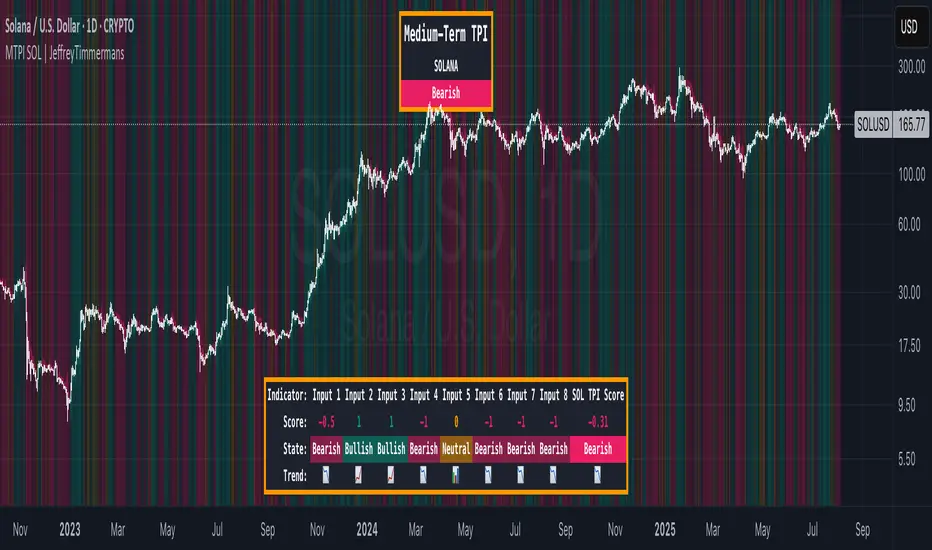
MTPI SOL | JeffreyTimmermansMedium-Term Trend Probability Indicator
The "Medium-Term Trend Probability Indicator" on SOL (Solana) is a custom-built tool designed to analyze Solana (SOL) from a medium-term perspective. Unlike short-term indicators that react quickly to intraday volatility or long-term models that focus on macro cycles, the MTPI is optimized to detect medium-term market trends—capturing key turning points and momentum shifts that unfold over multiple weeks.
This version of the MTPI is applied to SOL, making it a Solana-specific trend-following tool with particular sensitivity to its price behavior and structural dynamics.
Key Features
Medium-Term Focus:
Built to monitor price action over several weeks to months, the MTPI filters out short-term noise while remaining responsive to meaningful trend changes.
8 Input Signals:
The MTPI aggregates 8 carefully selected trend-following inputs, each tuned to reflect mid-cycle behavior in SOL’s price movements.
Market Regimes:
The MTPI classifies market behavior into one of three clear regimes:
Bullish → Momentum and structure align to support a continued uptrend
Bearish → Majority of signals point to trend deterioration or downside momentum
Neutral → Mixed signals, often during consolidation or early transition phases
Visual Background:
The background color shifts dynamically to reflect the active regime—making it easy to visually interpret the prevailing market condition.
Comprehensive Dashboard:
The lower panel displays:
The state of each individual input (Bullish, Bearish, Neutral)
The numerical MTPI Score (average of all 8 signals)
The final Trend Classification (Bullish / Bearish / Neutral)
How It Works
Input Analysis:
Each of the 8 inputs outputs a score based on its internal signal:
+1 = Bullish condition
-1 = Bearish condition
0 = Neutral / indecisive
Score Calculation:
The MTPI Score is calculated as the average of all 8 input signals:
Score > +0.1 = Bullish regime
Score < -0.1 = Bearish regime
Score between -0.1 and +0.1 = Neutral regime
Background Coloring:
Color-coded backgrounds instantly reflect the current trend classification based on the MTPI Score, helping traders stay aligned with the market direction at all times.
Use Cases
Mid-Term Positioning:
Identify strong trend phases on SOL with reduced noise and increased directional clarity.
Confirmation Layer:
Use MTPI as a mid-term confirmation tool alongside short-term setups or long-term macro models (like LTPI).
Rotation or Transition Detection:
Spot key moments when SOL transitions from expansion to contraction phases (and vice versa).
Dynamic Alerts:
Bullish Signal: MTPI Score crosses above +0.1
Bearish Signal: MTPI Score crosses below -0.1
Neutral Zone: MTPI Score enters between -0.1 and +0.1
Conclusion
The Medium-Term Trend Probability Indicator (MTPI – SOL) provides a powerful framework for identifying trend phases on Solana with mid-term relevance. By combining 8 intelligent inputs into a single score and market classification, it offers clarity in times of uncertainty and confidence in times of momentum. Whether used alone or as part of a broader multi-timeframe strategy, the MTPI helps refine entries, exits, and macro alignment in the dynamic world of Solana trading.
Crypto Volatility Bitcoin Correlation Strategy Description:
The Crypto Volatility Bitcoin Correlation Strategy is designed to leverage market volatility specifically in Bitcoin (BTC) using a combination of volatility indicators and trend-following techniques. This strategy utilizes the VIXFix (a volatility indicator adapted for crypto markets) and the BVOL7D (Bitcoin 7-Day Volatility Index from BitMEX) to identify periods of high volatility, while confirming trends with the Exponential Moving Average (EMA). These components work together to offer a comprehensive system that traders can use to enter positions when volatility and trends are aligned in their favor.
Key Features:
VIXFix (Volatility Index for Crypto Markets): This indicator measures the highest price of Bitcoin over a set period and compares it with the current low price to gauge market volatility. A rise in VIXFix indicates increasing market volatility, signaling that large price movements could occur.
BVOL7D (Bitcoin 7-Day Volatility Index): This volatility index, provided by BitMEX, measures the volatility of Bitcoin over the past 7 days. It helps traders monitor the recent volatility trend in the market, particularly useful when making short-term trading decisions.
Exponential Moving Average (EMA): The 50-period EMA acts as a trend indicator. When the price is above the EMA, it suggests the market is in an uptrend, and when the price is below the EMA, it suggests a downtrend.
How It Works:
Long Entry: A long position is triggered when both the VIXFix and BVOL7D indicators are rising, signaling increased volatility, and the price is above the 50-period EMA, confirming that the market is trending upward.
Exit: The strategy exits the position when the price crosses below the 50-period EMA, which signals a potential weakening of the uptrend and a decrease in volatility.
This strategy ensures that traders only enter positions when the volatility aligns with a clear trend, minimizing the risk of entering trades during periods of market uncertainty.
Testing and Timeframe:
This strategy has been tested on Bitcoin using the daily timeframe, which provides a longer-term perspective on market trends and volatility. However, users can adjust the timeframe according to their trading preferences. It is crucial to note that this strategy does not include comprehensive risk management, aside from the exit condition when the price crosses below the EMA. Users are strongly advised to implement their own risk management techniques, such as setting appropriate stop-loss levels, to safeguard their positions during high volatility periods.
Utility:
The Crypto Volatility Bitcoin Correlation Strategy is particularly well-suited for traders who aim to capitalize on the high volatility often seen in the Bitcoin market. By combining volatility measurements (VIXFix and BVOL7D) with a trend-following mechanism (EMA), this strategy helps identify optimal moments for entering and exiting trades. This approach ensures that traders participate in potentially profitable market moves while minimizing exposure during times of uncertainty.
Use Cases:
Volatility-Based Entries: Traders looking to take advantage of market volatility spikes will find this strategy useful for timing entry points during market swings.
Trend Confirmation: By using the EMA as a confirmation tool, traders can avoid entering trades that go against the trend, which can result in significant losses during volatile market conditions.
Risk Management: While the strategy exits when price falls below the EMA, it is important to recognize that this is not a full risk management system. Traders should use caution and integrate additional risk measures, such as stop-losses and position sizing, to better manage potential losses.
How to Use:
Step 1: Monitor the VIXFix and BVOL7D indicators. When both are rising and the Bitcoin price is above the EMA, the strategy will trigger a long entry, indicating that the market is experiencing increased volatility with a confirmed uptrend.
Step 2: Exit the position when the price drops below the 50-period EMA, signaling that the trend may be reversing or weakening, reducing the likelihood of continued upward price movement.
This strategy is open-source and is intended to help traders navigate volatile market conditions, particularly in Bitcoin, using proven indicators for volatility and trend confirmation.
Risk Disclaimer:
This strategy has been tested on the daily timeframe of Bitcoin, but users should be aware that it does not include built-in risk management except for the below-EMA exit condition. Users should be extremely cautious when using this strategy and are encouraged to implement their own risk management, such as using stop-losses, position sizing, and setting appropriate limits. Trading involves significant risk, and this strategy does not guarantee profits or prevent losses. Past performance is not indicative of future results. Always test any strategy in a demo environment before applying it to live markets.

SOL & BTC EMA with BTC/SOL Price Difference % and BTC Dom EMAThis script is designed to provide traders with a comprehensive analysis of Solana (SOL) and Bitcoin (BTC) by incorporating Exponential Moving Averages (EMAs) and price difference percentages. It also includes the BTC Dominance EMA to offer insights into the overall market dominance of Bitcoin.
Features:
SOL EMA: Plots the Exponential Moving Average (EMA) for Solana (SOL) based on a customizable period length.
BTC EMA: Plots the Exponential Moving Average (EMA) for Bitcoin (BTC) based on a customizable period length.
BTC Dominance EMA: Plots the Exponential Moving Average (EMA) for BTC Dominance, which helps in understanding Bitcoin's market share relative to other cryptocurrencies.
BTC/SOL Price Difference %: Calculates and plots the percentage difference between BTC and SOL prices, adjusted for their respective EMAs. This helps in identifying relative strength or weakness between the two assets.
Background Highlight: Colors the background to visually indicate whether the BTC/SOL price difference percentage is positive (green) or negative (red), aiding in quick decision-making.
Inputs:
SOL Ticker: Symbol for Solana (default: BINANCE
).
BTC Ticker: Symbol for Bitcoin (default: BINANCE
).
BTC Dominance Ticker: Symbol for Bitcoin Dominance (default: CRYPTOCAP
.D).
EMA Length: The length of the EMA (default: 20 periods).
Usage:
This script is intended for traders looking to analyze the relationship between SOL and BTC, using EMAs to smooth out price data and highlight trends. The BTC/SOL price difference percentage can help traders identify potential trading opportunities based on the relative movements of SOL and BTC.
Note: Leverage trading involves significant risk and may not be suitable for all investors. Ensure you have a good understanding of the market conditions and employ proper risk management techniques.

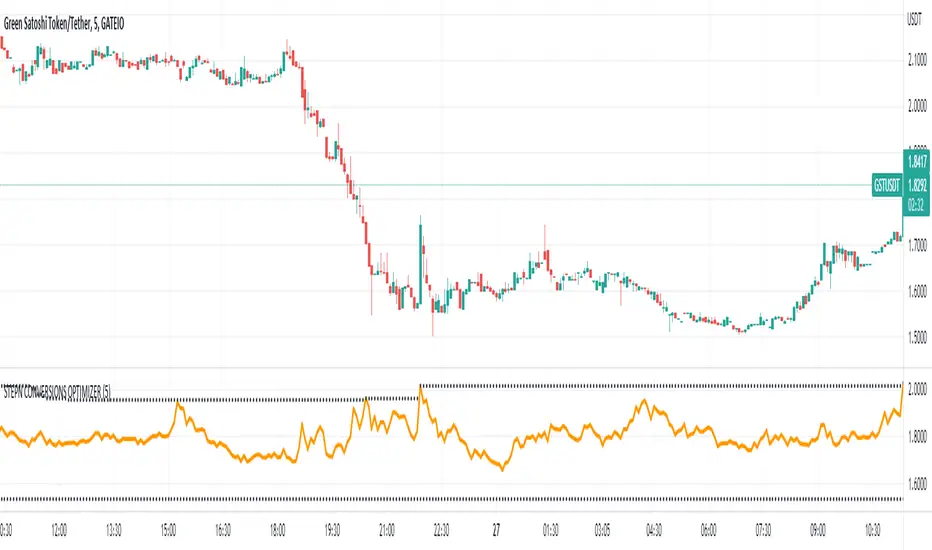
STEPN CONVERSION OPTIMIZERThis is a very simple indicator that anyone can use but it is especially geared towards STEPN users who often have to switch between different tokens (GST, GMT, SOL, BNB).
The idea of the indicator is that at a glance you can know if it is a good time or not to make a conversion. What the indicator does is divide the value of the token that we have by the one that we want to change in each bar and with this data a graph is created with which you know how much you are going to receive for each token and how much you would have received at any other time.
It is completely configurable for any conversion between STEPN tokens, you can also include two dotted lines that indicate when the maximum and minimum conversion rate has been reached, which makes it very easy to know where you are.
The data collection is independent of the graph on screen so it's great to have it on screen waiting for the ideal moment for the change while you do other things.
The timeframe is also configurable in case you are not very interested in precision, by default the data is taken from the 5-minute chart.
I created this indicator for myself but seeing how useful it is to me and that not only am I not losing money like before but I am even earning money with conversions, I have decided to share it.
Feedback would be appreciated and if you like it and find it as useful as it does for me, show some love.
Price DEFI Categories against BTC & ETH/* Work in progress. The indicator is not finished. *\
The indicator shows the pricing of 3 DEFI categories against 2 possible baselines, BTC and ETH.
To do:
* Make a simple array in the source code to enter and remove new projects to the category. -> Maybe can also make it so that the source code does not have to be altered (projects can be added through input etc.)
* Adjust weightings depending on project data but this is not as important since weightings are being priced in by the market.
* Try to find a way to update input to string instead of booleans. As of currently, I could not seem to use input strings into plot functions because of an error.
* and more. Leave some feedback, that would be highly appreciated!
