MACD Bullish Cross Alert📘 Indicator Description – MACD Bullish Cross Alert
This indicator is designed to detect bullish momentum shifts using the classic MACD (Moving Average Convergence Divergence) crossover strategy.
Key Features:
Calculates the MACD Line and Signal Line using customizable inputs (default: 12, 26, 9).
Triggers an alert when the MACD Line (blue) crosses above the Signal Line (orange).
Helps identify early bullish trend reversals or momentum entry points.
Ideal for swing traders, position traders, and crypto investors using the weekly timeframe.
How to Use:
Add to any chart and set the timeframe to 1W (weekly).
Create an alert using the built-in MACD Bullish Crossover condition.
Combine with price action, volume, or RSI for higher conviction entries.
Use Cases:
Spotting early entry points after long downtrends.
Confirming a trend reversal in high timeframes.
Generating high-probability entries in trend-following systems.
Statistics

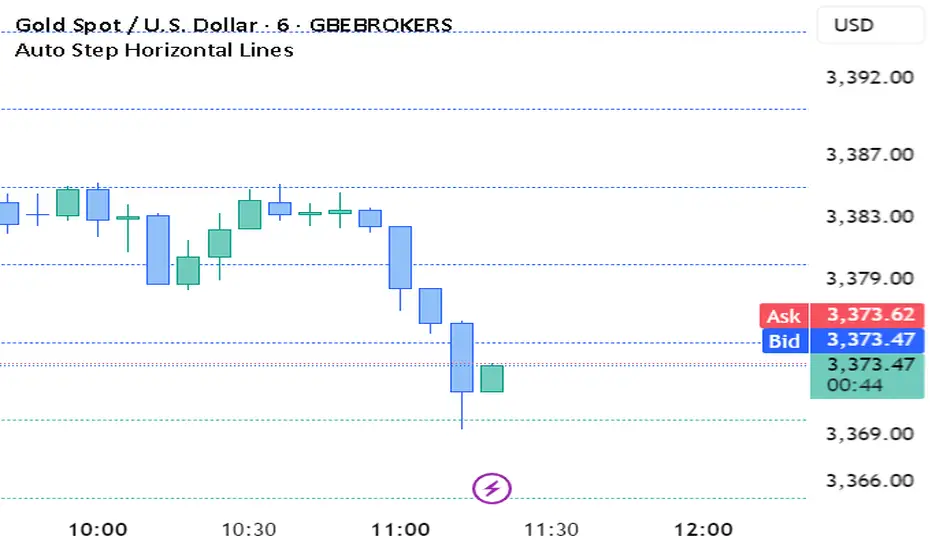
Auto Step Horizontal LinesAuto Step Horizontal lines by custom range
Create automatic horizontal lines by specifying the price range for each line, with each line serving as an observation point for support and resistance levels.
MG Universal model🚀 Summary🚀
The MG univerasal model is a composite of various items such as RSI, price Z-Score, Sharpe Ratio, Sortino Ratio, Omega Ratio, etc
Each component is normalized and then equally wheighted out to perform a global metric.
At the end, an Exponential Moving Average is added on the global metric.
You can easily find a description of each component on the internet, for the Crosby Ratio, it's a metric that comes from bitcoinmagazinepro.com.
✨ Key Features ✨
🗡 Smoothed Global Metric
Using a Moving average to smooth out the whole aggregated metric.
🗡 Bands Zone at extreme levels
Automatically displaying bands at top and bottom levels of the oscillator.
🗡 Normalizing components
Each component is normalized.
🗡 DataTable
Optional DataTable is available to check the score for each components and their related Z-Score.
📊 How I use it 📊
When catching up with 0 line (midline), crossing it :
if it goes above 0.2:
get out when it crosses 0.2 again
else:
get out when it crosses 0 again
That's the way I use it, may be there is a better way, FAFO :)
❓ Seeing a bug or an issue ❓
Feel free to DM me if you see a component that seems badly calculated.
I will be happy to fix it.
❗❗ Disclaimer ❗❗
This is a single indicator, even though it's aggregating many, do not use it as a standalone.
Past performance is not indicative of future results.
Always backtest, check, and align parameters before live trading.

CVD (Cumulative Volume Delta)
Cumulative Volume Delta
Use a moving average with three different
I thought about determining the volatility and direction of the price of the stock price and finding a place to break through.
I made some Mistake coz I'm new corder
I'm reposting this simple script due to house rule violation. (Whatever can haha) 😁
I'm erasing all the comments in my native language that I had in my script... I thought it would make the User uncomfortable, so I locked the code, and I thought maybe that's the problem
Anyway, I'm sorry 😅

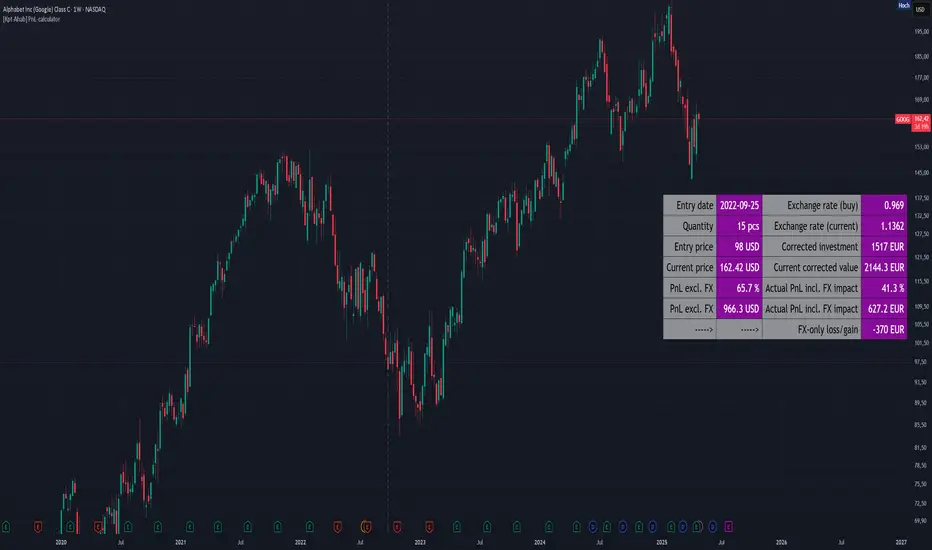
[Kpt-Ahab] PnL-calculatorThe PnL-Cal shows how much you’re up or down in your own currency, based on the current exchange rate.
Let’s say your home currency is EUR.
On October 10, 2022, you bought 10 Tesla stocks at $219 apiece.
Back then, with an exchange rate of 0.9701, you spent €2,257.40.
If you sold the 10 Tesla shares on April 17, 2025 for $241.37 each, that’s around a 10% gain in USD.
But if you converted the USD back to EUR on the same day at an exchange rate of 1.1398, you’d actually end up with an overall loss of about 6.2%.
Right now, only a single entry point is supported.
If you bought shares on different days with different exchange rates, you’ll unfortunately have to enter an average for now.
For viewing on a phone, the table can be simplified.
Institutional MACD (Z-Score Edition) [VolumeVigilante]📈 Institutional MACD (Z-Score Edition) — Professional-Grade Momentum Signal
This is not your average MACD .
The Institutional MACD (Z-Score Edition) is a statistically enhanced momentum tool, purpose-built for serious traders and breakout hunters . By applying Z-Score normalization to the classic MACD structure, this indicator uncovers statistically significant momentum shifts , enabling cleaner reads on price extremes, trend continuation, and potential reversals.
💡 Why It Matters
The classic MACD is powerful — but raw momentum values can be noisy and relative , especially on volatile assets like BTC/USD . By transforming the MACD line, signal line, and histogram into Z-scores , we anchor these signals in statistical context . This makes the Institutional MACD:
✔️ Timeframe-agnostic and asset-normalized
✔️ Ideal for spotting true breakouts , not false flags
✔️ A reliable tool for detecting momentum divergence and exhaustion
🧪 Key Features
✅ Full Z-Score normalization (MACD, Signal, Histogram)
✅ Highlighted ±Z threshold bands for overbought/oversold zones
✅ Customizable histogram coloring for visual momentum shifts
✅ Built-in alerts for zero-crosses and Z-threshold breaks
✅ Clean overlay with optional display toggles
🔁 Strategy Tip: Mean Reversion Signals with Statistical Confidence
This indicator isn't just for spotting breakouts — it also shines as a mean reversion tool , thanks to its Z-Score normalization .
When the Z-Score histogram crosses beyond ±2, it marks a statistically significant deviation from the mean — often signaling that momentum is overstretched and the asset may be due for a pullback or reversal .
📌 How to use it:
Z > +2 → Price action is in overbought territory. Watch for exhaustion or short setups.
Z < -2 → Momentum is deeply oversold. Look for reversal confirmation or long opportunities.
These zones often precede snap-back moves , especially in range-bound or corrective markets .
🎯 Combine Z-Score extremes with:
Candlestick confirmation
Support/resistance zones
Volume or price divergence
Other mean reversion tools (e.g., RSI, Bollinger Bands)
Unlike the raw MACD, this version delivers statistical thresholds , not guesswork — helping traders make decisions rooted in probability, not emotion.
📢 Trade Smart. Trade Vigilantly.
Published by VolumeVigilante

Vietnamese Stocks: Multi-Ticker Fibonacci AlertThis Pine Script™ indicator is designed specifically for traders monitoring the Vietnamese stock market (HOSE, HNX). Its primary goal is to automate the tracking of Fibonacci retracement levels across a large list of stocks, alerting you when prices breach key support zones.
Core Functionality:
The script calculates Fibonacci retracement levels (23.6%, 38.2%, 50%, 61.8%, 78.6%) for up to 40 tickers simultaneously. The calculation is based on the highest high and lowest low identified since a user-defined Start Time. This allows you to anchor the Fibonacci analysis to a specific market event, trend start, or time period relevant to your strategy.
What it Does For You:
Automated Watchlist Scanning: Instead of drawing Fib levels on dozens of charts, select one of the two pre-configured watchlists (up to 40 symbols each, customizable in settings) populated with popular Vietnamese stocks.
Time-Based Fibonacci: Define a Start Time in the settings. The script uses this date to find the subsequent highest high and lowest low for each symbol in your chosen watchlist, forming the basis for the Fib calculation.
Intelligent Alerts: Get notified via TradingView's alerts when the candle closing price of any stock in your active watchlist falls below the critical 38.2%, 50%, 61.8%, or 78.6% levels relative to its own high/low range since the start time. Alerts are consolidated for efficiency.
Visual Aids:
- Plots the same time-based Fibonacci levels directly on your current chart symbol for quick reference.
- Includes an optional on-chart table showing which monitored stocks are currently below key Fib levels (enable "Show Debug Info").
- Features experimental background coloring to highlight potential bullish signals on the current chart.
Configuration:
Start Time: Crucial input – sets the anchor point for Fib calculations.
WatchList Selection: Choose between WatchList #1 (Bluechip/Midcap focus) or WatchList #2 (Defensive/Other focus) using the boolean toggles.
Symbol Customization: Easily replace the default symbols with your preferred Vietnamese stocks directly in the indicator settings.
Notification Prefix: Add custom text to the beginning of your alert messages.
Alert Setup: Remember to create an alert in TradingView, selecting this indicator and the alert() condition, usually with "Once Per Bar Close" frequency.
This tool is open-source under the MPL 2.0 license. Feel free to use, modify, and learn from it.

Statistical Trailing Stop [LuxAlgo]The Statistical Trailing Stop tool offers traders a way to lock in profits in trending markets with four statistical levels based on the log-normal distribution of volatility.
The indicator also features a dashboard with statistics of all detected signals.
🔶 USAGE
The tool works out of the box, traders can adjust the data used with two parameters: data & distribution length.
By default, the tool takes volatility measures of groups of 10 candles, and statistical measures of the last 100 of these groups then traders can adjust the base level to use as trailing, the larger the level, the more resistant the tool will be to moves against the trend.
🔹 Base Levels
Traders can choose up to 4 different levels of trailing, all based on the statistical distribution of volatility.
As we can see in the chart above, each higher level is more resistant to market movements, so level 0 is the most reactive and level 3 the least.
It is up to the trader to determine the best level for each underlying, time frame and market conditions.
🔹 Dashboard
The tool provides a dashboard with the statistics of all trades, making it very easy to assess the performance of the parameters used for any given market.
As we can see on the chart, all Daily BTC signals with default parameters but different base levels, level 2 is the best performing of all four, giving a positive expectation of $2435 per trade, taking into account all long and short trades.
Of note are the long trades with a win rate of 76.47% and a risk-to-reward of 3.34, giving a positive expectation of $4839 per trade, with winners having an average duration of 210 days and losers 32 days.
This, compared to short trades with negative expectation, speaks to the uptrend bias of this particular market.
🔶 SETTINGS
Data Length: Select how many bars to use per data point
Distribution Length: Select how many data points the distribution will have
Base Level: Choose between 4 different trailing levels
🔹 Dashboard
Show Statistics: Enable/disable dashboard
Position: Select dashboard position
Size: Select dashboard size

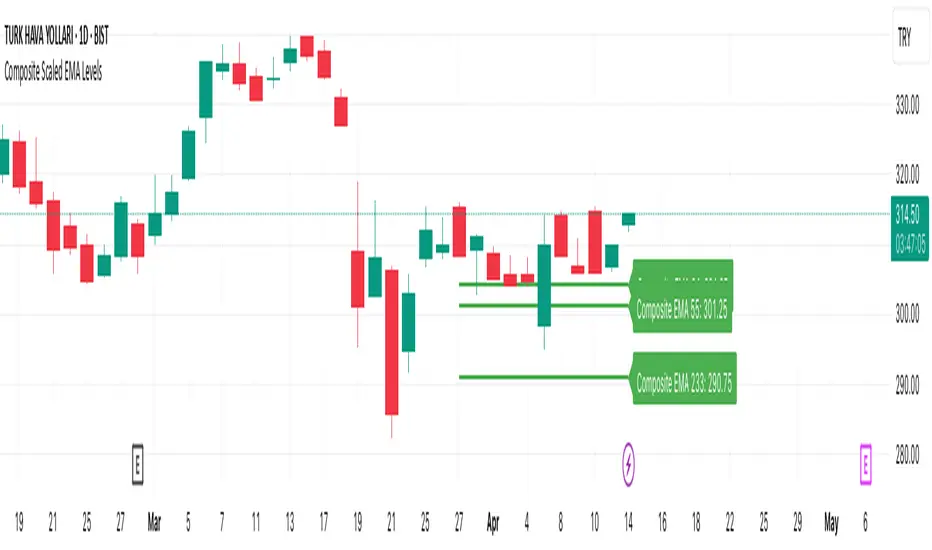
Composite Scaled EMA LevelsComposite Scaled EMA Levels Indicator
This TradingView Pine Script indicator calculates a “composite EMA” that compares the closing price of the current asset with that of the XU100 index and scales the EMA values to the XU100 level. It then visualizes these computed levels as horizontal lines on the chart with corresponding labels.
Key Components:
Inputs and Data Retrieval:
Length Input: The user defines a parameter length (default is 10) which determines over how many bars the horizontal line is drawn.
Data Collection:
The daily closing price of the current symbol (current_close) is retrieved using request.security().
The daily closing price of the XU100 index (xu100) is also retrieved.
A ratio is computed as current_close / xu100. This ratio serves as the basis for calculating the composite EMAs.
EMA Calculations:
The indicator computes Exponential Moving Averages (EMAs) on the ratio for specific periods.
In the provided version, the script calculates EMAs for three periods (34, 55, and 233), though you can easily expand this to other periods if needed.
Each computed EMA (for instance, EMA34, EMA55, EMA233) is then scaled by multiplying it with the XU100 index’s close, converting it to a price level that is meaningful on the chart.
Drawing Horizontal Lines:
Instead of using the standard plot() function, the script uses line.new() to draw horizontal lines representing the scaled EMA values over the last “length” bars.
Before drawing new lines, any existing lines and labels are deleted to ensure that only the most current values are shown.
Adding Labels to Lines:
The script creates a label for each EMA using label.new(), placing the label at the current bar (i.e., the rightmost position on the chart) using label.style_label_left so that the text appears to the right of the line.
The label displays the name of the composite EMA (e.g., "Composite EMA 34") along with its current scaled value.
Visualization:
The horizontal lines and labels provide a visual reference for the composite EMA levels. These lines help traders see critical support/resistance levels derived from the relationship between the current asset and the XU100 index.
Colors are assigned for clarity (for example, the EMA lines in this version use green).
Summary:
The Composite Scaled EMA Levels indicator is designed to help traders analyze the relationship between an asset’s price and the broader market index (XU100) by calculating a ratio and then applying EMAs on that ratio. By scaling these EMAs back to price levels and displaying them as horizontal lines with clear labels on the chart, the indicator offers a visual tool to assess trend direction and potential support or resistance levels. This can assist in making informed trading decisions based on composite trend analysis.
Average Body RangeThe Average Body Range (ABR) indicator calculates the average size of a candle's real body over a specified period. Unlike the traditional Average Daily Range (ADR), which measures the full range from high to low, the ABR focuses solely on the absolute difference between the open and close of each bar. This provides insight into market momentum and trading activity by reflecting how much price is actually moving from open to close , not just in total.
This indicator is especially useful for identifying:
Periods of strong directional movement (larger body sizes)
Low-volatility or indecisive markets (smaller body sizes)
Changes in trend conviction or momentum
Customization:
Length: Number of bars used to compute the average (default: 14)
Use ABR to enhance your understanding of price behavior and better time entries or exits based on market strength.
RTH and ETH RangesKey Functions :
Visualizes Regular Trading Hours (RTH) and Extended Trading Hours (ETH) price ranges
Tracks session highs, lows, and 50% levels where significant market reactions occur
Detects breakouts beyond previous session extremes
Trading Applications :
Exposes potential liquidity raids at session boundaries where smart money targets stop orders
Identifies critical price thresholds where institutional activity concentrates
Highlights divergences between RTH and ETH behavior that precede directional moves
Provides measurement of session volatility differences
Maps key price levels for objective entry and exit parameters
Reveals market dynamics at session transitions where institutional positioning changes

Dirty Market IndexThis indicator is designed to out an index displaying the level of dirtiness in market.
This level is defined by:
Sum of shadow lengths of last n candles (n is input and user can change it, it's 100 by default)
divided by
Sum of full candle bodies of last n candles (high - low)
This factor indicates how many percents of the market movement has been placed in shadows of candles, the higher this number, the dirtier market would be.

3 Candles Gap3 Candle Gap Indicator is made to detect these types of patterns:
1. 3 consecutive bullish or bearish candles
2. the middle candle true body (body excluding shadows) has a part that is not covered by previous and next candle shadows (gap)
This pattern helps traders to detect candles where price has moved in a direction and gap has formed (price is not covered by previous or next candles shadows), this is a signal showing price momentum where one side (bulls/bears) is so powerful at moving the price that the other side (bears/bulls) can't get price back to cover the gap.
This indicator has "repainting" by 1 candle which means, it uses the data from future to work, however this future data does not go further than 1 candle.
Leavitt Convolution ProbabilityTechnical Analysis of Markets with Leavitt Market Projections and Associated Convolution Probability
The aim of this study is to present an innovative approach to market analysis based on the research "Leavitt Market Projections." This technical tool combines one indicator and a probability function to enhance the accuracy and speed of market forecasts.
Key Features
Advanced Indicators : the script includes the Convolution line and a probability oscillator, designed to anticipate market changes. These indicators provide timely signals and offer a clear view of price dynamics.
Convolution Probability Function : The Convolution Probability (CP) is a key element of the script. A significant increase in this probability often precedes a market decline, while a decrease in probability can signal a bullish move. The Convolution Probability Function:
At each bar, i, the linear regression routine finds the two parameters for the straight line: y=mix+bi.
Standard deviations can be calculated from the sequence of slopes, {mi}, and intercepts, {bi}.
Each standard deviation has a corresponding probability.
Their adjusted product is the Convolution Probability, CP. The construction of the Convolution Probability is straightforward. The adjusted product is the probability of one times 1− the probability of the other.
Customizable Settings : Users can define oversold and overbought levels, as well as set an offset for the linear regression calculation. These options allow for tailoring the script to individual trading strategies and market conditions.
Statistical Analysis : Each analyzed bar generates regression parameters that allow for the calculation of standard deviations and associated probabilities, providing an in-depth view of market dynamics.
The results from applying this technical tool show increased accuracy and speed in market forecasts. The combination of Convolution indicator and the probability function enables the identification of turning points and the anticipation of market changes.
Additional information:
Leavitt, in his study, considers the SPY chart.
When the Convolution Probability (CP) is high, it indicates that the probability P1 (related to the slope) is high, and conversely, when CP is low, P1 is low and P2 is high.
For the calculation of probability, an approximate formula of the Cumulative Distribution Function (CDF) has been used, which is given by: CDF(x)=21(1+erf(σ2x−μ)) where μ is the mean and σ is the standard deviation.
For the calculation of probability, the formula used in this script is: 0.5 * (1 + (math.sign(zSlope) * math.sqrt(1 - math.exp(-0.5 * zSlope * zSlope))))
Conclusions
This study presents the approach to market analysis based on the research "Leavitt Market Projections." The script combines Convolution indicator and a Probability function to provide more precise trading signals. The results demonstrate greater accuracy and speed in market forecasts, making this technical tool a valuable asset for market participants.

Drawdown Visualizer v1.0Drawdown Visualizer
The Drawdown Visualizer tracks the percentage decline from all-time highs, providing valuable insights into market corrections and potential buying opportunities.
Key Features:
1) Real-Time Drawdown Tracking: The indicator continuously calculates and displays the current percentage drawdown from the all-time high price, color-coded from green (minimal drawdown) to red (severe drawdown) for instant visual feedback.
2) Maximum Drawdown Detection: Permanently tracks and displays the maximum historical drawdown encountered during the analyzed period, helping traders understand worst-case scenarios.
3) Statistical Analysis: Calculates and displays three important statistical measures:
* Average Drawdown: The mean value of all drawdowns recorded
* Median Drawdown: The middle value in the sorted list of all drawdowns, providing insight
into typical decline patterns
* Normal Drawdown Range: Visualizes the expected range of typical drawdowns based on
statistical standard deviation
Practical Applications:
1) Risk Management: Understand typical and extreme drawdowns to set appropriate stop-loss levels
2) Market Context: Gain perspective on whether current corrections are normal or exceptional
3) Entry Point Analysis: Identify potential buying opportunities when drawdowns reach statistical extremes

Daily LevelsOverview:
The Daily Levels indicator plots key price levels from the previous trading day, including the high, low, median (pivot), and projected extensions. These levels help traders identify potential support/resistance zones and anticipate breakout or reversal opportunities.
Key Features:
✅ Previous Day High & Low – Visualizes the prior day’s high and low as dynamic support/resistance levels.
✅ Median (Pivot) Line – Calculates the midpoint between the previous day’s high and low, acting as a key intraday reference.
✅ Projected Levels – Extends the high/low range symmetrically above and below the median, highlighting potential breakout zones.
✅ Customizable Display – Toggle visibility, adjust colors, and modify line styles (solid, dotted, dashed).
✅ Price Labels – Clear on-chart labels showing exact price values for quick reference.
✅ Built-in Alerts – Get notified when price crosses any of the key levels.
How to Use:
Trend Identification: If price holds above the median, the bias is bullish; below suggests bearish momentum.
Breakout Trading: Watch for moves beyond the projected levels for potential continuation.
Mean Reversion: Fade moves toward the previous day’s high/low if the median holds as support/resistance.
Ideal For:
Day Traders – Intraday support/resistance levels.
Swing Traders – Context for multi-day trends.
Breakout/Reversal Strategies – Clear levels for trade triggers.
Settings Recommendations:
High/Low Lines: Use semi-transparent colors (e.g., green/red) for clarity.
Projections: Helpful for anticipating extended moves (e.g., teal for upper, orange for lower).
Alerts: Enable notifications for key crosses (e.g., median or high/low breaks).

Day’s Open ForecastOverview
This Pine Script indicator combines two primary components:
1. Day’s Open Forecast:
o Tracks historical daily moves (up and down) from the day’s open.
o Calculates average up and down moves over a user-defined lookback period.
o Optionally includes standard deviation adjustments to forecast potential intraday levels.
o Plots lines on the chart for the forecasted up and down moves from the current day's open.
2. Session VWAP:
o Allows you to specify a custom trading session (by time range and UTC offset).
o Calculates and plots a Volume-Weighted Average Price (VWAP) during that session.
By combining these two features, you can gauge potential intraday moves relative to historical behavior from the open, while also tracking a session-specific VWAP that can act as a dynamic support/resistance reference.
How the Code Works
1. Collect Daily Moves
o The script detects when a new day starts using time("D").
o Once a new day is detected, it stores the previous day’s up-move (dayHigh - dayOpen) and down-move (dayOpen - dayLow) into arrays.
o These arrays keep track of the last N days (default: 126) of up/down move data.
2. Compute Statistics
o The script computes the average (f_average()) of up-moves and down-moves over the stored period.
o It also computes the standard deviation (f_stddev()) of up/down moves for optional “forecast bands.”
3. Forecast Lines
o Plots the current day’s open.
o Plots the average forecast lines above and below the open (Avg Up Move Level and Avg Down Move Level).
o If standard deviation is enabled, plots additional lines (Avg+StdDev Up and Avg+StdDev Down).
4. Session VWAP
o The script detects the start of a user-defined session (via input.session) and resets accumulation of volume and the numerator for VWAP.
o As each bar in the session updates, it accumulates volume (vwapCumulativeVolume) and a price-volume product (vwapCumulativeNumerator).
o The session VWAP is then calculated as (vwapCumulativeNumerator / vwapCumulativeVolume) and plotted.
5. Visualization Options
o Users can toggle standard deviation usage, historical up/down moves plotting, and whether to show the forecast “bands.”
o The vwapSession and vwapUtc inputs let you adjust which session (and time zone offset) the VWAP is calculated for.
________________________________________
How to Use This Indicator on TradingView
1. Create a New Script
o Open TradingView, then navigate to Pine Editor (usually found at the bottom of the chart).
o Copy and paste the entire code into the editor.
2. Save and Add to Chart
o Click Save (give it a relevant title if you wish), then click Add to chart.
o The indicator will appear on your chart with the forecast lines and VWAP.
o By default, it is overlayed on the price chart (because of overlay=true).
3. Customize Inputs
o In the indicator’s settings, you can:
Change lookback days (default: 126).
Enable or disable standard deviation (Include Standard Deviation in Forecast?).
Adjust the standard deviation multiplier.
Choose whether to plot bands (Plot Bands with Averages/StdDev?).
Plot historical moves if desired (Plot Historical Up/Down Moves for Reference?).
Set your custom session and UTC offset for the VWAP calculation.
4. Interpretation
o “Current Day Open” is simply today’s open price on your chart.
o Up/Down Move Lines: Indicate a potential forecast based on historical averages.
If standard deviation is enabled, the second set of lines acts as an extended range.
o VWAP: Helpful for determining intraday price equilibrium over the specified session.
Important Notes / Best Practices
• The script only updates the historical up/down move data once per day (when a new day starts).
• The VWAP portion resets at the start of the specified session each day.
• Standard deviation multiplies the average up/down range, giving you a sense of “volatility range” around the day’s open.
• Adjust the lookback length (dayCount) to balance how many days of data you want to average. More days = smoother but possibly slower to adapt; fewer days = more reactive but potentially less reliable historically.
Educational & Liability Disclaimers
1. Educational Disclaimer
o The information provided by this indicator is for educational and informational purposes only. It is a technical analysis tool intended to demonstrate how to use historical data and basic statistics in Pine Script.
2. No Financial Advice
o This script does not constitute financial or investment advice. All examples and explanations are solely illustrative. You should always do your own analysis before making any investment decisions.
3. No Liability
o The author of this script is not liable for any losses or damages—monetary or otherwise—that may occur from the application of this script.
o Past performance does not guarantee future results, and you should never invest money you cannot afford to lose.
By adding this indicator to your TradingView chart, you acknowledge and accept that you alone are responsible for your own trading decisions.
Enjoy using the “Day’s Open Forecast” and Session VWAP for better market insights!

Trend Targets [AlgoAlpha]OVERVIEW
This script combines a smoothed trend-following model with dynamic price rejection logic and ATR-based target projection to give traders a complete visual framework for trading trend continuations. It overlays on price and automatically detects potential trend shifts, confirms rejections near dynamic support/resistance, and displays calculated stop-loss and take-profit levels to support structured risk-reward management. Unlike traditional indicators that only show trend direction or signal entries, this tool brings together a unique mix of signal validation, volatility-aware positioning, and layered profit-taking to guide decision-making with more context.
CONCEPTS
The core trend logic is built on a custom Supertrend that uses an ATR-based band structure with long smoothing chains—first through a WMA, then an EMA—allowing the trend line to respond to major shifts while ignoring noise. A key addition is the use of rejection logic: the script looks for consolidation candles that "hug" the smoothed trend line and counts how many consecutive bars reject from it. This behavior often precedes significant moves. A user-defined threshold filters out weak tests and highlights only meaningful rejections.
FEATURES
Trend Detection : Automatically identifies trend direction using a smoothed Supertrend (WMA + EMA), with shape markers on trend shifts and color-coded bars for clarity.
Rejection Signals : Detects price rejections at the trend line after a user-defined number of consolidation bars; plots ▲/▼ icons to highlight strong continuation setups.
Target Projection : On trend confirmation, plots entry, stop-loss (ATR-based), and three dynamic take-profit levels based on customizable multiples.
Dynamic Updates : All levels (entry, SL, TP1–TP3) auto-adjust based on volatility and are labeled in real time on the chart.
Customization : Users can tweak trend parameters, rejection confirmation count, SL/TP ratios, smoothing lengths, and appearance settings.
Alerts : Built-in alerts for trend changes, rejection events, and when TP1, TP2, or TP3 are reached.
Chart Overlay : Plots directly on price chart with minimal clutter and clearly labeled levels for easy trading.
USAGE
Start by tuning the Supertrend factor and ATR period to fit your asset and timeframe—higher values will catch bigger swings, lower values catch faster moves. The confirmation count should match how tightly you want to filter rejection behavior—higher values make signals rarer but stronger. When the trend shifts, the indicator colors the bars and line accordingly, and if enabled, plots the full entry-TP-SL structure. Rejection markers appear only after enough qualifying bars confirm price pressure at the trend line. This is especially useful for continuation plays where price retests the trend but fails to break it. All calculations are based on volatility (ATR), so targets naturally adjust with market conditions. Add alerts to get notified of important signals even when away from the chart.

Multi-Timeframe Anchored VWAP Valuation# Multi-Timeframe Anchored VWAP Valuation
## Overview
This indicator provides a unique perspective on potential price valuation by comparing the current price to the Volume Weighted Average Price (VWAP) anchored to the start of multiple timeframes: Weekly, Monthly, Quarterly, and Yearly. It synthesizes these comparisons into a single oscillator value, helping traders gauge if the current price is potentially extended relative to significant volume-weighted levels.
## Core Concept & Calculation
1. **Anchored VWAP:** The script calculates the VWAP separately for the current Week, Month, Quarter (3 Months), and Year (12 Months), starting the calculation from the first bar of each period.
2. **Price Deviation:** It measures how far the current `close` price is from each of these anchored VWAPs. This distance is measured in terms of standard deviations calculated *within* that specific anchor period (e.g., how many weekly standard deviations the price is away from the weekly VWAP).
3. **Deviation Score (Multiplier):** Based on this standard deviation distance, a score is assigned. The further the price is from the VWAP (in terms of standard deviations), the higher the absolute score. The indicator uses linear interpolation to determine scores between the standard deviation levels (defaulted at 1, 2, and 3 standard deviations corresponding to scores of +/-2, +/-3, +/-4, with a score of 1 at the VWAP).
4. **Timeframe Weighting:** Longer timeframes are considered more significant. The deviation scores are multiplied by fixed scalars: Weekly (x1), Monthly (x2), Quarterly (x3), Yearly (x4).
5. **Final Valuation Metric:** The weighted scores from all four timeframes are summed up to produce the final oscillator value plotted in the indicator pane.
## How to Interpret and Use
* **Histogram (Indicator Pane):**
* The main output is the histogram representing the `Final Valuation Metric`.
* **Positive Values:** Suggest the price is generally trading above its volume-weighted averages across the timeframes, potentially indicating strength or relative "overvaluation."
* **Negative Values:** Suggest the price is generally trading below its volume-weighted averages, potentially indicating weakness or relative "undervaluation."
* **Values Near Zero:** Indicate the price is relatively close to its volume-weighted averages.
* **Histogram Color:**
* The color of the histogram bars provides context based on the metric's *own recent history*.
* **Green (Positive Color):** The metric is currently *above* its recent average plus a standard deviation band (dynamic upper threshold). This highlights potentially significant "overvalued" readings relative to its normal range.
* **Red (Negative Color):** The metric is currently *below* its recent average minus a standard deviation band (dynamic lower threshold). This highlights potentially significant "undervalued" readings relative to its normal range.
* **Gray (Neutral Color):** The metric is within its typical recent range (between the dynamic upper and lower thresholds).
* **Orange Line:** Plots the moving average of the `Final Valuation Metric` itself (based on the "Threshold Lookback Period"), serving as the centerline for the dynamic thresholds.
* **On-Chart Table:**
* Provides a detailed breakdown for transparency.
* Shows the calculated VWAP, the raw deviation multiplier score, and the final weighted (adjusted) metric for each individual timeframe (W, M, Q, Y).
* Displays the current price, the final combined metric value, and a textual interpretation ("Overvalued", "Undervalued", "Neutral") based on the dynamic thresholds.
## Potential Use Cases
* Identifying potential exhaustion points when the indicator reaches statistically high (green) or low (red) levels relative to its recent history.
* Assessing whether price trends are supported by underlying volume-weighted average prices across multiple timeframes.
* Can be used alongside other technical analysis tools for confirmation.
## Settings
* **Calculation Settings:**
* `STDEV Level 1`: Adjusts the 1st standard deviation level (default 1.0).
* `STDEV Level 2`: Adjusts the 2nd standard deviation level (default 2.0).
* `STDEV Level 3`: Adjusts the 3rd standard deviation level (default 3.0).
* **Interpretation Settings:**
* `Threshold Lookback Period`: Defines the number of bars used to calculate the average and standard deviation of the final metric for dynamic thresholds (default 200).
* `Threshold StDev Multiplier`: Controls how many standard deviations above/below the metric's average are used to set the "Overvalued"/"Undervalued" thresholds (default 1.0).
* **Table Settings:** Customize the position and colors of the data table displayed on the chart.
## Important Considerations
* This indicator measures price deviation relative to *anchored* VWAPs and its *own historical range*. It is not a standalone trading system.
* The interpretation of "Overvalued" and "Undervalued" is relative to the indicator's logic and calculations; it does not guarantee future price movement.
* Like all indicators, past performance is not indicative of future results. Use this tool as part of a comprehensive analysis and risk management strategy.
* The anchored VWAP and Standard Deviation values reset at the beginning of each respective period (Week, Month, Quarter, Year).

Intrinsic Event (Multi DC OS)Overview
This indicator implements an event-based approach to analyze price movements in the foreign exchange market, inspired by the intrinsic time framework introduced in Fractals and Intrinsic Time - A Challenge to Econometricians by U. A. Müller et al. (1995). It identifies significant price events using an intrinsic time perspective and supports multi-agent analysis to reflect the heterogeneous nature of financial markets. The script plots these events as lines and labels on the chart, offering a visual tool for traders to understand market dynamics at different scales.
Key Features
Intrinsic Events : The indicator detects directional change (DC) and overshoot (OS) events based on user-defined thresholds (delta), aligning with the paper’s concept of intrinsic time (Section 6). Intrinsic time redefines time based on market activity, expanding during volatile periods and contracting during inactive ones, rather than relying on a physical clock.
Multi-Agent Analysis : Supports up to five agents, each with its own threshold and color settings, reflecting the heterogeneous market hypothesis (Section 5). This allows the indicator to capture the perspectives of market participants with different time horizons, such as short-term FX dealers and long-term central banks.
How It Works
Intrinsic Events Detection : The script identifies two types of events using intrinsic time principles:
Directional Change (DC) : Triggered when the price reverses by the threshold (delta) against the current trend (e.g., a drop by delta in an uptrend signals a "Down DC").
Overshoot (OS) : Occurs when the price continues in the trend direction by the threshold (e.g., a rise by delta in an uptrend signals an "Up OS").
DC events are plotted as solid lines, and OS events as dashed lines, with labels like "Up DC" or "OS Down" for clarity. The label style adjusts based on the trend to ensure visibility.
Multi-Agent Setup : Each agent operates independently with its own threshold, mimicking market participants with varying time horizons (Section 5). Smaller thresholds detect frequent, short-term events, while larger thresholds capture broader, long-term movements.
Settings
Each agent can be configured with:
Enable Agent : Toggle the agent on or off.
Threshold (%) : The percentage threshold (delta) for detecting DC and OS events (default values: 0.1%, 0.2%, 0.5%, 1%, 2% for agents 1–5).
Up Mode Color : Color for lines and labels in up mode (DC events).
Down Mode Color : Color for lines and labels in down mode (OS events).
Usage Notes
This indicator is designed for the foreign exchange market, leveraging its high liquidity, as noted in the paper (Section 1). Adjust the threshold values based on the instrument’s volatility—higher volatility leads to more intrinsic events (Section 4). It can be adapted to other markets where event-based analysis applies.
Reference
The methodology is based on:
Fractals and Intrinsic Time - A Challenge to Econometricians by U. A. Müller, M. M. Dacorogna, R. D. Davé, O. V. Pictet, R. B. Olsen, and J. R. Ward (June 28, 1995). Olsen & Associates Preprint.

Correlation Heatmap█ OVERVIEW
This indicator creates a correlation matrix for a user-specified list of symbols based on their time-aligned weekly or monthly price returns. It calculates the Pearson correlation coefficient for each possible symbol pair, and it displays the results in a symmetric table with heatmap-colored cells. This format provides an intuitive view of the linear relationships between various symbols' price movements over a specific time range.
█ CONCEPTS
Correlation
Correlation typically refers to an observable statistical relationship between two datasets. In a financial time series context, it usually represents the extent to which sampled values from a pair of datasets, such as two series of price returns, vary jointly over time. More specifically, in this context, correlation describes the strength and direction of the relationship between the samples from both series.
If two separate time series tend to rise and fall together proportionally, they might be highly correlated. Likewise, if the series often vary in opposite directions, they might have a strong anticorrelation . If the two series do not exhibit a clear relationship, they might be uncorrelated .
Traders frequently analyze asset correlations to help optimize portfolios, assess market behaviors, identify potential risks, and support trading decisions. For instance, correlation often plays a key role in diversification . When two instruments exhibit a strong correlation in their returns, it might indicate that buying or selling both carries elevated unsystematic risk . Therefore, traders often aim to create balanced portfolios of relatively uncorrelated or anticorrelated assets to help promote investment diversity and potentially offset some of the risks.
When using correlation analysis to support investment decisions, it is crucial to understand the following caveats:
• Correlation does not imply causation . Two assets might vary jointly over an analyzed range, resulting in high correlation or anticorrelation in their returns, but that does not indicate that either instrument directly influences the other. Joint variability between assets might occur because of shared sensitivities to external factors, such as interest rates or global sentiment, or it might be entirely coincidental. In other words, correlation does not provide sufficient information to identify cause-and-effect relationships.
• Correlation does not predict the future relationship between two assets. It only reflects the estimated strength and direction of the relationship between the current analyzed samples. Financial time series are ever-changing. A strong trend between two assets can weaken or reverse in the future.
Correlation coefficient
A correlation coefficient is a numeric measure of correlation. Several coefficients exist, each quantifying different types of relationships between two datasets. The most common and widely known measure is the Pearson product-moment correlation coefficient , also known as the Pearson correlation coefficient or Pearson's r . Usually, when the term "correlation coefficient" is used without context, it refers to this correlation measure.
The Pearson correlation coefficient quantifies the strength and direction of the linear relationship between two variables. In other words, it indicates how consistently variables' values move together or in opposite directions in a proportional, linear manner. Its formula is as follows:
𝑟(𝑥, 𝑦) = cov(𝑥, 𝑦) / (𝜎𝑥 * 𝜎𝑦)
Where:
• 𝑥 is the first variable, and 𝑦 is the second variable.
• cov(𝑥, 𝑦) is the covariance between 𝑥 and 𝑦.
• 𝜎𝑥 is the standard deviation of 𝑥.
• 𝜎𝑦 is the standard deviation of 𝑦.
In essence, the correlation coefficient measures the covariance between two variables, normalized by the product of their standard deviations. The coefficient's value ranges from -1 to 1, allowing a more straightforward interpretation of the relationship between two datasets than what covariance alone provides:
• A value of 1 indicates a perfect positive correlation over the analyzed sample. As one variable's value changes, the other variable's value changes proportionally in the same direction .
• A value of -1 indicates a perfect negative correlation (anticorrelation). As one variable's value increases, the other variable's value decreases proportionally.
• A value of 0 indicates no linear relationship between the variables over the analyzed sample.
Aligning returns across instruments
In a financial time series, each data point (i.e., bar) in a sample represents information collected in periodic intervals. For instance, on a "1D" chart, bars form at specific times as successive days elapse.
However, the times of the data points for a symbol's standard dataset depend on its active sessions , and sessions vary across instrument types. For example, the daily session for NYSE stocks is 09:30 - 16:00 UTC-4/-5 on weekdays, Forex instruments have 24-hour sessions that span from 17:00 UTC-4/-5 on one weekday to 17:00 on the next, and new daily sessions for cryptocurrencies start at 00:00 UTC every day because crypto markets are consistently open.
Therefore, comparing the standard datasets for different asset types to identify correlations presents a challenge. If two symbols' datasets have bars that form at unaligned times, their correlation coefficient does not accurately describe their relationship. When calculating correlations between the returns for two assets, both datasets must maintain consistent time alignment in their values and cover identical ranges for meaningful results.
To address the issue of time alignment across instruments, this indicator requests confirmed weekly or monthly data from spread tickers constructed from the chart's ticker and another specified ticker. The datasets for spreads are derived from lower-timeframe data to ensure the values from all symbols come from aligned points in time, allowing a fair comparison between different instrument types. Additionally, each spread ticker ID includes necessary modifiers, such as extended hours and adjustments.
In this indicator, we use the following process to retrieve time-aligned returns for correlation calculations:
1. Request the current and previous prices from a spread representing the sum of the chart symbol and another symbol ( "chartSymbol + anotherSymbol" ).
2. Request the prices from another spread representing the difference between the two symbols ( "chartSymbol - anotherSymbol" ).
3. Calculate half of the difference between the values from both spreads ( 0.5 * (requestedSum - requestedDifference) ). The results represent the symbol's prices at times aligned with the sample points on the current chart.
4. Calculate the arithmetic return of the retrieved prices: (currentPrice - previousPrice) / previousPrice
5. Repeat steps 1-4 for each symbol requiring analysis.
It's crucial to note that because this process retrieves prices for a symbol at times consistent with periodic points on the current chart, the values can represent prices from before or after the closing time of the symbol's usual session.
Additionally, note that the maximum number of weeks or months in the correlation calculations depends on the chart's range and the largest time range common to all the requested symbols. To maximize the amount of data available for the calculations, we recommend setting the chart to use a daily or higher timeframe and specifying a chart symbol that covers a sufficient time range for your needs.
█ FEATURES
This indicator analyzes the correlations between several pairs of user-specified symbols to provide a structured, intuitive view of the relationships in their returns. Below are the indicator's key features:
Requesting a list of securities
The "Symbol list" text box in the indicator's "Settings/Inputs" tab accepts a comma-separated list of symbols or ticker identifiers with optional spaces (e.g., "XOM, MSFT, BITSTAMP:BTCUSD"). The indicator dynamically requests returns for each symbol in the list, then calculates the correlation between each pair of return series for its heatmap display.
Each item in the list must represent a valid symbol or ticker ID. If the list includes an invalid symbol, the script raises a runtime error.
To specify a broker/exchange for a symbol, include its name as a prefix with a colon in the "EXCHANGE:SYMBOL" format. If a symbol in the list does not specify an exchange prefix, the indicator selects the most commonly used exchange when requesting the data.
Note that the number of symbols allowed in the list depends on the user's plan. Users with non-professional plans can compare up to 20 symbols with this indicator, and users with professional plans can compare up to 32 symbols.
Timeframe and data length selection
The "Returns timeframe" input specifies whether the indicator uses weekly or monthly returns in its calculations. By default, its value is "1M", meaning the indicator analyzes monthly returns. Note that this script requires a chart timeframe lower than or equal to "1M". If the chart uses a higher timeframe, it causes a runtime error.
To customize the length of the data used in the correlation calculations, use the "Max periods" input. When enabled, the indicator limits the calculation window to the number of periods specified in the input field. Otherwise, it uses the chart's time range as the limit. The top-left corner of the table shows the number of confirmed weeks or months used in the calculations.
It's important to note that the number of confirmed periods in the correlation calculations is limited to the largest time range common to all the requested datasets, because a meaningful correlation matrix requires analyzing each symbol's returns under the same market conditions. Therefore, the correlation matrix can show different results for the same symbol pair if another listed symbol restricts the aligned data to a shorter time range.
Heatmap display
This indicator displays the correlations for each symbol pair in a heatmap-styled table representing a symmetric correlation matrix. Each row and column corresponds to a specific symbol, and the cells at their intersections correspond to symbol pairs . For example, the cell at the "AAPL" row and "MSFT" column shows the weekly or monthly correlation between those two symbols' returns. Likewise, the cell at the "MSFT" row and "AAPL" column shows the same value.
Note that the main diagonal cells in the display, where the row and column refer to the same symbol, all show a value of 1 because any series of non-na data is always perfectly correlated with itself.
The background of each correlation cell uses a gradient color based on the correlation value. By default, the gradient uses blue hues for positive correlation, orange hues for negative correlation, and white for no correlation. The intensity of each blue or orange hue corresponds to the strength of the measured correlation or anticorrelation. Users can customize the gradient's base colors using the inputs in the "Color gradient" section of the "Settings/Inputs" tab.
█ FOR Pine Script® CODERS
• This script uses the `getArrayFromString()` function from our ValueAtTime library to process the input list of symbols. The function splits the "string" value by its commas, then constructs an array of non-empty strings without leading or trailing whitespaces. Additionally, it uses the str.upper() function to convert each symbol's characters to uppercase.
• The script's `getAlignedReturns()` function requests time-aligned prices with two request.security() calls that use spread tickers based on the chart's symbol and another symbol. Then, it calculates the arithmetic return using the `changePercent()` function from the ta library. The `collectReturns()` function uses `getAlignedReturns()` within a loop and stores the data from each call within a matrix . The script calls the `arrayCorrelation()` function on pairs of rows from the returned matrix to calculate the correlation values.
• For consistency, the `getAlignedReturns()` function includes extended hours and dividend adjustment modifiers in its data requests. Additionally, it includes other settings inherited from the chart's context, such as "settlement-as-close" preferences.
• A Pine script can execute up to 40 or 64 unique `request.*()` function calls, depending on the user's plan. The maximum number of symbols this script compares is half the plan's limit, because `getAlignedReturns()` uses two request.security() calls.
• This script can use the request.security() function within a loop because all scripts in Pine v6 enable dynamic requests by default. Refer to the Dynamic requests section of the Other timeframes and data page to learn more about this feature, and see our v6 migration guide to learn what's new in Pine v6.
• The script's table uses two distinct color.from_gradient() calls in a switch structure to determine the cell colors for positive and negative correlation values. One call calculates the color for values from -1 to 0 based on the first and second input colors, and the other calculates the colors for values from 0 to 1 based on the second and third input colors.
Look first. Then leap.

Timed Reversion Markers (Custom Session Alerts)This script plots vertical histogram markers at specific intraday time points defined by the user. It is designed for traders who follow time-based reversion or breakout setups tied to predictable market behavior at key clock times, such as institutional opening moves, midday reversals, or end-of-day volatility.
Unlike traditional price-action indicators, this tool focuses purely on time-based triggers, a technique often used in time cycle analysis, market internals, and volume-timing strategies.
The indicator includes eight fully customizable time inputs, allowing users to mark any intraday minute with precision using a decimal hour format (for example, 9.55 for 9:55 AM). Each input is automatically converted into hour and minute format, and a visual histogram marker is plotted once per day at that exact time.
Example use cases:
Mark institutional session opens (e.g., 9:30, 10:00, 15:30)
Time-based mean reversion or volatility windows
Backtest recurring time-based reactions
Highlight algorithmic spike zones
The vertical plots serve as non-intrusive, high-contrast visual markers for scalping setups, session analysis, and decision-making checkpoints. All markers are displayed at the top of the chart without interfering with price candles.

Statistical OHLC Projections [neo|]█ OVERVIEW
Statistical OHLC Projections is an indicator designed to offer users a customizable deep-dive on measuring historical price levels for any timeframe. The indicator separates price into two distinct levels, "Manipulation" and "Distribution", where the idea is that for higher timeframe candles, e.g. an up-close candle, the distance from the open to the bottom of the wick would constitute the Manipulation, and the rest would be considered the Distribution. By measuring out these levels, we can gain insight on how far the market may move from higher timeframe opens to their manipulations and distributions, and apply this knowledge to our analysis.
IMPORTANT: Since levels are based on the lookback available on your chart, if the levels aren't being displayed this likely means you don't have enough lookback for your selected timeframe. To check this, enable the stat table to see how many values are available for your timeframe, and either reduce the lookback or increase your chart timeframe.
█ CONCEPTS
The core concept revolves around understanding market behavior through the lens of historical candle structure. The indicator dissects OHLC data to provide statistical boundaries of expected price movement.
- Manipulation Levels: These represent the areas typically seen as liquidity grabs or false moves where price extends in one direction before reversing.
- Distribution Levels: These highlight where the bulk of directional movement tends to occur, often following the manipulation move.
The tool aggregates this data across your selected timeframe to inform you of potential levels associated with it.
█ FEATURES
Multiple Display Types: Display statistical data through two sleek styles, areas or lines. Where areas represent the area between two customizable lookback values, and lines represent one average value.
Adjustable Timeframe Selection: Whether you want to see data based on the 1D chart, or the 1W chart, anything is possible. Simply change the timeframe on the dropdown menu and if there is sufficient lookback the indicator will adjust to your requested timeframe.
Customizable Historical Lookback: By default, the indicator will measure the average 60 values of your requested timeframe, however this may be adjusted to be higher or lower based on your preference. If you want to measure recent moves, 10-20 lookback may be better for you, or if you want more data for less volatile instruments, a value of 100 may be better.
Historical Display: Prevent historical levels from being removed by unchecking the "Remove Previous Drawings" option, this will allow you to examine how the levels previously interacted with price.
NY Midnight Anchoring: By checking the "Use NY Midnight" option, you may see the projection anchored to the New York midnight open time, which is often a significant level on indices.
Alerts: You may enable alerts for any of the indicator's provided levels to stay informed, even when off the charts.
█ How to use
To use the indicator, simply apply it to your chart and modify any of your desired inputs.
By default, the indicator will provide levels for the "1D" timeframe, with a desired lookback of 60, on most instruments and plans this can be gotten when you are on the 30 minute timeframe or above.
When price reaches or extends beyond a manipulation level, observe how it reacts and whether it rejects from that level, if it does this may be an indication that the candle for the timeframe you selected may be reversing.
█ SETTINGS AND OPTIONS
Customize the indicator’s behavior, timeframe sources, and visual appearance to fit your analysis style. Each setting has been designed with flexibility in mind, whether you're working on lower or higher timeframes.
Display Mode: Switch between different display styles for levels: - Default: Shows all statistical levels as individual lines.
- Areas: Plots filled zones between two customizable lookbacks to represent the range between them.
This is ideal for visually mapping high-probability zones of price activity.
Timeframe Settings:
- Show First/Second Timeframe: Choose to show one or both timeframe projections simultaneously.
- First Timeframe / Second Timeframe: Define the higher timeframe candle you want to base calculations on (e.g., 1D, 1W).
- Use NY Midnight: When enabled and using the daily timeframe, the levels will be anchored to the New York Midnight Open (00:00 EST), a key institutional timing reference, especially useful for indices and forex.
Calculation Settings:
- Main Lookback Period: The number of historical candles used in the statistical calculations. A lower number focuses on recent price action, while a higher number smooths results across broader history.
- First Lookback / Second Lookback: Used when “Areas” mode is selected to define the range of the shaded zone. For example, an area from 20 to 60 candles creates a band between short- and long-term price behavior averages.
Visual Settings:
- Line Style: Set your preferred visual style: Solid, Dashed, or Dotted.
- Remove Previous Drawings: When enabled, only the most recent projection is shown on the chart. Disable to retain previous levels and visually backtest their reactions over time.
Color Settings:
Customize each level independently to match your chart theme:
- Manipulation High/Low
- Distribution High/Low
- Open Level
- Label Text Color
Premium/Discount Zones:
- Enable Premium/Discount Zones: Overlay price zones above and below equilibrium to visualize potential overbought (premium) and oversold (discount) areas.
- Premium/Discount Colors: Fully customizable zone colors for clarity and emphasis.
Table Settings:
- Show Statistics Table: Adds an on-chart table summarizing key levels from your active timeframe(s).
- Table Cell Color: Set the background color of the table cells for visibility.
- Table Position: Choose from preset chart locations to position the table where it works best for your layout.
Alerts:
Stay on top of price interactions with key levels even when you're away from the charts.
- Manipulation Hits (High)
- Manipulation Hits (Low)
- Distribution Hits (High)
- Distribution Hits (Low)
