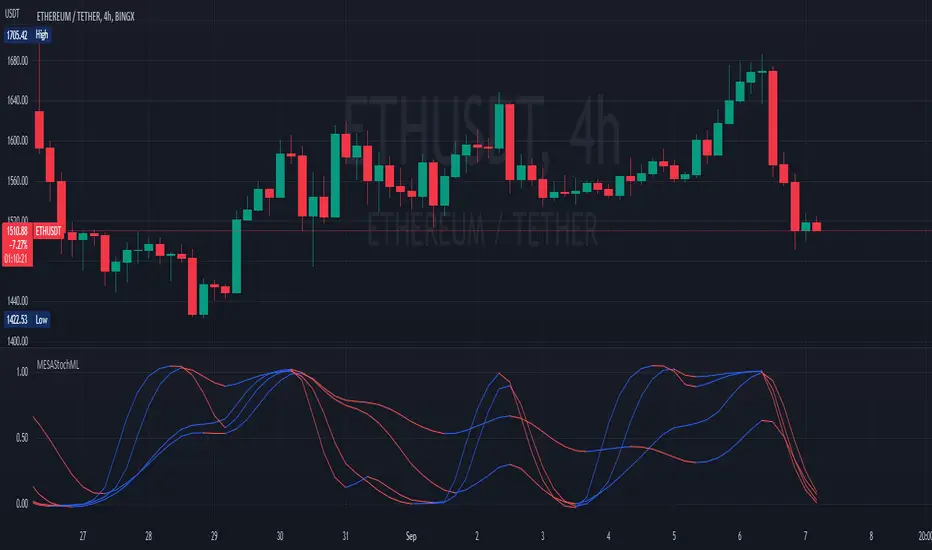
The Natural Stochastic Indicator was created by Jim Sloman and this is another indicator from his Ocean series which I will eventually publish all of them. Big thanks to @altcoinz and @tmac87 for giving me all of the source code in order to publish Jim's life work. This is another momentum indicator but unlike a traditional stochastic indicator, this one doesn't...
I trade binary options on reversals. I use this as a confluence to prove that my analysis is correct. I use this on smaller time frames given the type of trading I do. I do not use this as an entry trigger, so you should not blindly enter trades based on this solely . You were warned This indicator (on default settings) will let you know when the 1 minute, 3...
NOTE: // STOCHASTIC CODE TAKEN FROM DEFAULT INDICATOR // I HAVE ONLY MADE SOME ADJUSTMENTS FOR VISUAL AID // I MADE THIS FOR MY OWN USE BUT HAVE DECIDED TO PUBLISH AND SHARE IN CASE ANYBODY WANTS TO USE IT This is the normal default built-in Stochastic indicator which I have added some stuff for visual aid: Stochastic background turns green when K line crosses...
This is comprises of multiple popularly used indicators to help decide on whether to go long or short. This indicator will overlay the MA lines and background colours on your chart. The heikin-ashi colour will be shown as the background colour. This will help you identify a trend more easily while using bars, candles, hollow candles, etc. When the background...
Triple Stochastic RSI As the name suggests, this indicator is a combination of three stochastic RSI indicators on three different time frames. It will flash green when all three stochastics are in the lower range specified in the settings (signaling a possible bottom) and will flash red when all three stochastics are in the upper range(signaling a possible top)....
This script is a simple extension of the Built-In Stochastic RSI that also plots the RSI and prints the values of ATR and ADX of the last bar of the current timeframe to a small table in the corner. The script can be used to define the entry for a trade when the stochastics crossed and RSI is below or above 0.50 (for going long or short). OANDA:BTCUSD I like...
Due to some similarity of the Relative Strength Index(RSI) and Money Flow Index(MFI), I thought of creating a Stoch MFI inspired by the Stoch RSI. - can be used similar to the Stoch RSI - useful for pullback during trending markets and for S&R trading during ranging markets TAYOR!
Directional Movement Indicator: +DI and -DI I changed the color of the bar bars according to the crossed of +DI and -DI . It helps us to have an idea of whether the trend is continuing or not. +DI crossover to -DI barcolor is Aqua, if not bar color is Red. It also helps us to find the lowest and highest points of the graph according to the positions of Adx +DI...
Durbtrade Stoch RSI - 1) Stoch RSI A) The K line can be customized to change color based on vertical direction. B) The space between K line and D line can be filled with a color depending on whether K line is above or below the D line. C) There are color-coded, cross-over and cross-under background fills, to signal when the K line crosses the D...
This is a improved version of Premier Stochastic Oscillator (PSO), coded by "LazyBear". "The indicator was first introduced by technical analyst Lee Leibfarth in the August 2008 issue of the journal Technical Analysis of Stocks & Commodities". Inprovements: The script was update to version 4 of PineScript. Added support for diferents times frames. ...
NOTE: // STOCH RSI CODE TAKEN FROM DEFAULT INDICATOR // I HAVE ONLY MADE SOME ADJUSTMENTS FOR VISUAL AID // I MADE THIS FOR MY OWN USE BUT HAVE DECIDED TO PUBLISH AND SHARE IN CASE ANYBODY WANTS TO USE IT This is the normal default built-in Stochastic RSI indicator which I have added some stuff for visual aid: Added middle line (50) Stoch RSI background...
This is my main indicator of pricing trend reversals. It consists of two main indicators: 1. The green/red oscillator shows a general rising (green) or falling (red) price trend over a smoothed average of a number of periods (length). 2. The yellow "OverUnder Line" shows the Relative Strength Index adjusted price trend in real time. How to use it: - You will...
THE INVERSE FISHER TRANSFORM STOCH RSI HOW IT WORKS This indicator uses the inverse fisher transform on the stoch RSI for clear buying and selling signals. The stoch rsi is used to limit it in the range of 0 and 100. We subtract 50 from this to get it into the range of -50 to +50 and multiply by .1 to get it in the range of -5 to +5. We then use the 9 period...
Stochastic RVI filtered with LSMA to highlight trend and market lows.
Based on the Stochastic RSI but uses RVI (Relative Volatility Index) as source. Another great tool for finding market lows and entry points. This oscillator is also good for finding accurate diversions.
Stoch of the current tickerid in green and USDT.D:CRYPTOCAP in red.
Introducing the worlds first StochasticLSMA. A powerful Stochastic that shows trends and highlights market tops/bottoms. This may be the ultimate tool in locating tops and bottoms on any timeframe. How to tune the settings: Depending on what chart you use and what timeframe you are on it may be necessary to dial in the settings to correctly locate the tops and...
Hello, we need to open a trade in the opposite direction of the trend for this indicator. If there is a green line at the bottom, there is an uptrend. In this trend, the first exclamation mark is shorted. If there is a red line at the bottom, the trend is reversed. In this trend, a reverse transaction is opened to the first tick. In short, it is used to gain...