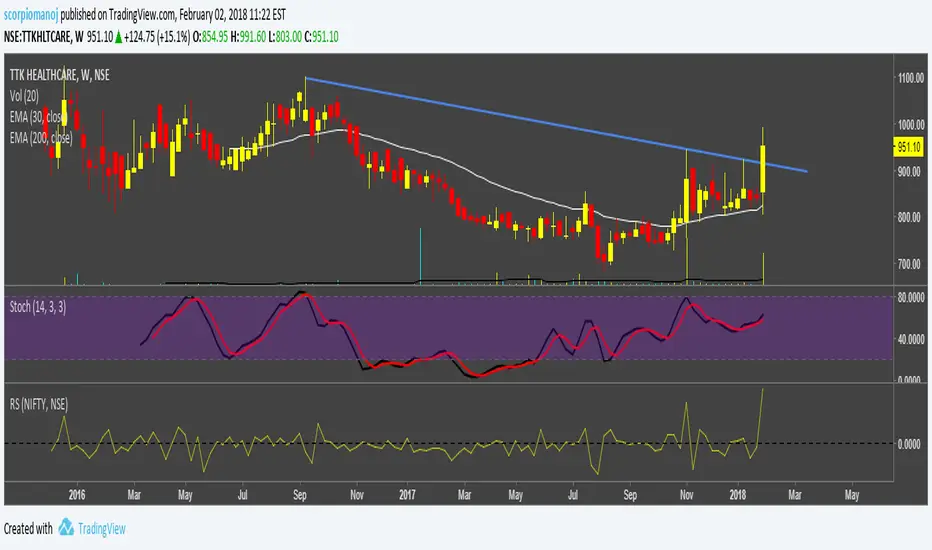
STAN WEINSTEIN RS INDEX WITH NIFTYThis is an indicator for Indian markets. It shows the relative strength of particular stock to the underlying index. The concept of this indicator is well described in Stan Weinstein's book.Pine Script®指标由scorpiomanoj提供已更新 44383
AJCrows RSIRelative Strength Index with indicator lines at 20, 30, 50, 70 and 80 marks. Use settings to show/hide these lines, and to choose appropriate colors.Pine Script®指标由aeinola提供21
TRIX ribbon w/ Up/Down colours - squattter Follow the momentum - 2/4/8hr or Daily, take your pick. Use 2 or more TFs together for greater chance of a winning trade. Also brilliant for spotting divergence. This one is my favorite indicator. Pine Script®指标由squattter提供33360
Currency StrengthRepublished: The original script violated house rules by including an external link to Backtest Rookies. Background The currency strength indicator takes up to 4 forex pairs and calculates the average strength across all pairs. The indicator uses the pair's daily percentage change to calculate the overall strength. For flexibility, it can accept any instrument as an input. This means you can use multiple instances to track various currency strengths. It was designed with the major pairs in mind but there is no reason why it cannot be used for other FX pairs. Note: The indicator defaults to GBP. When setting it up for other currencies, be sure to flag whether the currency is a counter currency or not. The code is provided free and open source. Please modify it as you see fit. Screenshots Defaults with Annotation Yen strength beating pound strength Opposing Trends Pine Script®指标由BacktestRookies提供已更新 44508
Trend Strength IndicatorThis indicator uses Heiken Ashi candle data to plot trend strength signals to your chart. Bright Green: Heiken Ashi candle data is still putting in higher lows and higher highs, and the price closed above the previous low. Dark Green: Heiken Ashi candle closed green, but had a lower low or lower high (trend weakening). Bright Red: Heiken Ashi candle data is still putting in lower lows and lower highs, and the price closed below the previous high. Dark Red: Heiken Ashi candle closed red, but had a higher low or higher high (trend weakening). Optional: I included a setting for allowing high RSI values to overrule Heiken Ashi values (disabled by default). This kind of indicator is best used for managing open positions rather than entering trades. It works on all timeframes and instruments. Feel free to contact me if you have any questions :) Regards, - Matt PS. Here's a snapshot of it against a Heiken Ashi chart for reference: Pine Script®指标由ZenAndTheArtOfTrading提供已更新 66 1.5 K
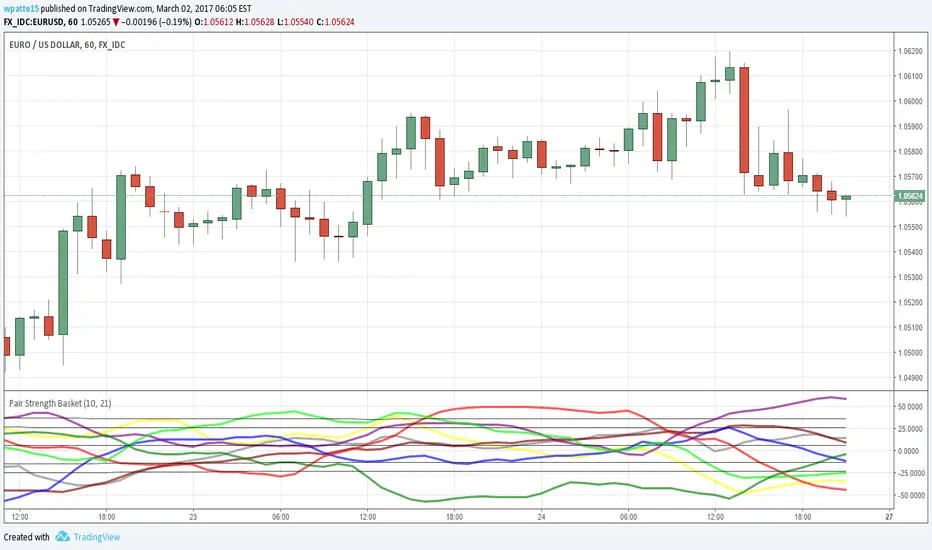
Pair Strength BasketAgain thanks to LazyBear for bringing over the wavetrend indicator and glaz for the idea of the basket of currencies. This is a power index based on the wavetrend indicator, I cut it down to 5 securities per currency since the limit of securities I could call was 40. I like to use to see which pair is the most OB/OS as it likely presents the best profit potential. AUD = Yellow CAD = Gray CHF = Maroon EUR = Blue GBP = Red JPY = Purple NZD = Lime USD = GreenPine Script®指标由wpatte15提供128
True Strength Indicator - RMAThis is the base TSI indicator with the RMA instead of the the EMA.Pine Script®指标由itsjustanalysis提供11306
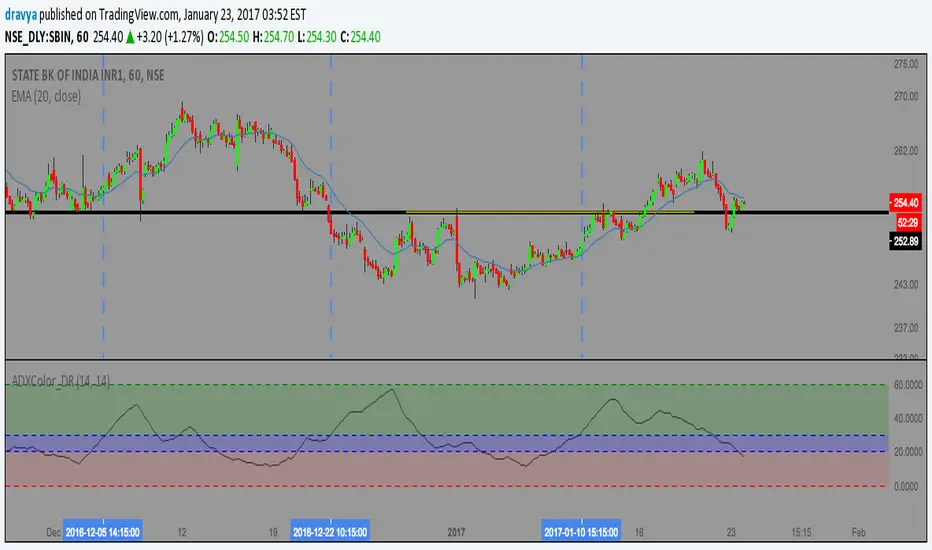
ADX Color Easy [Dravya]Script #1 So, here is my first script. This is the normal 14 period ADX, but with a color twist, to make it extremely easy on eyes. and then, easily spot the strength. ADX, as you know, shows the strength of the trend. As short term traders, we need price movement and a strong trend. How to use this script ? 1. We don't trade when ADX is in the red zone (0-20) 2. We get ready for trading when it enters the blue zone (20-30) 3. We trade when the ADX enters the green zone (>30) Simple, right ! Now, in the green zone, in which direction you should trade? Here are a few links, to help you use ADX as a strategy , www.tradingsetupsreview.com www.babypips.com Other than this, you can combine this with your own strategies. Personally, I like to use it on stocks on 1H timeframe. Thanks. Would love to hear from you. Please like it to support the project, and help spread it. Pine Script®指标由dravya提供77295
Currency Strength IndicatorSimple but effective don't pay $300 for an MT4 indicator when you can use this for free. Feel free to make it your own!Pine Script®指标由aelius提供1919 1.1 K
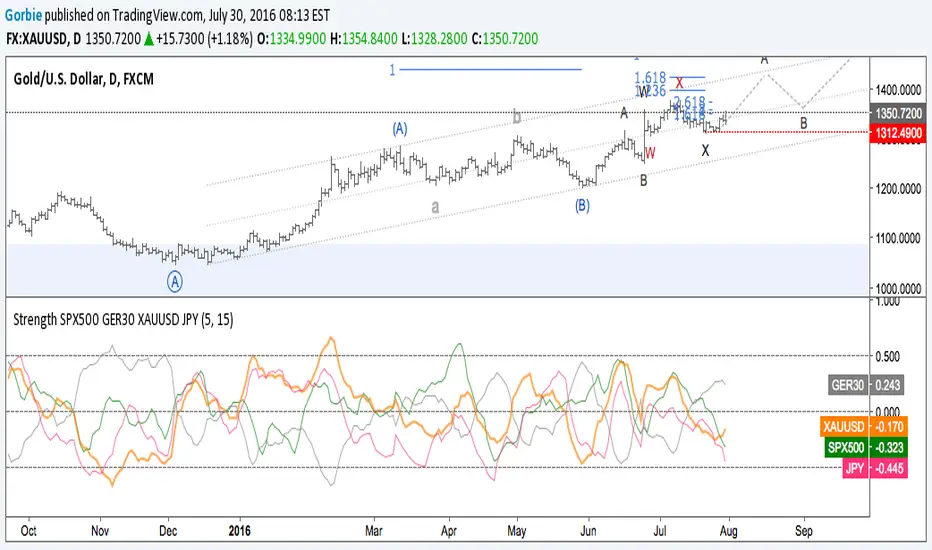
Strength SPX500 EURUSD XAUUSD USOILStrength of SPX500, EURUSD, XAUUSD and US OIL. Buy or sell on extreme of strength into the overbought or the oversell.Pine Script®指标由Gorbie提供22185
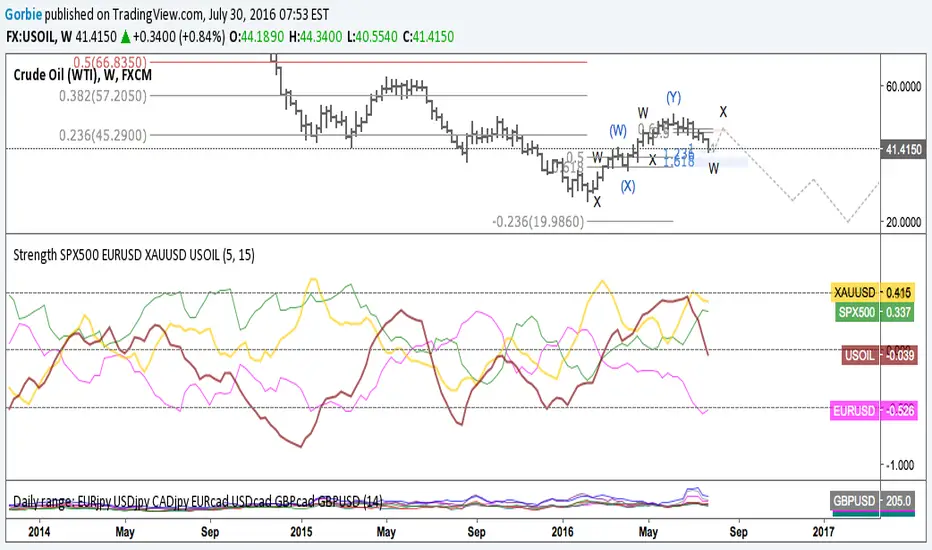
Strength SPX500 EURUSD XAUUSD USOILStrength of SPX500, EURUSD, XAUUSD and USOILPine Script®指标由Gorbie提供44121
Sectors Relative Strength Normal DistributionI wrote this indicator as an attempt to see the Relative Strengths of different sectors in the same scale, but there is also other ways to do that. This indicator plots the normal distribution for the 10 sectors of the SPY for the last X bars of the selected resolution, based on the selected comparative security. It shows which sectors are outperforming and underperforming the SPY (or any other security) relatively to each other by the given deviation. Pine Script®指标由Piet.Hein提供77266
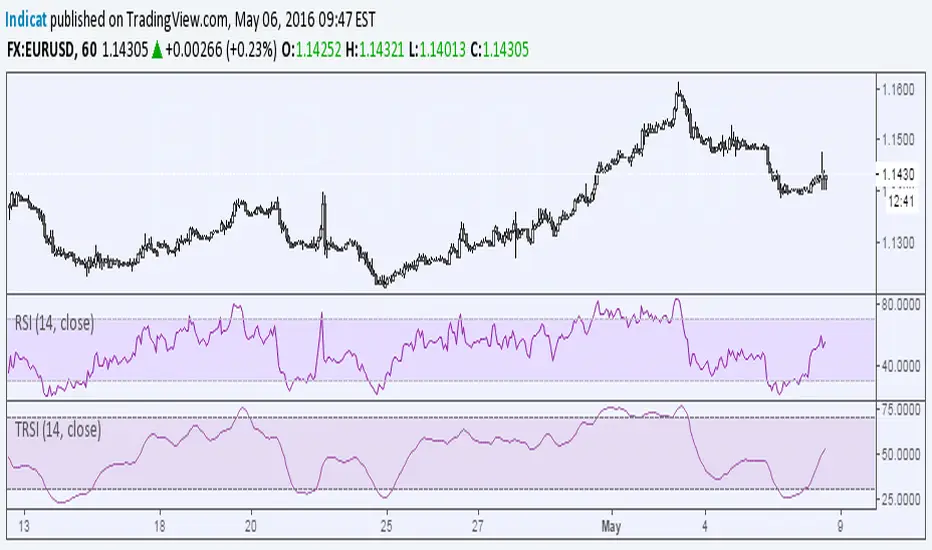
Relative Strength Index on TranquilizersSome weeks ago, I had a patient in my practice who suffered from internal stability disorders. Certainly not a case of disordered thinking or schizophrenic behaviour, because his general sense of direction wasn’t the problem. He just couldn’t find the right overall balance, an ailment he struggled with for years. Straight away I could diagnose that surgery wasn’t an option, so I gave him a medicine he would clearly benefit from. I never heard from him again…. He must be doing just fine. Cheers, Indicat... Pine Script®指标由Indicat提供5577
Momentum of Relative strength to Index Leaf_West styleMomentum of Relative Strength to index as used by Leaf_West. This is to be used with the companion Relative Strength to Index indicator Leaf_West Style. Make sure you use the same index for comparison. If you follow his methods be aware of the different moving averages for the different time periods. From Leaf_West: "on my weekly and monthly R/S charts, I include a 13 EMA of the R/S (brown dash line) and an 8 SMA of the 13 EMA (pink solid line). The indicator on the bottom of the weekly/monthly charts is an 8 period momentum indicator of the R/S line. The red horizontal line is drawn at the zero line. For daily or 130-minute time periods (or shorter), my R/S charts are slightly different - the moving averages of the R/S line include a 20EMA (brown dash line), a 50 EMA (blue dash line) and an 8 SMA of the20 EMA (pink solid line). The momentum indicator is also slightly different from the weekly/monthly charts – here I use a 12 period calculation (vs 8 SMA period for the weekly/monthly charts)." Leaf's methods do evolve and so watch for any changes to the preferred MAs etc..Pine Script®指标由jayy提供33102
Relative strength to Index set up as per Leaf_WestRelative Strength to index as used by Leaf_West. If you follow his methods be aware of the different moving averages for the different time periods. From Leaf_West: "on my weekly and monthly R/S charts, I include a 13 EMA of the R/S (brown dash line) and an 8 SMA of the 13 EMA (pink solid line). The indicator on the bottom of the weekly/monthly charts is an 8 period momentum indicator of the R/S line. The red horizontal line is drawn at the zero line. For daily or 130-minute time periods (or shorter), my R/S charts are slightly different - the moving averages of the R/S line include a 20EMA (brown dash line), a 50 EMA (blue dash line) and an 8 SMA of the20 EMA (pink solid line). The momentum indicator is also slightly different from the weekly/monthly charts – here I use a 12 period calculation (vs 8 SMA period for the weekly/monthly charts)." Leaf's methods do evolve and so watch for any changes to the preferred MAs etc..Pine Script®指标由jayy提供33155
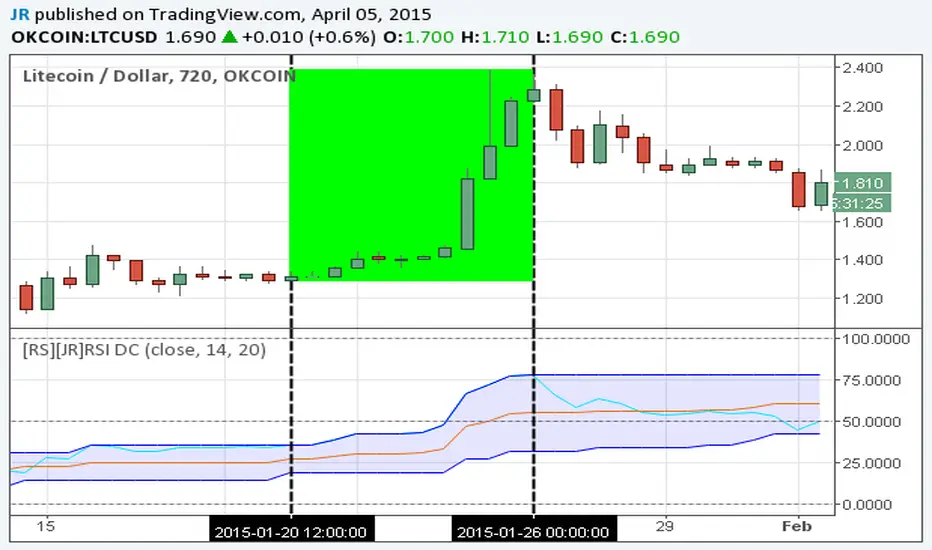
[RS][JR]RSI Donchian ChannelsRSI Donchian Channels Built by Ricardo and JR Here is a great indicator to use for strong trends. Donchian Channels react immediately to changes in the highest high and lowest low. For strong trends you want to trade when RSI is set along the upper or lower DC-RSI envelope. When the RSI releases from the DC-RSI envelope, you can take the trade off. Pine Script®指标由QuantitativeExhaustion提供88899
Multi Timeframe RSIThis will show you the RSI of the higher timeframes (up to 1D). Current Timeframe is colored red, higher timeframes are colored from light gray to darker gray (you can change that). There are several ways to enter a trade: 1. look for rising RSI on higher timeframe (line is stepping up in indicator window), wait for current RSI to decline to oversold (with length 14 its below 30), look for a buy entry (vice versa for a sell setup) 2. look for all RSI timeframes to decline to oversold, this is a good zone to enter a buy (vice versa for a sell setup) Keep in Mind that a Stochastic Indicator can have it's High/Low befor Price will have it. Good Luck :)Pine Script®指标由20813提供1515866
Linear Regression SlopeCorrected Version, for VERSION - 2 () updated for Custom Length, and fixed some formula glitches. Pine Script®指标由UDAY_C_Santhakumar提供22402
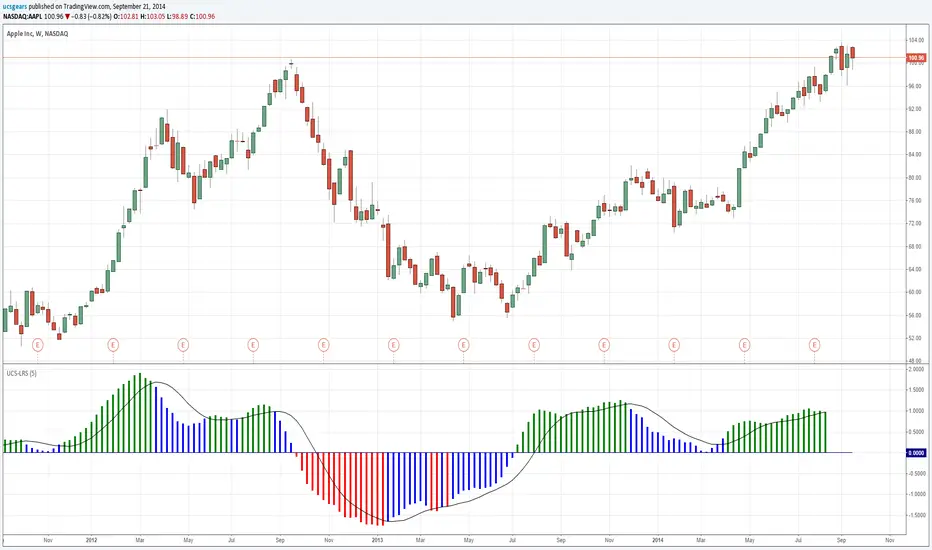
UCSgears_Linear Regression SlopeThis is version 1 of the Linear Regression Slope. In ideal world the Linear regression slope values will remain same for any time period length. because the equation is y = mx+b, where m is the slope. All I did here is m = y/x The Main Purpose of this indicator is to see, if the Trend is accelerating or decelerating. The first Blue bar will caution when a strong trend is losing strength. I will leave the rest for you to explore. I picked AAPL again, because it does have both up and down trend, in the recent time. Mistake in the code Corrected Version - Pine Script®指标由UDAY_C_Santhakumar提供55687