SuperTrend Optimizer Remastered[CHE] SuperTrend Optimizer Remastered — Grid-ranked SuperTrend with additive or multiplicative scoring
Summary
This indicator evaluates a fixed grid of one hundred and two SuperTrend parameter pairs and ranks them by a simple flip-to-flip return model. It auto-selects the currently best-scoring combination and renders its SuperTrend in real time, with optional gradient coloring for faster visual parsing. The original concept is by KioseffTrading Thanks a lot for it.
For years I wanted to shorten the roughly two thousand three hundred seventy-one lines; I have now reduced the core to about three hundred eighty lines without triggering script errors. The simplification is generalizable to other indicators. A multiplicative return mode was added alongside the existing additive aggregation, enabling different rankings and often more realistic compounding behavior.
Motivation: Why this design?
SuperTrend is sensitive to its factor and period. Picking a single pair statically can underperform across regimes. This design sweeps a compact parameter grid around user-defined lower bounds, measures flip-to-flip outcomes, and promotes the combination with the strongest cumulative return. The approach keeps the visual footprint familiar while removing manual trial-and-error. The multiplicative mode captures compounding effects; the additive mode remains available for linear aggregation.
Originally (by KioseffTrading)
Very long script (~2,371 lines), monolithic structure.
SuperTrend optimization with additive (cumulative percentage-sum) scoring only.
Heavier use of repetitive code; limited modularity and fewer UI conveniences.
No explicit multiplicative compounding option; rankings did not reflect sequence-sensitive equity growth.
Now (remastered by CHE)
Compact core (~380 lines) with the same functional intent, no compile errors.
Adds multiplicative (compounding) scoring alongside additive, changing rankings to reflect real equity paths and penalize drawdown sequences.
Fixed 34×3 grid sweep, live ranking, gradient-based bar/wick/line visuals, top-table display, and an optional override plot.
Cleaner arrays/state handling, last-bar table updates, and reusable simplification pattern that can be applied to other indicators.
What’s different vs. standard approaches?
Baseline: A single SuperTrend with hand-picked inputs.
Architecture differences:
Fixed grid of thirty-four factor offsets across three ATR offsets.
Per-combination flip-to-flip backtest with additive or multiplicative aggregation.
Live ranking with optional “Best” or “Worst” table output.
Gradient bar, wick, and line coloring driven by consecutive trend counts.
Optional override plot to force a specific SuperTrend independent of ranking.
Practical effect: Charts show the currently best-scoring SuperTrend, not a static choice, plus an on-chart table of top performers for transparency.
How it works (technical)
For each parameter pair, the script computes SuperTrend value and direction. It monitors direction transitions and treats a change from up to down as a long entry and the reverse as an exit, measuring the move between entry and exit using close prices. Results are aggregated per pair either by summing percentage changes or by compounding return factors and then converting to percent for comparison. On the last bar, open trades are included as unrealized contributions to ranking. The best combination’s line is plotted, with separate styling for up and down regimes. Consecutive regime counts are normalized within a rolling window and mapped to gradients for bars, wicks, and lines. A two-column table reports the best or worst performers, with an optional row describing the parameter sweep.
Parameter Guide
Factor (Lower Bound) — Starting SuperTrend factor; the grid adds offsets between zero and three point three. Default three point zero. Higher raises distance to price and reduces flips.
ATR Period (Lower Bound) — Starting ATR length; the grid adds zero, one, and two. Default ten. Longer reduces noise at the cost of responsiveness.
Best vs Worst — Ranks by top or bottom cumulative return. Default Best. Use Worst for stress tests.
Calculation Mode — Additive sums percents; Multiplicative compounds returns. Multiplicative is closer to equity growth and can change the leaderboard.
Show in Table — “Top Three” or “All”. Fewer rows keep charts clean.
Show “Parameters Tested” Label — Displays the effective sweep ranges for auditability.
Plot Override SuperTrend — If enabled, the override factor and ATR are plotted instead of the ranked winner.
Override Factor / ATR Period — Values used when override is on.
Light Mode (for Table) — Adjusts table colors for bright charts.
Gradient/Coloring controls — Toggles for gradient bars and wick coloring, window length for normalization, gamma for contrast, and transparency settings. Use these to emphasize or tone down visual intensity.
Table Position and Text Size — Places the table and sets typography.
Reading & Interpretation
The auto SuperTrend plots one line for up regimes and one for down regimes. Color intensity reflects consecutive trend persistence within the chosen window. A small square at the bottom encodes the same gradient as a compact status channel. Optional wick coloring uses the same gradient for maximum contrast. The performance table lists parameter pairs and their cumulative return under the chosen aggregation; positive values are tinted with the up color, negative with the down color. “Long” labels mark flips that open a long in the simplified model.
Practical Workflows & Combinations
Trend following: Use the auto line as your primary bias. Enter on flips aligned with structure such as higher highs and higher lows. Filter with higher-timeframe trend or volatility contraction.
Exits/Stops: Consider conservative exits when color intensity fades or when the opposite line is approached. Aggressive traders can trail near the plotted line.
Override mode: When you want stability across instruments, enable override and standardize factor and ATR; keep the table visible for sanity checks.
Multi-asset/Multi-TF: Defaults travel well on liquid instruments and intraday to daily timeframes. Heavier assets may prefer larger lower bounds or multiplicative mode.
Behavior, Constraints & Performance
Repaint/confirmation: Signals are based on SuperTrend direction; confirmation is best assessed on closed bars to avoid mid-bar oscillation. No higher-timeframe requests are used.
Resources: One hundred and two SuperTrend evaluations per bar, arrays for state, and a last-bar table render. This is efficient for the grid size but avoid stacking many instances.
Known limits: The flip model ignores costs, slippage, and short exposure. Rapid whipsaws can degrade both aggregation modes. Gradients are cosmetic and do not change logic.
Sensible Defaults & Quick Tuning
Start with the provided lower bounds and “Top Three” table.
Too many flips → raise the lower bound factor or period.
Too sluggish → lower the bounds or switch to additive mode.
Rankings feel unstable → prefer multiplicative mode and extend the normalization window.
Visuals too strong → increase gradient transparency or disable wick coloring.
What this indicator is—and isn’t
This is a parameter-sweep and visualization layer for SuperTrend selection. It is not a complete trading system, not predictive, and does not include position sizing, transaction costs, or risk management. Combine with market structure, higher-timeframe context, and explicit risk controls.
Attribution and refactor note: The original work is by KioseffTrading. The script has been refactored from approximately two thousand three hundred seventy-one lines to about three hundred eighty core lines, retaining behavior without compiler errors. The general simplification pattern is reusable for other indicators.
Metadata
Name/Tag: SuperTrend Optimizer Remastered
Pine version: v6
Overlay or separate pane: true (overlay)
Core idea/principle: Grid-based SuperTrend selection by cumulative flip returns with additive or multiplicative aggregation.
Primary outputs/signals: Auto-selected SuperTrend up and down lines, optional override lines, gradient bar and wick colors, “Long” labels, performance table.
Inputs with defaults: See Parameter Guide above.
Metrics/functions used: SuperTrend, ATR, arrays, barstate checks, windowed normalization, gamma-based contrast adjustment, table API, gradient utilities.
Special techniques: Fixed grid sweep, compounding vs linear aggregation, last-bar UI updates, gradient encoding of persistence.
Performance/constraints: One hundred and two SuperTrend calls, arrays of length one hundred and two, label budget, last-bar table updates, no higher-timeframe requests.
Recommended use-cases/workflows: Trend bias selection, quick parameter audits, override standardization across assets.
Compatibility/assets/timeframes: Standard OHLC charts across intraday to daily; liquid instruments recommended.
Limitations/risks: Costs and slippage omitted; mid-bar instability possible; not suitable for synthetic chart types.
Debug/diagnostics: Ranking table, optional tested-range label; internal counters for consecutive trends.
Disclaimer
The content provided, including all code and materials, is strictly for educational and informational purposes only. It is not intended as, and should not be interpreted as, financial advice, a recommendation to buy or sell any financial instrument, or an offer of any financial product or service. All strategies, tools, and examples discussed are provided for illustrative purposes to demonstrate coding techniques and the functionality of Pine Script within a trading context.
Any results from strategies or tools provided are hypothetical, and past performance is not indicative of future results. Trading and investing involve high risk, including the potential loss of principal, and may not be suitable for all individuals. Before making any trading decisions, please consult with a qualified financial professional to understand the risks involved.
By using this script, you acknowledge and agree that any trading decisions are made solely at your discretion and risk.
Do not use this indicator on Heikin-Ashi, Renko, Kagi, Point-and-Figure, or Range charts, as these chart types can produce unrealistic results for signal markers and alerts.
Best regards and happy trading
Chervolino
Supertrendstrategy

Multipower Entry SecretMultipower Entry Secret indicator is designed to be the ultimate trading companion for traders of all skill levels—especially those who struggle with decision-making due to unclear or overwhelming signals. Unlike conventional trading systems cluttered with too many lines and confusing alerts, this indicator provides a clear, adaptive, and actionable guide for market entries and exits.
Key Points:
Clear Buy/Sell/Wait Signals:
The script dynamically analyzes price action, candle patterns, volume, trend strength, and higher time frame context. This means it gives you “Buy,” “Sell,” or “Wait” signals based on real, meaningful market information—filtering out the noise and weak trades.
Multi-Timeframe Adaptive Analysis:
It synchronizes signals between higher and current timeframes, ensuring you get the most reliable direction—reducing the risk of getting caught in fake moves or sudden reversals.
Automatic Support, Resistance & Liquidity Zones:
Key levels like support, resistance, and liquidity zones are auto-detected and displayed directly on the chart, helping you make precise decisions without manual drawing.
Real-Time Dashboard:
All relevant information, such as trend strength, market intent, volume sentiment, and the reason behind each signal, is neatly summarized in a dashboard—making monitoring effortless and intuitive.
Customizable & Beginner-Friendly:
Whether you’re a newcomer wanting straightforward guidance or a professional needing advanced customization, the indicator offers flexible options to adjust analysis depth, timeframes, sensitivity, and more.
Visual & Clutter-Free:
The design ensures that your chart remains clean and readable, showing only the most important information. This minimizes mental overload and allows for instant decision-making.
Who Will Benefit?
Beginners who want to learn trading logic, avoid common traps, and see the exact reason behind every signal.
Advanced traders who require adaptive multi-timeframe analytics, fast execution, and stress-free monitoring.
Anyone who wants to save screen time, reduce analysis paralysis, and have more confidence in every trade they take.
1. No Indicator Clutter
Intent:
Many traders get confused by charts filled with too many indicators and signals. This often leads to hesitation, missed trades, or taking random, risky trades.
In this Indicator:
You get a clean and clutter-free chart. Only the most important buy/sell/wait signals and relevant support/resistance/liquidity levels are shown. These update automatically, removing the “overload” and keeping your focus sharp, so your decision-making is faster and stress-free.
2. Exact Entry Guide
Intent:
Traders often struggle with entry timing, leading to FOMO (fear of missing out) or getting trapped in sudden market reversals.
In this Indicator:
The system uses powerful adaptive logic to filter out weak signals and only highlight the strongest market moves. This not only prevents you from entering late or on noise, but also helps avoid losses from false breakouts or whipsaws. You get actionable suggestions—when to enter, when to hold back—so your entries are high-conviction and disciplined.
3. HTF+LTF Logic: Multitimeframe Sync Analysis
Intent:
Most losing trades happen when you act only on the short-term chart, ignoring the bigger market trend.
In this Indicator:
Signals are based on both the current chart timeframe (LTF) and a higher (HTF, like hourly/daily) timeframe. The indicator synchronizes trend direction, momentum, and structure across both levels, quickly adapting to show you when both are aligned. This filtering results in “only trade with the bigger trend”—dramatically increasing your win rate and market confidence.
4. Auto Support/Resistance & Liquidity Zones
Intent:
Drawing support/resistance and liquidity zones manually is time-consuming and error-prone, especially for beginners.
In this Indicator:
The system automatically identifies and plots the most crucial support/resistance levels and liquidity zones on your chart. This is based on adaptive, real-time price and volume analysis. These zones highlight where major institutional activity, trap setups, or real breakouts/reversals are most likely, removing guesswork and giving you a clear reference for entries, exits, and stop placements.
5. Clear Action/Direction
Intent:
Traders need certainty—what does the market want right now? Most indicators are vague.
In this Indicator:
Your dashboard always displays in plain words (like “BUY”, “SELL”, or “WAIT”) what action makes sense in the current market phase. Whether it’s a bull trap, volume spike, wick reversal, or exhaustion—it’s interpreted and explained clearly. No more confusion—just direct, real-time advice.
6. For Everyone (Beginner to Pro)
Intent:
Most advanced indicators are overwhelming for new traders; simple ones lack depth for professionals.
In this Indicator:
It is simple enough for a beginner—just add it to the chart and instantly see what action to consider. At the same time, it includes advanced adaptive analysis, multi-timeframe logic, and customizable settings so professional traders can fine-tune it for their strategies.
7. Ideal Usage and User Benefits
Instant Decision Support:
Whenever you’re unsure about a trade, just look at the indicator’s suggestion for clarity.
Entry Learning:
Beginners get real-time “practice” by not only seeing signals, but also the reason behind them—improving your chart reading and market understanding.
Screen Time & Stress Reduction:
Clear, relevant information only; no noise, less fatigue, faster decisions.
Makes Trading Confident & Simple:
The smart dashboard splits actionable levels (HTF, LTF, action) so you never miss a move, avoid traps, and stay aligned with high-probability trades.
8. Advanced Input Settings (Smart Customization)
Explained with Examples:
Enable Wick Analysis:
Finds candles with strong upper/lower wicks (signs of rejection/buying/selling force), alerting you to hidden reversals and protecting from FOMO entries.
Enable Absorption:
Detects when heavy order flow from one side is “absorbed” by the other (shows where institutional buyers/sellers are likely active, helps spot fake breakouts).
Enable Unusual Breakout:
Highlights real breakouts—large volatility plus high volume—so you catch genuine moves and avoid random spikes.
Enable Range/Expansion:
Smartly flags sudden range expansions—when the market goes from quiet to volatile—so you can act at the start of real trends.
Trend Bar Lookback:
Adjusts how many bars/candles are used in trend calculations. Short (fast trades, more signals), long (more reliability, fewer whipsaws).
Bull/Bear Bars for Strong Trend Min:
Sets how many candles in a row must support a trend before calling it “strong”—prevents flipping signals, keeps you disciplined.
Volume MA Length:
Lets you adjust how many bars back volume is averaged—fine-tune for your asset and trading style for best volume signals.
Swing Lookback Bars:
Set how many bars to use for swing high/low detection—short (quick swing levels), long (stronger support/resistance).
HTF (Bias Window):
Decide which higher timeframe the indicator should use for big-picture market mood. Adjustable for any style (scalp, swing, position).
Adaptive Lookback (HTF):
Choose how much HTF history is used for detecting major extremes/zones. Quick adjust for more/less sensitivity.
Show Support/Resistance, Liquidity Zones, Trendlines:
Toggle them on/off instantly per your needs—keeps your chart relevant and tailored.
9. Live Dashboard Sections Explained
Intent HTF:
Shows if the bigger timeframe currently has a Bullish, Bearish, or Neutral (“Chop”) intent, based on strict volume/price body calculations. Instant clarity—no more guessing on trend bias.
HTF Bias:
Clear message about which side (buy/sell/sideways) controls the market on the higher timeframe, so you always trade with the “big money.”
Chart Action:
The central action for the current bar—Whether to Buy, Sell, or Wait—calculated from all indicator logic, not just one rule.
TrendScore Long/Short:
See how many candles in your chosen window were bullish or bearish, at a glance. Instantly gauge market momentum.
Reason (WHY):
Every time a signal appears, the “reason” cell tells you the primary logic (breakout, wick, strong trend, etc.) behind it. Full transparency and learning—never trade blindly.
Strong Trend:
Shows if the market is currently in a powerful trend or not—helping you avoid choppy, risky entries.
HTF Vol/Body:
Displays current higher timeframe volume and candle body %—helping spot when big players are active for higher probability trades.
Volume Sentiment:
A real-time analysis of market psychology (strong bullish/bearish, neutral)—making your decision-making much more confident.
10. Smart and User-Friendly Design
Multi-timeframe Adaptive:
All calculations can now be drawn from your choice of higher or current timeframe, ensuring signals are filtered by larger market context.
Flexible Table Position:
You can set the live dashboard/summary anywhere on the chart for best visibility.
Refined Zone Visualization:
Liquidity and order blocks are visually highlighted, auto-tuning for your settings and always cleaning up to stay clutter-free.
Multi-Lingual & Beginner Accessible:
With Hindi and simple English support, descriptions and settings are accessible for a wide audience—anyone can start using powerful trading logic with zero language barrier.
Efficient Labels & Clear Reasoning:
Signal labels and reasons are shown/removed dynamically so your chart stays informative, not messy.
Every detail of this indicator is designed to make trading both simpler and smarter—helping you avoid the common pitfalls, learn real price action, stay in sync with the market’s true mood, and act with discipline for higher consistency and confidence.
This indicator makes professional-grade market analysis accessible to everyone. It’s your trusted assistant for making smarter, faster, and more profitable trading decisions—providing not just signals, but also the “why” behind every action. With auto-adaptive logic, clear visuals, and strong focus on real trading needs, it lets you focus on capturing the moves that matter—every single time.

Multi Fibonacci Supertrend with Signals【FIbonacciFlux】Multi Fibonacci Supertrend with Signals (MFSS)
Overview
The Multi Fibonacci Supertrend with Signals (MFSS) is an advanced technical analysis tool that combines multiple Supertrend indicators using Fibonacci ratios to identify trend directions and potential trading opportunities.
Key Features
1. Fibonacci-Based Supertrend Levels
* Factor 1 (Weak) : 0.618 - The golden ratio
* Factor 2 (Medium) : 1.618 - The Fibonacci ratio
* Factor 3 (Strong) : 2.618 - The extension ratio
2. Visual Components
* Multi-layered Trend Lines
* Different line weights for easy identification
* Progressive transparency from Factor 1 to Factor 3
* Color-coded trend directions (Green for bullish, Red for bearish)
* Dynamic Fill Areas
* Gradient fills between price and trend lines
* Visual representation of trend strength
* Automatic color adjustment based on trend direction
* Signal Indicators
* Clear BUY/SELL labels on chart
* Position-adaptive signal placement
* High-visibility color scheme
3. Signal Generation Logic
The system generates signals based on two key conditions:
* Primary Condition :
* BUY : Price crossunder Supertrend2 (Factor 1.618)
* SELL : Price crossover Supertrend2 (Factor 1.618)
* Confirmation Filter :
* Signals only trigger when Supertrend3 confirms the trend direction
* Reduces false signals in volatile markets
Technical Details
Input Parameters
* ATR Period : 10 (default)
* Customizable for different market conditions
* Affects sensitivity of all Supertrend levels
* Factor Settings :
* All factors are customizable
* Default values based on Fibonacci sequence
* Minimum value: 0.01
* Step size: 0.01
Alert System
* Built-in alert conditions
* Customizable alert messages
* Real-time notification support
Use Cases
* Trend Trading
* Identify strong trend directions
* Filter out weak signals
* Confirm trend continuations
* Risk Management
* Multiple trend levels for stop-loss placement
* Clear entry and exit signals
* Trend strength visualization
* Market Analysis
* Multi-timeframe analysis capability
* Trend strength assessment
* Market structure identification
Benefits
* Reliability
* Based on proven Supertrend algorithm
* Enhanced with Fibonacci mathematics
* Multiple confirmation levels
* Clarity
* Clear visual signals
* Easy-to-interpret interface
* Reduced noise in signal generation
* Flexibility
* Customizable parameters
* Adaptable to different markets
* Suitable for various trading styles
Performance Considerations
* Optimized code structure
* Efficient calculation methods
* Minimal resource usage
Installation and Usage
Setup
* Add indicator to chart
* Adjust parameters if needed
* Enable alerts as required
Best Practices
* Use with other confirmation tools
* Adjust factors based on market volatility
* Consider timeframe appropriateness
Backtesting Results and Strategy Performance
This indicator is specifically designed for pullback trading with optimized risk-reward ratios in trend-following strategies. Below are the detailed backtesting results from our proprietary strategy implementation:
BTCUSDT Performance (Binance)
* Test Period: Approximately 7 years
* Risk-Reward Ratio: 2:1
* Take Profit: 8%
* Stop Loss: 4%
Key Metrics (BTCUSDT):
* Net Profit: +2,579%
* Total Trades: 551
* Win Rate: 44.8%
* Profit Factor: 1.278
* Maximum Drawdown: 42.86%
ETHUSD Performance (Binance)
* Risk-Reward Ratio: 4.33:1
* Take Profit: 13%
* Stop Loss: 3%
Key Metrics (ETHUSD):
* Net Profit: +8,563%
* Total Trades: 581
* Win Rate: 32%
* Profit Factor: 1.32
* Maximum Drawdown: 55%
Strategy Highlights:
* Optimized for pullback trading in strong trends
* Focus on high risk-reward ratios
* Proven effectiveness in major cryptocurrency pairs
* Consistent performance across different market conditions
* Robust profit factor despite moderate win rates
Note: These results are from our proprietary strategy implementation and should be used as reference only. Individual results may vary based on market conditions and implementation.
Important Considerations:
* The strategy demonstrates strong profitability despite lower win rates, emphasizing the importance of proper risk-reward ratios
* Higher drawdowns are compensated by significant overall returns
* The system shows adaptability across different cryptocurrencies with consistent profit factors
* Results suggest optimal performance in volatile crypto markets
Real Trading Examples
BTCUSDT 4-Hour Chart Analysis
Example of pullback strategy implementation on Bitcoin, showing clear trend definition and entry points
ETHUSDT 4-Hour Chart Analysis
Ethereum chart demonstrating effective signal generation during strong trends
BTCUSDT Detailed Signal Example (15-Minute Scalping)
Close-up view of signal generation and trend confirmation process on 15-minute timeframe, demonstrating the indicator's effectiveness for scalping operations
Chart Analysis Notes:
* Green and red zones clearly indicate trend direction
* Multiple timeframe confirmation visible through different Supertrend levels
* Clear entry signals during pullbacks in established trends
* Precise stop-loss placement opportunities below support levels
Implementation Guidelines:
* Wait for main trend confirmation from Factor 3 (2.618)
* Enter trades on pullbacks to Factor 2 (1.618)
* Use Factor 1 (0.618) for fine-tuning entry points
* Place stops below the relevant Supertrend level
Footnotes:
* Charts provided are from Binance exchange, using both 4-hour and 15-minute timeframes
* Trading view screenshots captured during actual market conditions
* Indicators shown: Multi Fibonacci Supertrend with all three factors
* Time period: Recent market activity showing various market conditions
Important Notice:
These charts are for educational purposes only. Past performance does not guarantee future results. Always conduct your own analysis and risk management.
Disclaimer
This indicator is for informational purposes only. Past performance is not indicative of future results. Always conduct proper risk management and due diligence.
License
Open source under MIT License
Author's Note
Contributions and suggestions for improvement are welcome. Please feel free to fork and enhance.

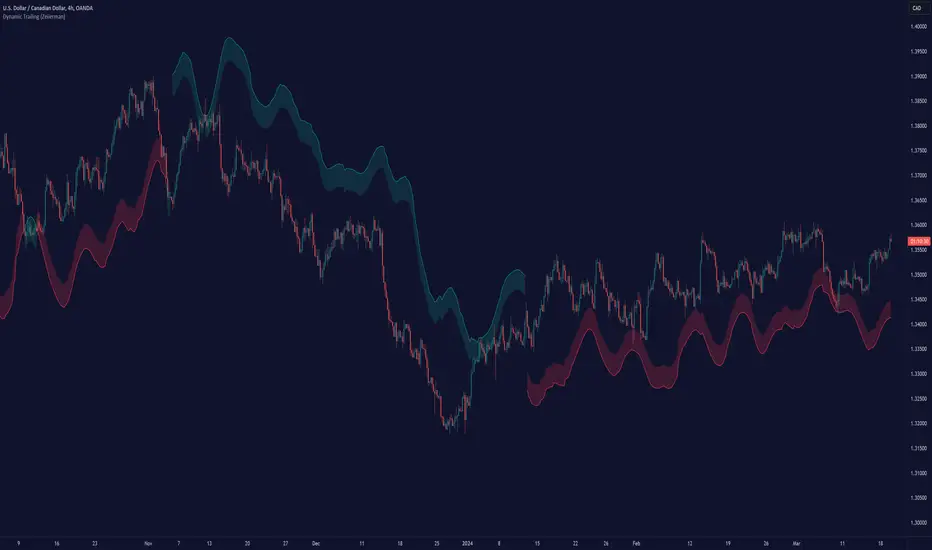
Dynamic Trailing (Zeiierman)█ Overview
The Dynamic Trailing (Zeiierman) indicator enhances the traditional SuperTrend approach by providing a more nuanced, adaptable tool for trend analysis and market volatility assessment. It combines techniques to identify dynamic support and resistance levels, trend directions, and market volatility. By integrating the Average True Range (ATR) with a unique multiplier system and smoothing mechanisms, this indicator offers a nuanced approach to trend-following strategies, making it a valuable asset for traders looking to leverage SuperTrend methodologies with additional insights into market dynamics.
█ How It Works
At its core, this indicator builds on the traditional SuperTrend formula by utilizing a modified ATR calculation to define the deviation for dynamic support and resistance levels. These levels are dynamically adjusted based on market volatility. The innovation lies in the addition of the Hull Moving Average (HMA) and the Triple Exponential Moving Average (TEMA) for an enhanced smoothing effect, making the indicator's trend signals more reliable and less prone to market noise. The trend direction is determined by comparing the closing price with the dynamic levels, facilitating clear bullish or bearish signals.
The indicator incorporates a 'Supertrend' function, which uses the dynamic levels and the price’s position relative to them to determine the trend direction. This determination is visualized through color-coded lines and a cloud zone, which expands or contracts based on the ATR and a user-defined width setting, illustrating the market's volatility and trend strength.
ATR Calculation: Utilizes the Average True Range (ATR) to measure market volatility. The ATR is a cornerstone of this indicator, helping to dynamically adjust the support and resistance levels according to the market’s changing conditions.
Supertrend Calculation: Implements a supertrend formula that combines the ATR with user-defined multipliers to plot potential trend directions. This feature helps in identifying whether the market is in an uptrend or downtrend, offering visual cues for potential reversals.
TEMA Calculation: Employs the Triple Exponential Moving Average (TEMA) through a Hull Moving Average (HMA) calculation to smooth out price data. This smoothing process helps in reducing market noise and makes the trend direction clearer.
Dynamic Support and Resistance: Calculates dynamic support and resistance levels by applying a deviation (derived from the ATR and user-defined multiplier) to the smoothed price data. These levels adapt to market conditions, providing areas where price might experience support or resistance.
Trend and Cloud Calculation: Determines the overall trend direction and plots a 'Cloud' zone around it, which adjusts in width based on the ATR and a user-defined cloud width setting. This cloud acts as a visual buffer, indicating the strength and stability of the current trend.
█ How to Use
Trend Identification: The primary function of this indicator is to help traders quickly identify the prevailing market trend. A change in the color of the dynamic trailing line or its position relative to the price can signal potential trend reversals.
Dynamic Support and Resistance: Unlike static levels, the dynamic levels adjust with market conditions, providing current areas where the price might experience support or resistance.
Dynamic Support
Dynamic Resistance
█ Settings
Mult (Multiplier): Adjusts the multiplier for the ATR calculation, affecting the deviation distance for support and resistance levels. Higher values decrease sensitivity and vice versa.
Len (Length): Sets the period for the HMA in the TEMA calculation, influencing the indicator's responsiveness to price changes.
Smoothness: Determines the smoothness of the dynamic support and resistance lines by setting the SMA length. Higher values result in smoother lines.
Cloud Width : Modifies the width of the cloud, providing a visual representation of market volatility.
Color Settings (upcol and dncol): Allows users to customize the colors of the indicator's lines and cloud, aiding in visual trend identification.
-----------------
Disclaimer
The information contained in my Scripts/Indicators/Ideas/Algos/Systems does not constitute financial advice or a solicitation to buy or sell any securities of any type. I will not accept liability for any loss or damage, including without limitation any loss of profit, which may arise directly or indirectly from the use of or reliance on such information.
All investments involve risk, and the past performance of a security, industry, sector, market, financial product, trading strategy, backtest, or individual's trading does not guarantee future results or returns. Investors are fully responsible for any investment decisions they make. Such decisions should be based solely on an evaluation of their financial circumstances, investment objectives, risk tolerance, and liquidity needs.
My Scripts/Indicators/Ideas/Algos/Systems are only for educational purposes!
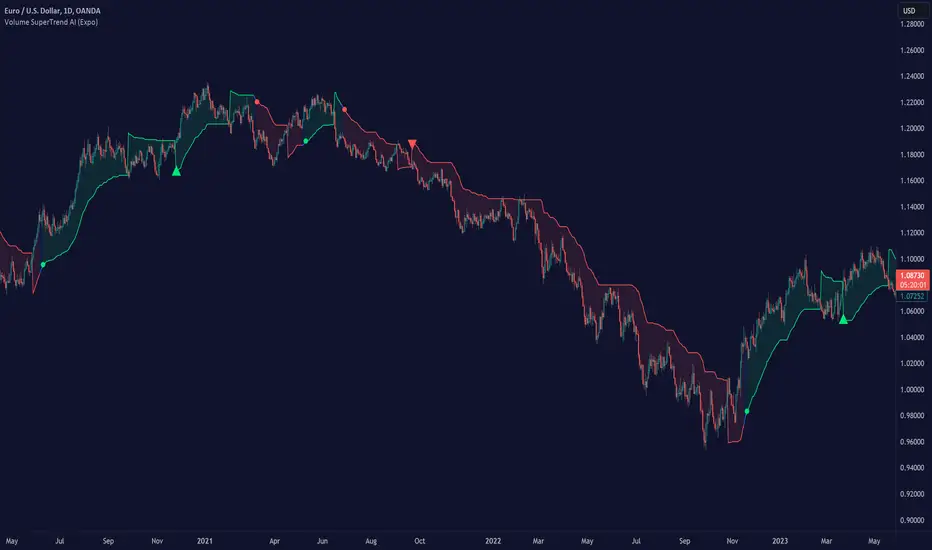
Volume SuperTrend AI (Expo)█ Overview
The Volume SuperTrend AI is an advanced technical indicator used to predict trends in price movements by utilizing a combination of traditional SuperTrend calculation and AI techniques, particularly the k-nearest neighbors (KNN) algorithm.
The Volume SuperTrend AI is designed to provide traders with insights into potential market trends, using both volume-weighted moving averages (VWMA) and the k-nearest neighbors (KNN) algorithm. By combining these approaches, the indicator aims to offer more precise predictions of price trends, offering bullish and bearish signals.
█ How It Works
Volume Analysis: By utilizing volume-weighted moving averages (VWMA), the Volume SuperTrend AI emphasizes the importance of trading volume in the trend direction, allowing it to respond more accurately to market dynamics.
Artificial Intelligence Integration - k-Nearest Neighbors (k-NN) Algorithm: The k-NN algorithm is employed to intelligently examine historical data points, measuring distances between current parameters and previous data. The nearest neighbors are utilized to create predictive modeling, thus adapting to intricate market patterns.
█ How to use
Trend Identification
The Volume SuperTrend AI indicator considers not only price movement but also trading volume, introducing an extra dimension to trend analysis. By integrating volume data, the indicator offers a more nuanced and robust understanding of market trends. When trends are supported by high trading volumes, they tend to be more stable and reliable. In practice, a green line displayed beneath the price typically suggests an upward trend, reflecting a bullish market sentiment. Conversely, a red line positioned above the price signals a downward trend, indicative of bearish conditions.
Trend Continuation signals
The AI algorithm is the fundamental component in the coloring of the Volume SuperTrend. This integration serves as a means of predicting the trend while preserving the inherent characteristics of the SuperTrend. By maintaining these essential features, the AI-enhanced Volume SuperTrend allows traders to more accurately identify and capitalize on trend continuation signals.
TrailingStop
The Volume SuperTrend AI indicator serves as a dynamic trailing stop loss, adjusting with both price movement and trading volume. This approach protects profits while allowing the trade room to grow, taking into account volume for a more nuanced response to market changes.
█ Settings
AI Settings:
Neighbors (k):
This setting controls the number of nearest neighbors to consider in the k-Nearest Neighbors (k-NN) algorithm. By adjusting this parameter, you can directly influence the sensitivity of the model to local fluctuations in the data. A lower value of k may lead to predictions that closely follow short-term trends but may be prone to noise. A higher value of k can provide more stable predictions, considering the broader context of market trends, but might lag in responsiveness.
Data (n):
This setting refers to the number of data points to consider in the model. It allows the user to define the size of the dataset that will be analyzed. A larger value of n may provide more comprehensive insights by considering a wider historical context but can increase computational complexity. A smaller value of n focuses on more recent data, possibly providing quicker insights but might overlook longer-term trends.
AI Trend Settings:
Price Trend & Prediction Trend:
These settings allow you to adjust the lengths of the weighted moving averages that are used to calculate both the price trend and the prediction trend. Shorter lengths make the trends more responsive to recent price changes, capturing quick market movements. Longer lengths smooth out the trends, filtering out noise, and highlighting more persistent market directions.
AI Trend Signals:
This toggle option enables or disables the trend signals generated by the AI. Activating this function may assist traders in identifying key trend shifts and opportunities for entry or exit. Disabling it may be preferred when focusing on other aspects of the analysis.
Super Trend Settings:
Length:
This setting determines the length of the SuperTrend, affecting how it reacts to price changes. A shorter length will produce a more sensitive SuperTrend, reacting quickly to price fluctuations. A longer length will create a smoother SuperTrend, reducing false alarms but potentially lagging behind real market changes.
Factor:
This parameter is the multiplier for the Average True Range (ATR) in SuperTrend calculation. By adjusting the factor, you can control the distance of the SuperTrend from the price. A higher factor makes the SuperTrend further from the price, giving more room for price movement but possibly missing shorter-term signals. A lower factor brings the SuperTrend closer to the price, making it more reactive but possibly more prone to false signals.
Moving Average Source:
This setting lets you choose the type of moving average used for the SuperTrend calculation, such as Simple Moving Average (SMA), Exponential Moving Average (EMA), etc.
Different types of moving averages provide various characteristics to the SuperTrend, enabling customization to align with individual trading strategies and market conditions.
-----------------
Disclaimer
The information contained in my Scripts/Indicators/Ideas/Algos/Systems does not constitute financial advice or a solicitation to buy or sell any securities of any type. I will not accept liability for any loss or damage, including without limitation any loss of profit, which may arise directly or indirectly from the use of or reliance on such information.
All investments involve risk, and the past performance of a security, industry, sector, market, financial product, trading strategy, backtest, or individual's trading does not guarantee future results or returns. Investors are fully responsible for any investment decisions they make. Such decisions should be based solely on an evaluation of their financial circumstances, investment objectives, risk tolerance, and liquidity needs.
My Scripts/Indicators/Ideas/Algos/Systems are only for educational purposes!
SuperTrend AI (Clustering) [LuxAlgo]The SuperTrend AI indicator is a novel take on bridging the gap between the K-means clustering machine learning method & technical indicators. In this case, we apply K-Means clustering to the famous SuperTrend indicator.
🔶 USAGE
Users can interpret the SuperTrend AI trailing stop similarly to the regular SuperTrend indicator. Using higher minimum/maximum factors will return longer-term signals.
The displayed performance metrics displayed on each signal allow for a deeper interpretation of the indicator. Whereas higher values could indicate a higher potential for the market to be heading in the direction of the trend when compared to signals with lower values such as 1 or 0 potentially indicating retracements.
In the image above, we can notice more clear examples of the performance metrics on signals indicating trends, however, these performance metrics cannot perform or predict every signal reliably.
We can see in the image above that the trailing stop and its adaptive moving average can also act as support & resistance. Using higher values of the performance memory setting allows users to obtain a longer-term adaptive moving average of the returned trailing stop.
🔶 DETAILS
🔹 K-Means Clustering
When observing data points within a specific space, we can sometimes observe that some are closer to each other, forming groups, or "Clusters". At first sight, identifying those clusters and finding their associated data points can seem easy but doing so mathematically can be more challenging. This is where cluster analysis comes into play, where we seek to group data points into various clusters such that data points within one cluster are closer to each other. This is a common branch of AI/machine learning.
Various methods exist to find clusters within data, with the one used in this script being K-Means Clustering , a simple iterative unsupervised clustering method that finds a user-set amount of clusters.
A naive form of the K-Means algorithm would perform the following steps in order to find K clusters:
(1) Determine the amount (K) of clusters to detect.
(2) Initiate our K centroids (cluster centers) with random values.
(3) Loop over the data points, and determine which is the closest centroid from each data point, then associate that data point with the centroid.
(4) Update centroids by taking the average of the data points associated with a specific centroid.
Repeat steps 3 to 4 until convergence, that is until the centroids no longer change.
To explain how K-Means works graphically let's take the example of a one-dimensional dataset (which is the dimension used in our script) with two apparent clusters:
This is of course a simple scenario, as K will generally be higher, as well the amount of data points. Do note that this method can be very sensitive to the initialization of the centroids, this is why it is generally run multiple times, keeping the run returning the best centroids.
🔹 Adaptive SuperTrend Factor Using K-Means
The proposed indicator rationale is based on the following hypothesis:
Given multiple instances of an indicator using different settings, the optimal setting choice at time t is given by the best-performing instance with setting s(t) .
Performing the calculation of the indicator using the best setting at time t would return an indicator whose characteristics adapt based on its performance. However, what if the setting of the best-performing instance and second best-performing instance of the indicator have a high degree of disparity without a high difference in performance?
Even though this specific case is rare its however not uncommon to see that performance can be similar for a group of specific settings (this could be observed in a parameter optimization heatmap), then filtering out desirable settings to only use the best-performing one can seem too strict. We can as such reformulate our first hypothesis:
Given multiple instances of an indicator using different settings, an optimal setting choice at time t is given by the average of the best-performing instances with settings s(t) .
Finding this group of best-performing instances could be done using the previously described K-Means clustering method, assuming three groups of interest (K = 3) defined as worst performing, average performing, and best performing.
We first obtain an analog of performance P(t, factor) described as:
P(t, factor) = P(t-1, factor) + α * (∆C(t) × S(t-1, factor) - P(t-1, factor))
where 1 > α > 0, which is the performance memory determining the degree to which older inputs affect the current output. C(t) is the closing price, and S(t, factor) is the SuperTrend signal generating function with multiplicative factor factor .
We run this performance function for multiple factor settings and perform K-Means clustering on the multiple obtained performances to obtain the best-performing cluster. We initiate our centroids using quartiles of the obtained performances for faster centroids convergence.
The average of the factors associated with the best-performing cluster is then used to obtain the final factor setting, which is used to compute the final SuperTrend output.
Do note that we give the liberty for the user to get the final factor from the best, average, or worst cluster for experimental purposes.
🔶 SETTINGS
ATR Length: ATR period used for the calculation of the SuperTrends.
Factor Range: Determine the minimum and maximum factor values for the calculation of the SuperTrends.
Step: Increments of the factor range.
Performance Memory: Determine the degree to which older inputs affect the current output, with higher values returning longer-term performance measurements.
From Cluster: Determine which cluster is used to obtain the final factor.
🔹 Optimization
This group of settings affects the runtime performances of the script.
Maximum Iteration Steps: Maximum number of iterations allowed for finding centroids. Excessively low values can return a better script load time but poor clustering.
Historical Bars Calculation: Calculation window of the script (in bars).

Trend hunter strategy - buy & sellThe indicator combines multiple technical indicators and conditions to generate buy and sell signals.
Here's how the indicator works and how to use it:
Strategy Selection:
The indicator provides a dropdown menu to choose the type of strategy. The available options are "Pullback" and "Simple."
Supertrend Settings:
The Supertrend indicator is used to identify the trend direction.
The indicator takes two input parameters:
ATR Length: Specifies the length of the Average True Range (ATR) used in the Supertrend calculation. The default value is 10.
Factor: Specifies the factor used in the Supertrend calculation. The default value is 3.0.
EMA Settings:
The indicator also includes an Exponential Moving Average (EMA) condition.
You can enable or disable the EMA condition using the "Ema Condition On/Off" checkbox.
If enabled, the indicator calculates an EMA based on the close price.
You can specify the length of the EMA using the "Ema Length" input parameter. The default value is 200.
RSI Settings:
The Relative Strength Index (RSI) indicator is used to generate additional conditions.
You can enable or disable the RSI condition using the "Rsi Condition On/Off" checkbox.
If enabled, the indicator calculates the RSI based on the close price.
You can specify the length of the RSI using the "Rsi Length" input parameter. The default value is 14.
Additionally, you can set the overbought and oversold levels for the RSI using the "RSI BUY Level" and "RSI SELL Level" input parameters, respectively. The default value for both is 50.
Final Conditions:
The indicator combines the Supertrend, EMA, and RSI conditions to generate buy and sell signals.
The specific conditions depend on the chosen strategy:
For the "Simple" strategy, the buy condition is when the Supertrend is in an up trend, not in a previous long position, the RSI is above the overbought level, and the close price is above the EMA.
For the "Pullback" strategy, the buy condition is when there is a cross under of the previous low with the Supertrend, the Supertrend is in an up trend, the RSI is above the overbought level, and the close price is above the EMA.
The sell conditions are the opposite of the respective buy conditions.
Backtest Period:
You can specify the start and end dates for the backtesting using the "Start calculations from" and "End calculations" inputs, respectively. The default start date is "2005-01-01" and the default end date is "2045-03-01." (this is work in progress) Still working on the table part, it is a bit tricky.
Trade Direction:
You can choose the trade direction using the "Trade Direction" input parameter. The available options are "Long," "Short," and "Both."
Depending on the selected trade direction, the indicator will generate signals accordingly.
Visual Display:
The indicator plots the Supertrend line on the price chart.
Buy signals are shown as green labels below the price bars.
Sell signals are shown as red labels above the price bars.
Adjust the input parameters according to your preferences, and then apply the indicator to a chart to see the generated signals. Please note that this indicator should be used for educational purposes only and should be thoroughly tested before using it for real trading.

Supertrend - Optimised Exit We created a small script that will allow you to have a quick look into static SL/PT to choose from. This might save you time, replacing the manual search for optimal SL/PT.
We're checking signals of the strategy and computing its performance with a grid of SL/PT selected.
We used SuperTrend signals in this example, but it will be straightforward to integrate your signals.
In addition to total Return, we compute MAX Dd and Profit Factor. Other metrics can be implemented as well.
Thanks to @MUQWISHI for helping code it.
Disclaimer
Please remember that past performance may not indicate future results.
Due to various factors, including changing market conditions, the strategy may no longer perform as well as in historical backtesting.
This post and the script don’t provide any financial advice.

SuperBollingerTrend (Expo)█ Overview
The SuperBollingerTrend indicator is a combination of two popular technical analysis tools, Bollinger Bands, and SuperTrend. By fusing these two indicators, SuperBollingerTrend aims to provide traders with a more comprehensive view of the market, accounting for both volatility and trend direction. By combining trend identification with volatility analysis, the SuperBollingerTrend indicator provides traders with valuable insights into potential trend changes. It recognizes that high volatility levels often accompany stronger price momentum, which can result in the formation of new trends or the continuation of existing ones.
█ How Volatility Impacts Trends
Volatility can impact trends by expanding or contracting them, triggering trend reversals, leading to breakouts, and influencing risk management decisions. Traders need to analyze and monitor volatility levels in conjunction with trend analysis to gain a comprehensive understanding of market dynamics.
█ How to use
Trend Reversals: High volatility can result in more dramatic price fluctuations, which may lead to sharp trend reversals. For example, a sudden increase in volatility can cause a bullish trend to transition into a bearish one, or vice versa, as traders react to significant price swings.
Volatility Breakouts: Volatility can trigger breakouts in trends. Breakouts occur when the price breaks through a significant support or resistance level, indicating a potential shift in the trend. Higher volatility levels can increase the likelihood of breakouts, as they indicate stronger market momentum and increased buying or selling pressure. This indicator triggers when the volatility increases, and if the price is near a key level when the indicator alerts, it might trigger a great trend.
█ Features
Peak Signal Move
The indicator calculates the peak price move for each ZigZag and displays it under each signal. This highlights how much the market moved between the signals.
Average ZigZag Move
All price moves between two signals are stored, and the average or the median is calculated and displayed in a table. This gives traders a great idea of how much the market moves on average between two signals.
Take Profit
The Take Profit line is placed at the average or the median price move and gives traders a great idea of what they can expect in average profit from the latest signals.
-----------------
Disclaimer
The information contained in my Scripts/Indicators/Ideas/Algos/Systems does not constitute financial advice or a solicitation to buy or sell any securities of any type. I will not accept liability for any loss or damage, including without limitation any loss of profit, which may arise directly or indirectly from the use of or reliance on such information.
All investments involve risk, and the past performance of a security, industry, sector, market, financial product, trading strategy, backtest, or individual's trading does not guarantee future results or returns. Investors are fully responsible for any investment decisions they make. Such decisions should be based solely on an evaluation of their financial circumstances, investment objectives, risk tolerance, and liquidity needs.
My Scripts/Indicators/Ideas/Algos/Systems are only for educational purposes!

Buy/Sell SignalsThe indicator is built using Supertrend, RSI, and Ema Crossovers.
What is the best way to use the indicator?
Indicator can be used in two ways:
First : If a signal appears on the chart, you can enter immediately the stoploss is the candle's low with a Small Buffer.
Second: you will get good results if you plot additional indicators like as volume, RSI and so on for additional confirmation to get better results

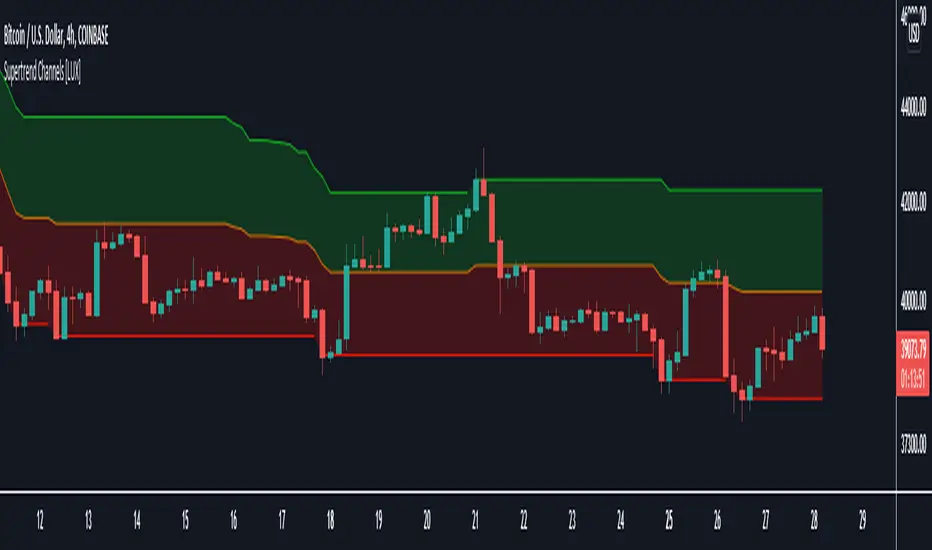
Supertrend Channels [LuxAlgo]The Supertrend is one of the most used indicators by traders when it comes to determining whether the market is up-trending or down-trending.
This indicator is displayed as a trailing stop, showing a lower monotonic extremity during up-trends and an upper monotonic extremity during down-trends. Today we propose a channel indicator based on the Supertrend trailing stop using trailing maximas/minimas.
Settings
Length: Atr length used by the Supertrend indicator.
Mult: Multiplicative factor for the Atr used by the Supertrend indicator.
Usage
The ability of the indicator to show an up-trend or down-trend is the same as the Supertrend, with rising channels when an up-trend is detected by the Supertrend and declining channels when a down-trend is detected by the Supertrend.
The look of the channels can remind of the Donchian channels indicator, and as such a similar usage can be appropriate. The extremities can for example be used as supports and resistances.
Additionally, the channel's average can be used to filter out noisy variations in the price while keeping a good distance from the price.
SuperTrend OptimizerHello!
This indicator attempts to optimize Supertrend parameters. To achieve this, 102 parameter combinations are tested concurrently - the top three performers are listed in descending order.
Parameters,
Factor: Changes to this parameter shifts the tested factor range. For instance, increasing the factor measure from 3.00 to 3.01 (+0.01) will remove 3.00 from the tested range - this setting controls the lower threshold of the range. The upper threshold, in all instances, is the lower Factor threshold + 3.3 (i.e. 3.0(lower) - 6.3(upper), 4.0(lower) - 7.3(upper), 2.5(lower) - 5.8(upper))
ATR period: Changes to this parameter shifts the tested ATR period range. For instance, increasing the ATR measure from 10 to 11 (+1) will remove 10 from the tested range - this setting controls the lower threshold of the range. The upper threshold, in all instances, is the lower threshold + 2 (i.e. 10(lower) - 12(upper), 11(lower) - 13(upper), 9(lower), - 11(upper))
The Factor parameter is modifiable to any positive decimal number; the ATR parameter is modifiable to any positive integer. Changing either parameter shifts the tested parameter combination range. Both parameters can be changed in the settings, to which you control the lower threshold of the range. If, for instance, you were to change the Factor measurement from 3.0 to 4.1 (+1.1) the 4.0 Factor measurement, and all Factor measures less than 4.0, will be excluded from the performance test.
Consequently, a Supertrend test will be performed with a Factor of 4.1 and an ATR period of 10 (default). This test repeats at 0.1 Factor intervals and 1.0 ATR intervals.
Therefore, assume you modify the Factor lower threshold to 3.1 and the ATR lower threshold to 10. The indicator will test three Supertrend systems with a Factor of 3.1 and an ATR period of 10.. then 11.. 12, then three systems with a Factor of 3.2 and an ATR period of 10.. then 11.. 12... until (lower Factor threshold + 3.3) and (lower ATR threshold + 2) are tested... which in this example is... a Factor of 6.4 and an ATR period of 12.
The tested Factor range and ATR range are displayed in a bottom right table alongside the top performing parameter combinations.
Of course, you can change the the lower thresholds, which means you can test numerous Supertrend parameter combinations! However, no greater than 102 parameter combinations will be tested simultaneously; the best performing Supertrend parameters are plotted on the chart automatically.
I will be working on this indicator more tomorrow! Let me know if you have questions or anything you would like included!
(I of course added something fun in the script. Be sure to try it with bar replay!)

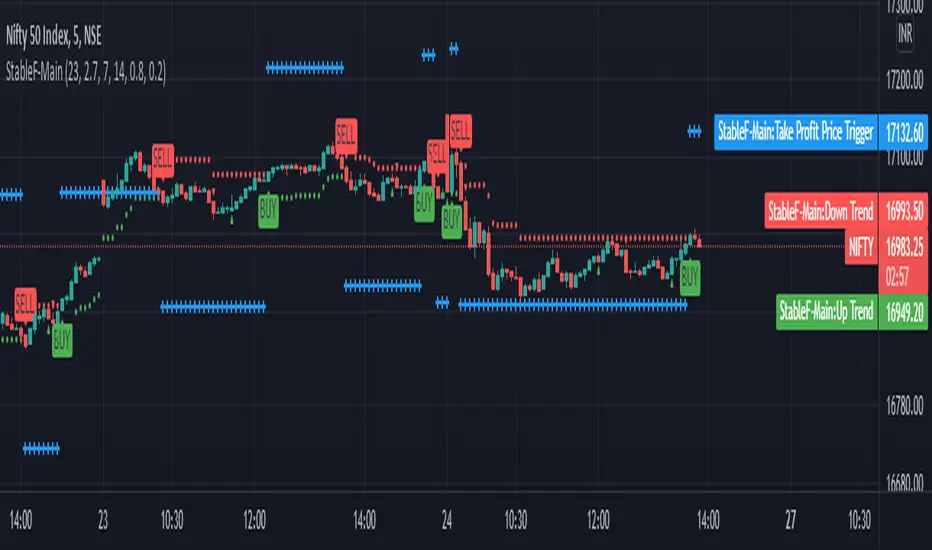
StableF-MainIt is combination of Built in Super trend and Adx with take profit
uptrend is considered when +dmi is above -dmi and +dmi is above 25 and adx is above 25 and supertrend gives Buy
downtrend is considered when -dmi is above +dmi and -dmi is above 25 and adx is above 25 and supertrend give sell
use fibo for target by taking as previous swing high and swing low
-supertrend crossover is referred as buy plotshape
-supertrend cross under is referred as Sell plotshape
-keep stoploss at dot line of supertrend
-adx-dmi crossover (+dmi crossed above -dmi) is shown by Triangle Up symbol
-adx-dmi crossunder( -dmi crosses below +dmi) is shown by Triangle down symbol
--Cross symbol with blue line with linewidth 2 is referred as Take profit
--combine this with adx -dmi setting with 7 and 14
----disclaimer-----
used free built in supertrend and adx so u can use same setting in other broker or in trading view
not responsible for any loss or gain
-only for educational purpose
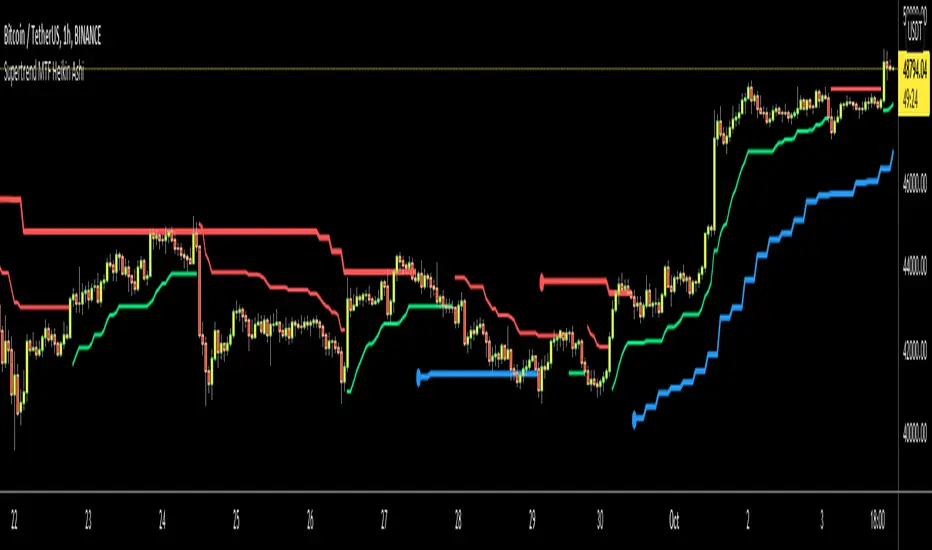
Supertrend MTF Heikin AshiThis is non-repaiting Supertrend Multi Time Frame script, uses Heikin Ashi Candles as source on normal chart
There is an option for Higher Time Frame. if you choose "Auto" then Higher Time Frame calculation is made by the script. If you choose "User Defined" option and then you can select Time Frame.
You better use this script with other indicators such as RSI, Momentum etc.
Enjoy!