Intraday Fibs RetracementFibonacci (Fibs) levels are often used by traders as a way to find support and resistance, based on the Fibonacci sequence. These levels are widely used in technical analysis to identify potential reversal points in the price of an asset.
Fibs retracement draws lines at these Fibs level between a significant high and low point on a price chart.
What it shows:
This indicator will automatically draw Fibs Retracement Levels on your chart without any manual work.
It is designed to be used for day trading, especially in scenarios where a ticker gaps up/down large compared to the prior day close. (i.e. scenario where the difference of day's open and prior day close is large)
The drawing will happen on each trading day the moment trading hours open, and will NOT draw during pre-market and post-market.
User can see the line of each Fibs level, labelled with the Fib percentage and price value for the corresponding levels.
User will specify a start and end point of Fibs and based on the choice the indicator will automatically compute the other user defined Fibs levels and display on the chart.
How to use it:
The Fib levels drawn can be a potential support and resistance zone. Therefore in scenario where you already have a position and are approaching one of these levels it could be a point to close out some or all the position as you are approaching a resistance. On the other hand when price do approach these levels you could enter a position for a reversal trade. These are few ways to use the indicator but there are other ways that can be used, which can be found out by researching "Fibonacci (Fibs) Retracement".
In the example on the chart you can see a price bounce from the 0.7886 Fibs level on this particular day, where the price gapped up and was coming down after market hours opened.
Key settings:
1. Fibs Retracement Start and end Point: User selects where the Fibs levels should be drawn.
Available Options are:
Start Points:
Market Open
Market Open High (Dependent on the time frame you are on)
Pre-market High
Day's High
End Points:
Previous Day Close
Previous Day Low
Previous Day High
Pre-market Low (Current Day)
Day's Low
2. Custom Fib Levels: User can manually enter the Fib levels they want to see. (Max 9)
Default values are: 0,0.236,0.382,0.5,0.618,0.786,1,1.618,2.618.
3. Display settings: User can specify the line colour, thickness and style.
4. Label Setting: User can choose to turn on/off the labels for the each Fibs Level. Label will show the fib percentage and the corresponding price. User can also choose the location of the labels, defined by an offset from the current candle.
----------------------------------------------------------------------
If anything is not clear please let me know!
Supportandresitance

Weekly Open Range [BigBeluga]
A precision weekly range tracker that captures early market positioning from the first moments of the trading week.
By dynamically measuring the highest and lowest points from the first three candles after the Sunday 21:00 UTC open, the indicator builds a reactive support and resistance framework for the week ahead.
It also visualizes the active range with a dynamic box and provides live updates of the current price movement against the established range boundaries.
🔵 KEY FEATURES
Automatically marks the weekly open range starting at Sunday 21:00 UTC .
Identify maximum high and minimum low from the first 3 candles after the weekly open.
if isWeeklyOpen or isWeeklyOpen or isWeeklyOpen or isWeeklyOpen
h = math.max(high, range_box.get_top())
l = math.min(low, range_box.get_bottom())
Draws two horizontal lines from the range extremes, acting as dynamic support/resistance zones throughout the week.
Visualizes the range with a semi-transparent box for clear zone identification.
Includes a compact dashboard panel with:
- Symbol and current price with bullish or bearish bar indication with ▲ / ▼
- Current weekly high/low range values
🔵 USAGE
Treat the high and low of the range as support/resistance zones for the week.
Combine with volume analysis or liquidity tools for entry confirmation .
Refresh your key levels every week as the indicator resets each Sunday night .
Works great alongside Smart Money Concepts (ICT) strategies and weekly planning.
Weekly Open Range gives traders a reliable structure to anchor their week. With clear range mapping, breakout signals, and intuitive visuals, it becomes a valuable part of any strategic trading approach—especially when precision timing around liquidity zones is key.

Price Map Profile [BigBeluga]An advanced volume-based tool designed to map out how trading activity is distributed across price levels. It combines dynamic volume profiling with structural pivot detection to highlight key levels of interest in the market — including hidden support/resistance zones and dominant liquidity areas.
Unlike traditional volume profiles locked to fixed sessions, this indicator continuously processes historical bars to build a real-time "map" of volume distribution. It intelligently reveals where buyers and sellers were most active, helping traders pinpoint high-impact zones with clarity.
🔵 KEY FEATURES
Creates a volume map profile by scanning price action over a defined lookback window (`length`).
Divides price vertically into volume bins (default: 100) and aggregates either total volume or bar count per bin.
Bins are plotted as horizontal zones extending to the right of the chart — wider offset means more volume at that price.
Each zone is color-coded using gradients to represent volume magnitude:
- Below average volume = cool tones (blue/teal)
- Above average volume = warm tones (red/orange)
The highest volume bin is highlighted with a red label showing the exact volume, helping to identify strong price agreement.
Detects pivot highs and lows using a 15-bar swing method, marking them as potential S/R levels.
If a pivot level is located inside a low-volume zone (volume < average), it is emphasized with a dashed line and label .
Pivot line color matches direction:
- High pivots = yellow
- Low pivots = aqua
The volume of the bin containing the pivot is shown alongside the pivot, providing volume context for the structural level.
Filters out nearby duplicate pivots using ATR-based distance checks to ensure clean and non-redundant signals.
🔵 HOW TO USE
Use the wide red zones as liquidity and consolidation areas where price may stall, reverse, or absorb volume.
Pivot-based dashed lines within low-volume zones highlight hidden support/resistance levels where price may react sharply.
Combine this indicator with trend or order flow tools to validate reversal or breakout setups .
Switch between Volume and Frequency modes to adapt to the type of data your asset provides.
🔵 CONCLUSION
The Price Map Profile transforms raw volume into an actionable visual map. By aligning volume depth with key market structure levels, it helps traders identify where market participants are most active — and where hidden inefficiencies lie. Ideal for traders seeking precision entries, dynamic S/R zones, and deeper volume structure insight.

Adaptive Support & Resistance Levels [StabTrading]The Adaptive S&R Levels indicator is designed to study support and resistance levels by synthesizing multiple well-known techniques for identifying these zones. It aims to provide traders with reliable price levels that reflect the collective perspective of market participants, using historical price action and projective techniques for extreme conditions.
💡 Introduction: Identified Problem
Traders often draw support and resistance lines using varied methods, leading to inconsistencies in where these levels are placed on charts. This variability can reduce the effectiveness of individual levels, as price may not react strongly to zones that lack broad recognition. The Adaptive S&R Levels indicator addresses this by aggressively averaging multiple established techniques to create support and resistance lines that align with what most traders are likely to identify, increasing the probability of price reactions.
🚀 How it Works: Overview
The indicator employs a multi-technique algorithm to generate support and resistance levels, ensuring they represent a consensus of trader perspectives.
🚀 How it Works: Chart Levels Display and Styling
Support levels, displayed in green below the current price, and resistance levels, shown in red above the price, are plotted clearly on the chart. Levels are numbered sequentially (e.g., v1, v2) as they move further from the current price, providing a visual hierarchy of proximity. Extreme levels, labeled as "Extreme Support" or "Extreme Resistance," are plotted in a bolder color to distinguish them as the outermost boundaries, maintaining the same green (support) and red (resistance) color scheme for consistency.
🚀 How it Works: Historical Price Action Algorithm
For areas with available historical data, the algorithm analyzes price action using a variety of recognized methods for drawing support and resistance, such as pivot points, swing highs/lows, and volume-based zones. It calculates a weighted average of these techniques to produce a “regression fit” line that reflects the accumulation of levels traders might draw. By prioritizing areas where multiple methods converge, the indicator identifies zones likely to be significant to a wide audience, enhancing their relevance.
🚀 How it Works: Projective Techniques Algorithm
In scenarios without recent historical price action—such as all-time highs or lows—the indicator employs an alternative algorithm that combines projective techniques commonly used by traders. These include Fibonacci extensions, Measured Moves (price projections), Psychological Milestones (e.g., round numbers), Channel/Trendline Extrapolation, and Time-Based Targets (inspired by methods like Gann techniques). The algorithm seeks a confluence of these methods to draw support and resistance levels that align with what most traders would consider significant in such conditions. These levels maintain the same green (support) and red (resistance) color scheme, with numbering based on their distance from the price.
🚀 How it Works: Noise Parameter Adjustment
Users can adjust a noise parameter to control the number of displayed levels. Lower settings show more lines, reflecting a broader range of potential zones but with less confluence. Higher settings increase the required confluence of techniques, resulting in fewer lines that have a higher probability of eliciting a price reaction. This customization allows traders to tailor the indicator to their preferred timeframe or trading style.
🔥 Features
Confluence-Based Levels: Support and resistance lines are derived from a weighted average of multiple techniques, aiming to mirror the levels most traders would recognize.
Extreme Levels: Generates support and resistance in areas without historical price action, using techniques like Fibonacci extensions and Measured Moves.
Color-Coded Display: Green support levels appear below the current price, and red resistance levels appear above, with extreme levels in a bolder shade for distinction.
Adjustable Noise Parameter: Users can modify the confluence threshold to display more lines (lower settings) or fewer, higher-probability lines (higher settings).
📈 Implementing the System
1. Adjust Settings
Set the noise parameter based on your trading style (0.1 to 10).
Use lower values for more frequent levels, suitable for scalping or short-term analysis.
Use higher values for fewer, higher-confluence levels, ideal for swing trading or longer-term strategies.
Adjust for your timeframe: Settings tend to be lower on shorter timeframes and higher on longer timeframes.
2. Identify Levels
Monitor green support levels below the price for potential buying zones, noting their numbered proximity (v1, v2, etc.).
Observe red resistance levels above the price for potential selling or shorting zones, noting their numbered proximity.
Note extreme levels (labeled "Extreme Support" or "Extreme Resistance") in areas like all-time highs, which may act as key reversal points.
3. Evaluate Price Reactions
Track how price interacts with the plotted levels to assess their effectiveness, considering their proximity to price.
Observe performance in bullish, bearish, or ranging markets to understand the indicator’s behavior at different levels.
Test different noise parameter settings across various assets and timeframes to find the optimal balance for your approach.
4. Layering Trades with Levels
Use the numbered levels to layer into a trade: for example, enter a partial position at a closer support level (e.g., v1) and add to it at a further level (e.g., v2) if price continues to decline, spreading risk across multiple zones.
Layer out of a trade by taking partial profits at each resistance level as price rises (e.g., reduce position at v1, then v2), or fully exit at an "Extreme Resistance" level to maximize gains while managing exposure.
🔶 Conclusion
The Adaptive S&R Levels indicator provides a framework for studying support and resistance by averaging multiple trader-recognized techniques. With its ability to handle both historical and extreme price scenarios, numbered levels for visual hierarchy, and customizable noise settings, it offers a versatile tool for analyzing key price levels. Designed for educational use, it encourages traders to test and observe how these consensus-driven levels align with market behavior within broader analysis.

Intraday LevelsWhat it shows:
This indicator is useful for day trading, where it will track and display you important price levels which includes:
Premarket Low (PML)
Premarket High (PMH)
Previous Day Low (PDL)
Previous Day High (PDH)
Previous Day Close (PDC)
After Hours Low (AHL)
After Hours High (AHH)
Day Low (DL)
Day High (DH)
The price level lines and labels will automatically adjust itself as the price moves, eliminating the need of manually having to adjusting these levels.
How to use it:
At these levels it can act as important support resistance points during the day and can often serve as a important pivot point for any ticker. You can expect price rejection or bounce when the price approaches these levels.
Key settings:
For each of the levels, user can adjust in the settings menu:
Line Colour
Line Thickness
Line Style
Label Text
Price Labelling on Label
Label Location (Offset from current bar)
Ability to turn on/off the price level and label
Display levels for either all days or on the day

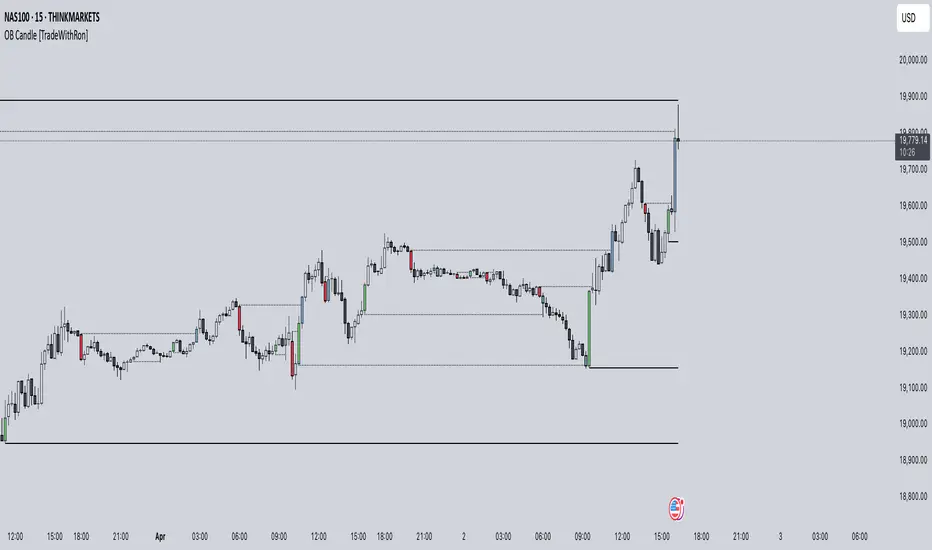
Order Block Candle [TradeWithRon]Order Block Candle
This indicator is designed to help traders identify and visualize key movements within the market. These order blocks are areas where significant buying or selling has occurred, often leading to a strong price reaction. This script detects both bullish and bearish order blocks (with volume spike), marking them directly on your chart, and offers a variety of customization options to enhance your trading experience.
Features:
Bullish and Bearish Candles: Bullish Order Block: Identified when the current price creates a higher high and closes above the previous price, indicating a zone of potential buying activity by institutional traders.
Bearish Order Block: Identified when the current price creates a lower low and closes below the previous price, suggesting strong institutional selling.
Volume-Weighted Analysis: The indicator allows traders to incorporate volume into the order block detection. When a volume pivot (a significant change in volume) is detected, it strengthens the validity of the identified order block.
Customizable Visuals:
- Users can adjust the color and style of order block lines, including solid, dashed, or dotted styles, to suit personal preferences.
- Bullish Order Block Color: Choose from a range of colors to highlight bullish order blocks (default is green).
- Bearish Order Block Color: Choose a color for bearish order blocks (default is red).
- Users can also customize the color and style of the lines representing order blocks, helping traders visually track key levels.
Candle Body or. Wick: The indicator provides flexibility in defining the price range of the order block. Traders can choose whether to calculate the order block using the candle body (open and close) or the full wick (high and low) to suit their trading strategy.
Dynamic Line Extensions: Order block lines are dynamically extended to provide ongoing support and resistance levels. When a price breaks an order block line, the line changes to a dotted style, marking it as "broken." This allows traders to easily spot when the market invalidates an order block.
Alerts:
- Alert for Bullish Order Block: Get notified when a new bullish order block is detected.
- Alert for Bearish Order Block: Receive alerts when a bearish order block is identified.
- Alert for Broken Lines: Set up alerts to be notified when a bullish or bearish order block line is broken, giving traders a signal for potential market shifts.
Zone Management:
- The indicator tracks upper and lower zone information, marking significant price levels where institutional buying or selling might occur. Traders can adjust settings to define how many previous lines should be displayed on the chart for reference.
Optional Mitigated Order Blocks:
- A feature that highlights mitigated (neutralized) order blocks with a specific color and line style, offering additional insight into market behavior.
Input Settings:
- Length: The number of bars to the left and right of a pivot point for it to be considered a high or low.
- Candle Body: Option to use the candle body for calculations (as opposed to the wick).
- Bullish and Bearish Candle Color: Customizable colors for bullish and bearish order blocks.
- Open Line Style: Choose between solid, dashed, or dotted line styles for order block visualization.
- Removed Old Lines: Control the number of broken lines shown on the chart.
- Mitigated Line Style: Select line style for mitigated order blocks.
- Volume Use: Enable volume-based detection for stronger order block validation.
How to Use:
This indicator is ideal for traders looking to trade around institutional support and resistance levels. The bullish and bearish order blocks can serve as key entry or exit points, while broken lines offer dynamic support/resistance that adapt to market changes. Use the alerts to stay informed of critical market developments and adjust your trading strategy accordingly.
🔶 Disclaimer
Use with Caution: This indicator is provided for educational and informational purposes only and should not be considered as financial advice. Users should exercise caution and perform their own analysis before making trading decisions based on the indicator's signals.
Not Financial Advice: The information provided by this indicator does not constitute financial advice, and the creator (Tradewithron) shall not be held responsible for any trading losses incurred as a result of using this indicator.
Backtesting Recommended: Traders are encouraged to backtest the indicator thoroughly on historical data before using it in live trading to assess its performance and suitability for their trading strategies.
Risk Management: Trading involves inherent risks, and users should implement proper risk management strategies, including but not limited to stop-loss orders and position sizing, to mitigate potential losses.
No Guarantees: The accuracy and reliability of the indicator's signals cannot be guaranteed, as they are based on historical price data and past performance may not be indicative of future
Money Flow Oscillator [BullByte]
Overview :
The Money Flow Oscillator is a versatile technical analysis tool designed to provide traders with insights into market momentum through the Money Flow Index (MFI). By integrating trend logic, dynamic support/resistance levels, multi-timeframe analysis, and additional indicators like ADX and Choppiness, this script delivers a detailed view of market conditions and signal strength—all while adhering to TradingView’s publication guidelines.
Key Features :
Money Flow Analysis :
Uses the MFI to assess buying and selling pressure, helping traders gauge market momentum.
Trend Switch Logic :
Employs ATR-based calculations to determine trend direction. The background color adjusts dynamically to signal bullish or bearish conditions, and a prominent center line changes color to reflect the prevailing trend.
Dynamic Support/Resistance :
Calculates oscillator support and resistance over a pivot lookback period. These levels help you identify potential breakouts or reversals as the MFI moves above or below prior levels.
Signal Metrics & Classifications :
Combines MFI values with additional metrics to classify signals into categories such as “Strong Bullish,” “Bullish,” “Bearish,” or “Strong Bearish.” An accompanying note provides details on momentum entry and overall signal strength.
Multi-Timeframe Order Flow Confirmatio n:
Analyzes the MFI on a higher timeframe to confirm order flow. This extra layer of analysis helps verify the short-term signals generated on your primary chart.
Volume and ADX Integration :
Incorporates volume analysis and a manual ADX calculation to further validate signal strength and trend stability. A dashboard displays these metrics for quick reference.
Choppiness Indicator :
Includes a choppiness index to determine if the market is trending or choppy. When the market is identified as choppy, the script advises caution by adjusting the overall signal note.
Comprehensive Dashboard :
A built-in dashboard presents key metrics—including ADX, MFI, order flow, volume score, and support/resistance details—allowing you to quickly assess market conditions at a glance.
How to Use :
Trend Identification : Monitor the dynamic background and center line colors to recognize bullish or bearish market conditions.
Signal Confirmation : Use the oscillator support/resistance levels along with the signal classifications and dashboard data to make informed entry or exit decisions.
Multi-Timeframe Analysis : Validate short-term signals with the higher timeframe MFI order flow confirmation.
Risk Management : Always combine these insights with your own risk management strategy and further analysis.
Disclaimer :
This indicator is provided for educational and informational purposes only. It does not constitute financial advice. Always perform your own analysis and use proper risk management before making any trading decisions. Past performance is not indicative of future results.

HEMA Trend Levels [AlgoAlpha]OVERVIEW
This script plots two Hull-EMA (HEMA) curves to define a color-coded dynamic trend zone and generate context-aware breakout levels, allowing traders to easily visualize prevailing momentum and identify high-probability breakout retests. The script blends smoothed price tracking with conditional box plotting, delivering both trend-following and mean-reversion signals within one system. It is designed to be simple to read visually while offering nuanced trend shifts and test confirmations.
█ CONCEPTS
The Hull-EMA (HEMA) is a hybrid moving average combining the responsiveness of short EMAs with the smoothness of longer ones. It applies layered smoothing: first by subtracting a full EMA from a half-length EMA (doubling the short EMA's weight), and then by smoothing the result again with the square root of the original length. This process reduces lag while maintaining clarity in direction changes. In this script, two HEMAs—fast and slow—are used to define the trend structure and trigger events when they cross. These crossovers generate "trend shift boxes"—temporary support or resistance zones drawn immediately after trend transitions—to detect price retests in the new direction. When price cleanly retests these levels, the script marks them as confirmations with triangle symbols, helping traders isolate better continuation setups. Color-coded bars further enhance visual interpretation: bullish bars when price is above both HEMAs, bearish when below, and neutral (gray) when indecisive.
█ FEATURES
Bullish and bearish bar coloring based on price and HEMA alignment.
Box plotting at each crossover (bullish or bearish) to create short-term decision zones.
Real-time test detection: price must cleanly test and bounce from box levels to be considered valid.
Multiple alert conditions: crossover alerts, test alerts, and trend continuation alerts.
█ USAGE
Use this indicator on any time frame and asset. Adjust HEMA lengths to match your trading style—shorter lengths for scalping or intraday, longer for swing trading. The shaded area between HEMAs helps visually define the current trend. Watch for crossovers: a bullish crossover plots a green support box just below price, and a bearish one plots a red resistance box just above. These zones act as short-term decision points. When price returns to test a box and confirms with strong rejection (e.g., closes above for bullish or below for bearish), a triangle symbol is plotted. These tests can signal strong trend continuation. For traders looking for clean entries, combining the crossover with a successful retest improves reliability. Alerts can be enabled for all key signals: trend shift, test confirmations, and continuation conditions, making it suitable for automated setups or discretionary traders tracking multiple charts.

TR FVG & Swing High Low FinderTR FVG & Swing Level Finder
Overview:
The TR FVG & Swing Level Finder is a powerful Pine Script indicator designed for traders who want to identify Fair Value Gaps (FVGs) and Swing Highs/Lows on their charts. This indicator combines two essential technical analysis tools into one, helping traders spot potential areas of support, resistance, and trend reversals. FVGs are price gaps that often act as areas of interest for price to return to, while swing highs and lows help identify key turning points in the market. The indicator is highly customizable, allowing users to adjust colors, limits, and display options to suit their trading style.
Key Features:
1: Fair Value Gap (FVG) Detection:
- Identifies Bullish FVGs: Occur when the high of two candles ago is lower than the low of the current candle, indicating a potential upward price movement.
- Identifies Bearish FVGs: Occur when the low of two candles ago is higher than the high of the current candle, indicating a potential downward price movement.
- Displays FVGs as colored boxes on the chart, with customizable border and fill colors based on the timeframe.
- Labels each FVG box with the corresponding timeframe (e.g., "1m FVG", "1h FVG", "Daily FVG").
2: Swing High and Swing Low Detection:
- Detects Swing Highs: A 3-candle pattern where the middle candle's high is higher than the highs of the candles on either side.
- Detects Swing Lows: A 3-candle pattern where the middle candle's low is lower than the lows of the candles on either side.
- Draws a solid black line with 50% opacity at each swing high and low, extending 5 bars to the right for better visibility.
- Adds a small Swing High or Swing Low label at the right end of each line, colored according to user-defined settings.
3: Timeframe-Specific FVG Visualization:
- FVGs are color-coded based on the chart's timeframe, making it easy to distinguish between FVGs on different timeframes.
- Each timeframe has its own fill color for bullish and bearish FVGs, with adjustable transparency for better chart clarity.
- A dashed black line is drawn in the middle of each FVG box to highlight the midpoint of the gap.
4: Customizable Display Options:
- FVG Limit: Control the maximum number of FVGs displayed on the chart (from 1 to 20).
- Extend Options for FVG Boxes:
- "None": FVG boxes extend only 2 bars to the right.
- "Limited": FVG boxes extend a user-defined number of candles to the right (1 to 100 candles).
- "Default": FVG boxes extend 3 bars to the right of the current bar.
- Color Customization:
- Set border colors for bullish and bearish FVGs.
- Adjust fill colors for FVGs on different timeframes (1m, 5m, 15m, 30m, 1h, 4h, Daily, Weekly, Monthly).
- Customize the colors of swing high and swing low labels.
5: Performance Optimization:
- The indicator only plots FVGs and swings on the last confirmed bar (barstate.islastconfirmedhistory), ensuring efficient performance and reducing chart clutter.
- Limits the number of displayed FVGs and swings to the user-defined fvgLimit, keeping the chart clean and focused on the most recent price action.
6: Inputs and Customization:
- Number of FVGs to Show (fvgLimit): Set the maximum number of FVGs and swings to display (default: 3, range: 1 to 20).
- Bullish FVG Border Color (bullishColor): Choose the border color for bullish FVGs (default: green).
- Bearish FVG Border Color (bearishColor): Choose the border color for bearish FVGs (default: red).
- Swing High Color (swingHighColor): Set the color for swing high labels (default: blue).
- Swing Low Color (swingLowColor): Set the color for swing low labels (default: purple).
- Extend Options:
- Extend Option (extendOption): Choose how far FVG boxes extend to the right ("None", "Limited", or "Default"; default: "Default").
- Extend Candles (extendCandles): If "Limited" is selected, specify the number of candles to extend FVG boxes (default: 8, range: 1 to 100).
- Timeframe-Specific Fill Colors:
- Customize fill colors for bullish and bearish FVGs on various timeframes (1m, 5m, 15m, 30m, 1h, 4h, Daily, Weekly, Monthly).
- Each fill color has a default transparency (e.g., 93% for most timeframes, 90% for 30m), which can be adjusted as needed.
How to Use:
1: Add the Indicator to Your Chart:
- Open TradingView, go to the Pine Editor, and paste the script.
- Click "Add to Chart" to apply the indicator to your current chart.
2: Adjust Settings:
- Open the indicator settings by clicking the gear icon next to the indicator name on your chart.
- Modify the inputs to suit your preferences:
- Set the number of FVGs and swings to display.
- Choose your preferred colors for FVGs and swings.
- Adjust the extend options for FVG boxes.
3: Interpret the Indicator:
- FVG Boxes: Look for colored boxes on the chart, which represent Fair Value Gaps. Bullish FVGs (green borders by default) suggest potential buying opportunities, while bearish FVGs (red borders by default) suggest potential selling opportunities. The label inside each box indicates the timeframe of the FVG.
- Swing Highs and Lows: Identify key turning points with solid black lines (50% opacity) at swing highs and lows. Each line extends 5 bars to the right, with an "SH" (Swing High) or "SL" (Swing Low) label at the end. Swing highs can act as resistance levels, while swing lows can act as support levels.
4: Combine with Your Strategy:
- Use FVGs to identify areas where price might return to fill the gap, often acting as support or resistance.
- Use swing highs and lows to spot potential trend reversals or to set stop-loss and take-profit levels.
- Combine the indicator with other tools (e.g., trendlines, moving averages) for a more comprehensive trading strategy.
Notes:
- The indicator works on all timeframes, but the appearance of FVGs and swings will vary depending on the chart's timeframe.
- For best results, use the indicator on a clean chart to avoid visual clutter, especially if you increase the fvgLimit.
- The swing high/low lines are drawn with 50% opacity to ensure they don’t overpower other chart elements, but they are still clearly visible.
Author’s Note:
This script was developed to help traders identify key price levels with ease. I hope it adds value to your trading! If you have any feedback or suggestions for improvement, feel free to leave a comment. Happy trading!

VICI Algo-V TableVICI Trading Solutions is proud to introduce another powerful tool from our internal trading process: ALGO V ATR Table.
This streamlined, data-rich table is designed to give traders quick and easy access to key support and resistance levels using Average True Range (ATR) data—without cluttering the chart. It’s a perfect complement to our previously released ALGO V indicator, which plots significant ATR-based levels directly on the chart. While that tool is highly effective, we understand that too much on the screen can overwhelm your workspace. That’s why we developed this clean, corner-based ATR Table —so you can stay focused on execution with clarity and confidence.
How It Works:
- The table displays critical ATR levels across multiple timeframes, helping you identify areas of potential support and resistance with precision.
- Each timeframe row is color-coded to reflect its current trend state:
- 🟩 Green – Price is above the cloud and trending up .
- 🟥 Red – Price is below the cloud and trending down .
- ⬜ Gray – Price is inside the cloud and in a neutral/indecisive zone.
- The number next to a gray level shows the price that must be broken to transition to a bullish or bearish trend.
This simple color system allows for immediate insight into market structure and directional bias across multiple timeframes—without second guessing or crowding your chart.
⚠️ Important Note: Due to how TradingView handles higher time frame data, this indicator is designed to function best when applied to a 5-minute or lower time frame. We recommend adding this to your execution chart for the most accurate and responsive data.
Recommended Use:
We suggest pairing this with the original ALGO V indicator to better understand how these levels behave, especially when they appear gray (neutral). This combination provides a full-spectrum view of trend strength, key zones, and potential breakouts .
Whether you’re a scalper, day trader, or swing trader, the ALGO V ATR Table will instantly add value to your trading workflow—offering clear, concise, and actionable insight at a glance.
Algo-V Indicator Can Be Found HERE:

Standard Deviation Lines v1.0Overview
The Standard Deviation Lines v1.0 indicator is designed to provide a statistical approach to market volatility by plotting multiple standard deviation levels based on price action. This tool helps traders identify key price levels where the market may experience significant reactions, making it useful for trend analysis, support/resistance identification, and volatility-based trading strategies.
Key Features
✅ Dynamic Standard Deviation Levels: Calculates and plots up to ±3 standard deviation levels, giving traders a clear view of price dispersion and potential overbought/oversold areas.
✅ Quadrant-Based Deviation Zones: Divides standard deviation ranges into smaller, meaningful levels (e.g., 0.214, 0.382, 0.50, 0.618, 0.786) for a granular analysis of price movements.
✅ VIX Integration for Volatility Adjustment: Incorporates CBOE:VIX to dynamically adjust standard deviation levels based on market volatility.
✅ Weekly vs. Daily Mode: Users can toggle between weekly and daily standard deviation calculations to adapt to different trading strategies.
✅ Auto-Updating Levels: The indicator refreshes at market close (17:00), ensuring traders work with the latest price data.
✅ Customizable Display: Uses color-coded lines to differentiate between positive and negative deviations, with dashed lines for mid-levels and key support/resistance areas.
How to Use
📌 Trend & Volatility Analysis – Higher standard deviation levels indicate strong price movements, helping traders assess trend strength and market volatility.
📌 Reversal & Continuation Signals – Prices reaching extreme standard deviation levels (±2 or ±3) may suggest potential reversals or breakouts.
📌 Support & Resistance Zones – The quadrant-based deviation zones help identify hidden support/resistance areas where price may react.
📌 Risk Management – Traders can use standard deviation bands to set stop-loss and take-profit levels based on statistical price dispersion.
Best For
🔹 Day traders & swing traders looking to incorporate volatility-based strategies.
🔹 Mean reversion traders who capitalize on price returning to statistical averages.
🔹 Momentum traders who want to confirm trend strength and continuation.
Try the Standard Deviation Lines v1.0 now and enhance your market analysis with a statistical edge!
Volume Order Blocks [BigBeluga]Volume Order Blocks is a powerful indicator that identifies significant order blocks based on price structure, helping traders spot key supply and demand zones. The tool leverages EMA crossovers to determine the formation of bullish and bearish order blocks while visualizing their associated volume and relative strength.
🔵 Key Features:
Order Block Detection via EMA Crossovers:
Plots bullish order blocks at recent lows when the short EMA crosses above the long EMA.
Plots bearish order blocks at recent highs when the short EMA crosses below the long EMA.
Uses customizable sensitivity through the “Sensitivity Detection” setting to fine-tune block formation.
Volume Collection and Visualization:
Calculates the total volume between the EMA crossover bar and the corresponding high (bearish OB) or low (bullish OB).
Displays the absolute volume amount next to each order block for clear volume insights.
Percentage Volume Distribution:
Shows the percentage distribution of volume among bullish or bearish order blocks.
100% represents the cumulative volume of all OBs in the same category (bullish or bearish).
Order Block Removal Conditions:
Bullish order blocks are removed when the price closes below the bottom of the block.
Bearish order blocks are removed when the price closes above the top of the block.
Helps maintain chart clarity by only displaying relevant and active levels.
Midline Feature:
Dashed midline inside each order block indicates the midpoint between the upper and lower boundaries.
Traders can toggle the midline on or off through the settings.
Shadow Trend:
Shadow Trend dynamically visualizes trend strength and direction by adapting its color intensity based on price movement.
🔵 Usage:
Supply & Demand Zones: Use bullish and bearish order blocks to identify key market reversal or continuation points.
Volume Strength Analysis: Compare volume percentages to gauge which order blocks hold stronger market significance.
Breakout Confirmation: Monitor block removal conditions for potential breakout signals beyond support or resistance zones.
Trend Reversals: Combine EMA crossovers with order block formation for early trend reversal detection.
Risk Management: Use OB boundaries as potential stop-loss or entry points.
Volume Order Blocks is an essential tool for traders seeking to incorporate volume-based supply and demand analysis into their trading strategy. By combining price action, volume data, and EMA crossovers, it offers a comprehensive view of market structure and potential turning points.

Psych LevelWhat it shows:
This indicator will show a horizontal line at a psychological value which can be user defined. (Psychological values are round numbers, like 10,50,100,1000 and so on...)
At these Psychological value there are often limit orders placed for both buying and selling and can often act as support and resistances.
Therefore it is useful to pre-draw these levels beforehand and this indicator will speed up the process doing so by adjusting few different settings and draw them automatically.
How to use it:
At these Psychological value there are often limit orders placed for both buying and selling and can often act as support and resistances. This is often the case when you look at limit orders at such levels on bookmap or level 2 data.
At these psychological levels it can be set as a target of your trade or as risk levels when taking a trade in either of direction. Obviously this alone shouldn't dictate the trade you should take but can be a valuable info to supplement your trade.
On the chart it is clear to see these psychological level lines are acting as resistances/supports.
Key settings:
Interval: Interval levels will be drawn for, between the minimum and maximum values inputted by the user. Minimum value allowed is 1.
Min. value: Minimum value of Psychological level that will be drawn. Minimum value allowed is 1.
Max value: Maximum value of Psychological level that will be drawn. Minimum value allowed is 1.
Line colour: Colour of line drawn.
Line width: Width of line drawn.
Line style: Style of line drawn, either solid, dotted or dashed.
Label offset: Offset of where where label will be, measured from current bar. Offset of 0 will be drawn at current bar location, any positive number will move to the right by the set amount.
Text Colour: Colour of label text
Text size: Size of label text
Example: Chart here shows setting for minimum value as 100, maximum value as 140 and interval as 5. In this setting lines will be automatically drawn at: 100,105,110,115,120,125,130,145 and 140.
The flexibility of user defined max/min and interval values allows to be accommodated for price with different price tags, including stocks under $10.
----------------------------------------------------------------------
If anything is not clear please let me know!

Air Gap MTF with alert settingsWhat it shows:
This indicator will show a horizontal line at a price where each EMAs are on on different time frames, which will remove the effort of having to flick through different time frames or look at different chart.
The lines itself will move in real time as price moves and therefore as the EMA values changes so no need to manually adjustment the lines.
How to use it:
The price gap between each of the lines are known as "air gaps", which are essentially zones price can move with less resistance. Therefore bigger the airgap there is more likely more movement in price.
In other words, where lines are can be a resistance (or support) and can expect price stagnation or rejection.
On the chart it is clear to see lines are acting as resistances/supports.
Key settings:
The time frame are fixed to: 30min, 1hr and 4hr. This cannot be changed as of now.
EMA values for each time frame are user changeable in the settings, and up to 4 different values can be chosen for each time frame. Default is 5,12,34 and 50 for each timeframe.
Line colour, thickness and style can be user adjusted. Start point for where line will be drawn can be changed in the settings, either: start of day, user defined start or across the chart. In case of user defined scenario user can input a number that specifies a offset from current candle.
Label colour, font, alignment, text size and text itself can be user adjusted in the settings. Price can be also displayed if user chooses to do so. Position of label (offset from current candle) is user specified and can be adjusted by the user.
Both the lines and labels can be turned off (both and individually), for each lines.
Alert Settings:
Manually, user can set alerts for when price crosses a specific line.
This can be done by:
right click on any of line
choose first option (add alert on...)
On the second option under condition, use the dropdown menu to choose the desired EMA/timeframe to set alert for.
Hit "create" at bottom right of option
----------------------------------------------------------------------
If anything is not clear please let me know!

VWAP Balance Zones - SessionsVWAP Balance Zones Sessions Version is an alternate take on the Original VWAP Balance Zones indicator. The Sessions version allows users to select a specific session to view the VWAP Balance Zones at while still utilizing the full ETH Data.
The Session version provides a better focused display while still maintaining the core functions of the original script with mindful optimizations.
Author's Note: "VBZ Sessions was made with logistics in mind, for the users who only trade within certain times of the day. While it displays the same core concepts, it is not as "Raw" of a display as the Original. For this reason, some users may prefer the Original VWAP Balance Zones, which is why I have opted to release this alternate version instead of updating the original."
> What are VWAP Balance Zones?
"VWAP Balance Zones" is an original concept aimed at identifying the equilibrium area between market participants within the current trend by averaging the Daily Extremes and the Daily VWAP.
Refer to the illustration below for a better understanding of exactly how VWAP Balance Zones are formed:
These zones are displayed for the Daily, Weekly, and Monthly VWAPs, with the most interactive timeframe being the Daily.
> Features
1. The Session Version uses ETH data at all times, and does not solely rely on the chart's data to create the VWAPs or Zones.
This allows the user to focus on a specific trading session, while not losing out on the full VBZ Calculation, with the notable benefit of a cleaner display.
The Original VBZ starts drawing at the beginning of the chart's "Day", and would produce different results when using an RTH chart vs an ETH chart. Along with creating a bird's nest of unusable data at the beginning of the day.
2. Session Start and End lines are displayed for easier identification of the designated trading session.
3. The extreme "Close" Lines are no longer displayed to reduce noise and redundancy.
4. Additionally, the interior VWAP lines are no longer displayed. Ultimately, this was to reduce noise and focus the script on the 50% zones.
5. Weekly and Monthly Zones are now displayed due to the reduced noise!
6. As with the original, the weekly display will yield to the daily, and the monthly display will yield to the weekly.
In the screenshot below, you can observe this behavior.
Enjoy!

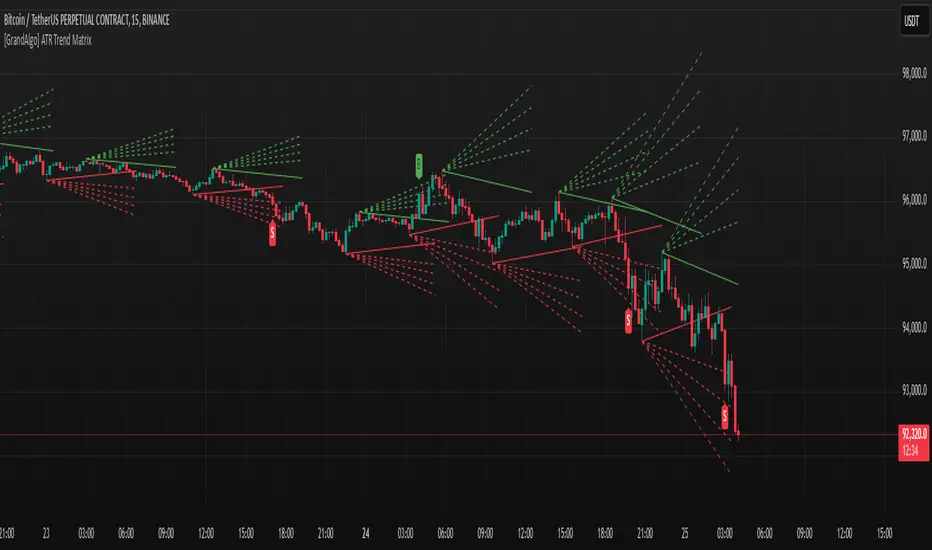
[GrandAlgo] ATR Trend MatrixThe ATR Trend Matrix is a dynamic trendline indicator designed to help traders visualize market structure using ATR-based trend projections. This tool adapts to price action and highlights potential support and resistance zones based on Average True Range (ATR) calculations.
Key Features
ATR-Based Trendlines – Calculates and plots dynamic trendlines using an adjustable ATR factor.
Multi-Level Matrix System – Provides up to four matrix levels, each customizable with different ATR multipliers.
Swing High & Low Detection – Automatically detects market pivots to serve as anchor points for trendlines.
Adjustable Trend Length – Fine-tune the sensitivity of trendlines using the Swing Length and Trend-Line Length Multiplier.
Auto-Adjustment Mode – When enabled, trendlines update dynamically as ATR evolves.
Buy & Sell Signals – Marks potential trade setups when price crosses below or above Matrix Level 1.
How It Works
Detects Swing Points – Identifies key highs and lows in the market using the length setting.
Plots ATR-Based Trendlines – Calculates trendlines using ATR with user-defined multipliers for four matrix levels.
Adjusts Dynamically – If Auto Adjust is enabled, trendlines shift with ATR movements.
Identifies Trade Signals – Highlights potential buy/sell zones when price interacts with Matrix Level 1 trendlines.
Manages Active Trendlines – Automatically updates and removes trendlines based on price interaction.
User Settings
General Settings
ATR Factor – Controls the ATR multiplier for trendline calculation.
Swing Length – Defines the number of bars for swing high/low detection.
Trend-Line Length Multiplier – Adjusts the extension length of trendlines.
Auto Adjust Trendlines – Enables real-time adjustment of trendlines as ATR changes.
Matrix Settings
Matrix Level 1-4 – Enable or disable individual trendline levels.
Matrix Factors – Customize the ATR multipliers for each matrix level.
Trading Applications
Trend Confirmation – Use the primary trendline and matrix levels to gauge trend strength.
Support & Resistance Zones – ATR-based trendlines can act as dynamic support/resistance.
Breakout & Rejection Signals – Identify potential breakouts or reversals when price interacts with matrix levels.
Volatility-Based Trading – ATR helps adjust trendlines based on market volatility.
The ATR Trend Matrix is a powerful tool for traders who want a dynamic, adaptive trendline system that reacts to market structure and volatility. With customizable settings, multi-level ATR projections, and trade signal detection, this indicator provides a comprehensive approach to price action analysis.
Doubled Numbered Square of Nine Progression | RegressionThe Doubled Number Square of Nine Progression | Regression Indicator enables forecasting of support and resistance levels using the SQ9 progression or regression from a user-selected pivot price. The indicator also plots adjustable pivots on both the chart and the Square of Nine.
How to use to forecast support and resistance levels:
1. Select a Pivot Point: Choose a top or bottom pivot to use as the starting point. Select High or Low in the indicator to set the correct price to the pivot.
2. Set Price Increment or Decrement: Select a price increment to advance the starting price on the Square of Nine (for example 1 or -0.01).
3. Rotate to add or decrease the number of rungs on the Square on Nine: Rotate the Square of Nine and adjust the dimensions. The horizontal levels correlate to the rotation of the Square of Nine.
4. Plot Levels: Select a Square of Nine angle to plot the support and resistance levels based on the selected increments. These levels auto expand and decrease depending on the number of rotations in step 3. The price values from each of the selected diagonal or cardinal cross are applied to the chart with labels on both left and right. Left labels represent the cell the time variable and the right label is price.
5. Review Levels: Conduct a simple review of the plotted support and resistance levels in relation to recent market pivots.
6. Identify Correlations: Identify the Square of Nine cardinal cross or diagonal cross angle that correlates with the most market pivots.
7. The indicator plots user-adjustable pivots on both candles/bars and displays their placement on the Square of Nine in both Progression and Regression. The close price is plotted on the Square of Nine in real-time with a white background. This helps users identify which angles the highs and lows favor from the selected pivot. The pivot levels' colors can be adjusted.
Each market has its tendencies, favoring specific angles from the cardinal or diagonal cross. The basic idea is to choose between the diagonal cross and cardinal cross angles to forecast support and resistance levels.
Settings:
Overview:
Example on Forecasting Support and resistance level using this indicator:
In the image above, I'm progressing from the significant low at a rate of $200 per cell. Based on the plotted pivots, I've selected the 315-degree angle on the diagonal cross as it aligns with a few recent pivots. Now, I've drawn a vertical line to show that as we add rungs to the Square of Nine, we introduce support and resistance levels based on the identified angle that aligns with these early pivots from the low.
In the image below, I've moved forward in time to show how the initial angle selected based on the early pivot forecasted support and resistance levels around the high in BTC. Do not expect the price to turn sharply at the levels the indicator generates, but use it to help identify SQ9 levels that may form market turns. As P. Mikula mentions in his work, "The Square of Nine successfully defines market price swings but it does not make the market form pivots."
This indicator includes enhancements made to the Gann Square of Nine indicator originally created by @ThiagoSchmitz.
This indicator is inspired by the methodologies detailed by Patrick Mikula in his book " The Definitive Guide to Forecasting using W.D Gann's Square of Nine ." I recommend checking it out. He also mentions another use case as a Price and Time chart in his " Gann Scientific Method Unveiled, Volume 2 ." FYI, I am not affiliated with Patrick Mikula in any way.
Known Issues:
Close price plotted on the Square of Nine in Regression "from a high pivot" takes a current candle to close in order to be plotted. Progression works as expected.

WhaleTrackBITGET:BTCUSDT.P
WhaleTrack – Volume Heatmap to Uncover Institutional Trading Activity
Overview
WhaleTrack is a volume-based heatmap indicator designed to reveal areas of high institutional trading activity. The indicator helps traders identify hidden support and resistance levels, analyze trend sustainability, and optimize stop-loss placements by displaying where significant market participants (whales) have historically traded in large volumes.
Institutions and large traders often push price into areas of historical liquidity to trigger retail stop-losses and fill their own large orders at optimal prices. WhaleTrack visualizes these critical areas, allowing traders to anticipate future price movements based on past institutional behavior.
How WhaleTrack Works
WhaleTrack analyzes historical trading volume and calculates a normalized volume intensity relative to the moving average (SMA). This data is then mapped onto a heatmap that highlights key liquidity zones.
1. Volume Normalization & SMA-Based Calculation
The script calculates the ratio of current volume to its SMA-based average.
Zones with significantly high volume spikes are identified as key liquidity areas where large traders may have accumulated or distributed assets.
The volume is quantized into different levels, ranging from Low to Extreme, creating a clear heatmap gradient.
2. Why Do Whales Manipulate Liquidity?
Large traders (whales) need liquidity to execute their orders.
They push price into historical high-volume areas to trigger stop-losses and force retail traders into selling.
This behavior allows them to accumulate at lower prices or distribute at higher prices before a major move.
Whale zones often act as support/resistance because institutions tend to protect their previous accumulation or distribution levels.
3. Heatmap Color Model & Zone Classification
WhaleTrack assigns volume intensity levels based on historical market participation:
Low → Minimal volume, weak interest
Low-Mid → Slightly increased volume
Mid → Standard trading activity, no major anomalies
Mid-High → Significant increase in volume, possible whale activity
High → Strong liquidity pool, institutional interest
Extreme → Highly concentrated volume, key reversal area
By observing these zones, traders can determine whether a price level is likely to hold as support or resistance , or if a breakout has the strength to sustain.
Trading Applications of WhaleTrack
WhaleTrack can be used to identify trade setups based on liquidity behavior:
1. Identifying Hidden Reversal Points (Support & Resistance)
Large Whale Zones below price → Likely strong support.
Large Whale Zones above price → Likely strong resistance.
These zones often lead to reversals, as large traders defend their previous positions.
2. Evaluating Trend Sustainability
A strong uptrend should leave multiple high-volume zones behind.
If no new high-volume zones form, the trend may be unsustainable.
High volume clusters in trend direction? → Likely trend continuation.
3. Optimizing Stop-Loss Placement
Placing stops inside whale zones increases stop-out risk.
Setting stops below whale buy zones protects against premature liquidation.
Stops above whale sell zones help avoid fake breakouts.
Customization & Settings
WhaleTrack is designed with flexibility in mind, offering multiple customization options:
1. Layout & Color Models
WhaleTrack Default – optimized for whale volume tracking
Model 1 & Model 2 – alternative heatmap color schemes
Contrast Mode – high visibility
White-Black & Black-White – for different chart backgrounds
Custom 1 & Custom 2 – user-defined color configurations
2. Advanced Options
Draw Full Candle Boxes – display full candle height or a partial range
Legend Visibility & Positioning – control placement of the heatmap legend
Exponential Color Model – choose between logarithmic and linear volume representation
Max Transparency Settings – adjust visibility of older zones
Number of Heatmap Colors – set the gradient sensitivity
3. Data Optimization Settings
Lookback Period – define how many bars are analyzed for volume normalization
Max Box Display – limit the number of displayed volume zones
Data Saver Mode – increase range at the expense of detail
Minimum Volume Threshold – filter out insignificant volume clusters
Disclaimer
This indicator is for educational and informational purposes only. It does not provide financial advice or guarantee future performance. Trading is risky—conduct your own research before making any investment decisions.

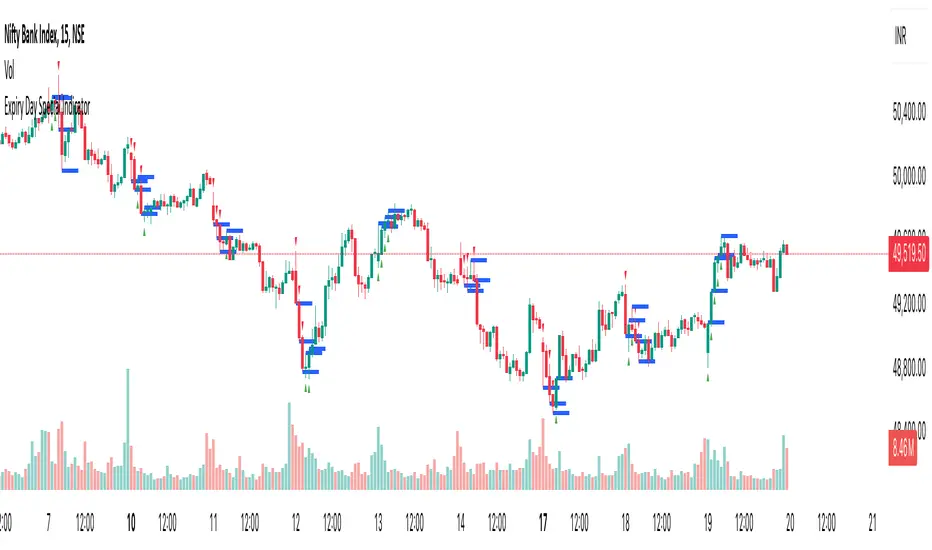
Expiry Day Special IndicatorExpiry Day Special Indicator
The Expiry Day Special Indicator is designed to detect catalytic price action patterns that commonly occur between 9:15 AM to 10:15 AM (IST) in the Nifty & Bank Nifty markets but not limited to these specific markets. While these patterns are particularly useful on expiry days, they are not limited to expiry trading alone. They can also be applied on other trading days when similar conditions arise, making them versatile for intraday traders.
How It Works
This indicator scans for bullish and bearish price action patterns within the first trading hour and plots potential buy and sell signals based on key market structures.
• Bearish Patterns: Identifies strong rejection zones and weakness in price action to signal potential short trades.
• Bullish Patterns: Recognizes reversal formations that indicate potential long trade opportunities.
• Time Filter: The setup is valid only between 9:15 AM - 10:15 AM (IST) to focus on high-impact market moves.
Why This Indicator?
1. Specialized for Nifty & Bank Nifty – Designed specifically for Indian markets.
2. Early Trend Identification – Helps traders capture moves early in the session.
3. Works Beyond Expiry Days – Although optimized for expiry trading, it can also detect similar patterns on regular days.
📌 Note: This indicator does not provide trading advice; always use proper risk management.
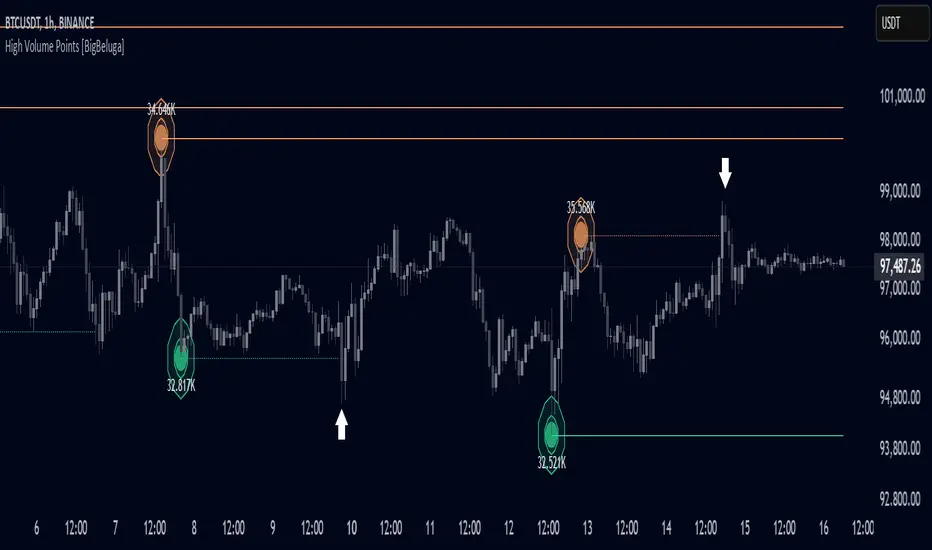
High Volume Points [BigBeluga]High Volume Points is a unique volume-based indicator designed to highlight key liquidity zones where significant market activity occurs. By visualizing high-volume pivots with dynamically sized markers and optional support/resistance levels, traders can easily identify areas of interest for potential breakouts, liquidity grabs, and trend reversals.
🔵 Key Features:
High Volume Points Visualization:
The indicator detects pivot highs and lows with exceptionally high trading volume.
Each high-volume point is displayed as a concentric circle, with its size dynamically increasing based on the volume magnitude.
The exact volume at the pivot is shown within the circle.
Dynamic Levels from Volume Pivots:
Horizontal levels are drawn from detected high-volume pivots to act as support or resistance.
Traders can use these levels to anticipate potential liquidity zones and market reactions.
Liquidity Grabs Detection:
If price crosses a high-volume level and grabs liquidity, the level automatically changes to a dashed line.
This feature helps traders track areas where institutional activity may have occurred.
Volume-Based Filtering:
Users can filter volume points by a customizable threshold from 0 to 6, allowing them to focus only on the most significant high-volume pivots.
Lower thresholds capture more volume points, while higher thresholds highlight only the most extreme liquidity events.
🔵 Usage:
Identify strong support/resistance zones based on high-volume pivots.
Track liquidity grabs when price crosses a high-volume level and converts it into a dashed line.
Filter volume points based on significance to remove noise and focus on key areas.
Use volume circles to gauge the intensity of market interest at specific price points.
High Volume Points is an essential tool for traders looking to track institutional activity, analyze liquidity zones, and refine their entries based on volume-driven market structure.
[GrandAlgo] MTF Historical Highs and LowsMany traders rely on weekly highs and lows to identify key market levels, but what if you could see how price reacted to these levels in past weeks, months, or even years? With MTF Historical Highs and Lows, you can visualize all past highs, lows, and midpoints from any timeframe, allowing you to refine your strategy and make more informed trading decisions.
This indicator retrieves and plots historical highs, lows, and midpoints based on a user-selected timeframe (default: Weekly). It dynamically updates, ensuring that all significant price levels remain visible on your chart. Additionally, smart filtering helps you focus only on relevant levels, and alerts notify you when price interacts with key zones.
Key Features:
✅ Automatically Fetches & Plots Historical Highs, Lows, and Midpoints
✅ Customizable Timeframes (default: Weekly, but adjustable)
✅ Visibility Filtering – Hides lines that are too far from the current price
✅ Alerts for Key Levels – Get notified when price touches an important historical level
✅ Customizable Colors & Display Preferences for clarity
How It Works:
1️⃣ Select a Date Range – Focus on historical levels that are most relevant to the current market conditions
2️⃣ Choose a Timeframe – Use Weekly, Monthly, or any timeframe that suits your strategy.
3️⃣ Enable Highs, Lows, and Midpoints – Customize what you want to see.
4️⃣ Adjust Filtering – Hide lines that are too far from the current price to reduce clutter.
5️⃣ Get Alerts – Be notified when price reaches a historical level for potential trade setups.
Ideal for Traders Who:
Trade Support & Resistance Levels – Understand how price reacts at historical highs and lows.
Analyze Market Structure – Identify key areas where price may reverse or break out.
Want Smart Alerts – Stay informed without staring at charts all day.

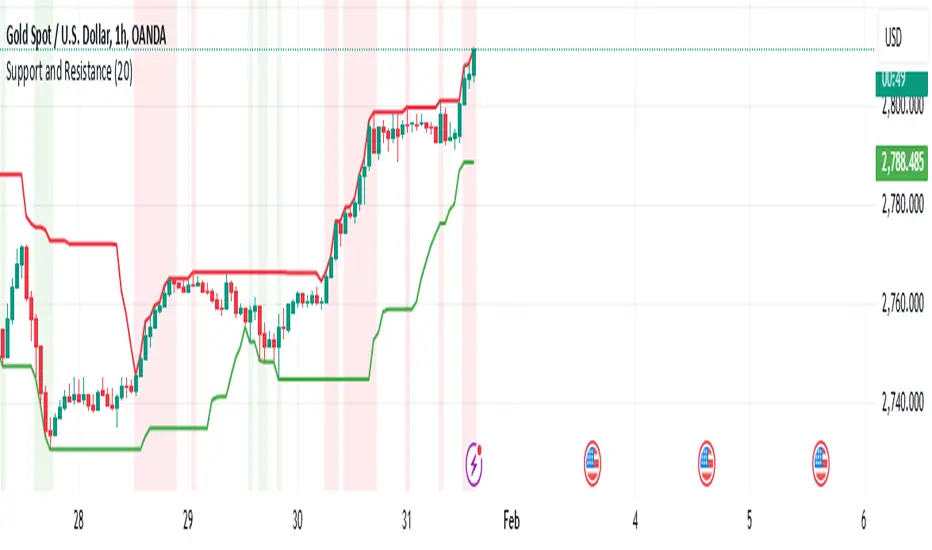
Support and Resistancelookback: This input allows you to specify the number of bars to look back to calculate the support and resistance levels.
support: This is calculated as the lowest low over the specified lookback period.
resistance: This is calculated as the highest high over the specified lookback period.
plot: The support and resistance levels are plotted on the chart with different colors.
bgcolor: This optional feature highlights the support and resistance zones with a semi-transparent background color.
Fibonacci 3-D🟩 The Fibonacci 3-D indicator is a visual tool that introduces a three-dimensional approach to Fibonacci projections, leveraging market geometry. Unlike traditional Fibonacci tools that rely on two points and project horizontal levels, this indicator leverages slopes derived from three points to introduce a dynamic element into the calculations. The Fibonacci 3-D indicator uses three user-defined points to form a triangular structure, enabling multi-dimensional projections based on the relationships between the triangle’s sides.
This triangular framework forms the foundation for the indicator’s calculations, with each slope (⌳AB, ⌳AC, and ⌳BC) representing the rate of price change between its respective points. By incorporating these slopes into Fibonacci projections, the indicator provides an alternate approach to identifying potential support and resistance levels. The Fibonacci 3-D expands on traditional methods by integrating both historical price trends and recent momentum, offering deeper insights into market dynamics and aligning with broader market geometry.
The indicator operates across three modes, each defined by the triangular framework formed by three user-selected points (A, B, and C):
1-Dimensional (1-D): Fibonacci levels are based on a single side of the triangle, such as AB, AC, or BC. The slope of the selected side determines the angle of the projection, allowing users to analyze linear trends or directional price movements.
2-Dimensional (2-D): Combines two slopes derived from the sides of the triangle, such as AB and BC or AC and BC. This mode adds depth to the projections, accounting for both historical price swings and recent market momentum.
3-Dimensional (3-D): Integrates all three slopes into a unified projection. This mode captures the full geometric relationship between the points, revealing a comprehensive view of geometric market structure.
🌀 THEORY & CONCEPT 🌀
The Fibonacci 3-D indicator builds on the foundational principles of traditional Fibonacci analysis while expanding its scope to capture more intricate market structures. At its core, the indicator operates based on three user-selected points (A, B, and C), forming the vertices of a triangle that provides the structural basis for all calculations. This triangle determines the slopes, projections, and Fibonacci levels, aligning with the unique geometric relationships between the chosen points. By introducing multiple dimensions and leveraging this triangular framework, the indicator enables a deeper examination of price movements.
1️⃣ First Dimension (1-D)
In technical analysis, traditional Fibonacci retracement and extension tools operate as one-dimensional instruments. They rely on two price points, often a swing high and a swing low, to calculate and project horizontal levels at predefined Fibonacci ratios. These levels identify potential support and resistance zones based solely on the price difference between the selected points.
A one-dimensional Fibonacci showing levels derived from two price points (B and C).
The Fibonacci 3-D indicator extends this one-dimensional concept by introducing Ascending and Descending projection options. These options calculate the levels to align with the directional movement of price, creating sloped projections instead of purely horizontal levels.
1-D mode with an ascending projection along the ⌳BC slope aligned to the market's slope. Potential support is observed at 0.236 and 0.382, while resistance appears at 1.0 and 0.5.
2️⃣ Second Dimension (2-D)
The second dimension incorporates a second side of the triangle, introducing relationships between two slopes (e.g., ⌳AB and ⌳BC) to form a more dynamic three-point structure (A, B, and C) on the chart. This structure enables the indicator to move beyond the single-axis (price) calculations of traditional Fibonacci tools. The sides of the triangle (AB, AC, BC) represent slopes calculated as the rate of price change over time, capturing distinct components of market movement, such as trend direction and momentum.
2-D mode of the Fibonacci 3-D indicator using the ⌳AC slope with a descending projection. The Fibonacci projections align closely with observed market behavior, providing support at 0.236 and resistance at 0.618. Unlike traditional zigzag setups, this configuration uses two swing highs (A and B) and a swing low (C). The alignment along the descending slope highlights the geometric relationships between selected points in identifying potential support and resistance levels.
3️⃣ Third Dimension (3-D)
The third dimension expands the analysis by integrating all three slopes into a unified calculation, encompassing the entire triangle structure formed by points A, B, and C. Unlike the second dimension, which analyzes pairwise slope relationships, the 3-D mode reflects the combined geometry of the triangle. Each slope contributes a distinct perspective: AB and AC provide historical context, while BC emphasizes the most recent price movement and is given greater weight in the calculations to ensure projections remain responsive to current dynamics.
Using this integrated framework, the 3-D mode dynamically adjusts Fibonacci projections to balance long-term patterns and short-term momentum. The projections extend outward in alignment with the triangle’s geometry, offering a comprehensive framework for identifying potential support and resistance zones and capturing market structures beyond the scope of simpler 1-D or 2-D modes.
Three-dimensional Fibonacci projection using the ⌳AC slope, aligning closely with the market's directional movement. The projection highlights key levels: resistance at 0.0 and 0.618, and support at 1.0, 0.786, and 0.382.
By leveraging all three slopes simultaneously, the 3-D mode introduces a level of complexity particularly suited for volatile or non-linear markets. The weighted slope calculations ensure no single price movement dominates the analysis, allowing the projections to adapt dynamically to the broader market structure while remaining sensitive to recent momentum.
Three-dimensional ascending projection. In 3D mode, the indicator integrates all three slopes to calculate the angle of projection for the Fibonacci levels. The resulting projections adapt dynamically to the overall geometry of the ABC structure, aligning with the market’s current direction.
🔂 Interactions: Dimensions. Slope Source, Projections, and Orientation
The Dimensions , Projections , and Orientation settings work together to define Fibonacci projections within the triangular framework. Each setting plays a specific role in the geometric analysis of price movements.
♾️ Dimension determines which of the three modes (1-D, 2-D, or 3-D) is used for Fibonacci projections. In 1-D mode, the projections are based on a single side of the triangle, such as AB, AC, or BC. In 2-D mode, two sides are combined, producing levels based on their geometric relationship. The 3-D mode integrates all three sides of the triangle, calculating projections using weighted averages that emphasize the BC side for its relevance to recent price movement while maintaining historical context from the AB and AC sides.
A one-dimensional Fibonacci projection using the ⌳AB slope with a neutral projection. Important levels of interaction are highlighted: repeated resistance at Level 1.0 and repeated support at Levels 0.5 and 0.618. The projection aligns horizontally, reflecting the relationship between points A, B, and C while identifying recurring zones of market structure.
🧮 Slope Source determines which side of the triangle (AB, AC, or BC) serves as the foundation for Fibonacci projections. This selection directly impacts the calculations by specifying the slope that anchors the geometric relationships within the chosen Dimension mode (1-D, 2-D, or 3-D).
In 1-D mode, the selected Source defines the single side used for the projection. In 2-D and 3-D modes, the Source works in conjunction with other settings to refine projections by integrating the selected slope into the multi-dimensional framework.
One-dimensional Fibonacci projection using the ⌳AC Slope Source and Ascending projection. The projection continues on the AC slope line.
🎯 Projection controls the direction and alignment of Fibonacci levels. Neutral projections produce horizontal levels, similar to traditional Fibonacci tools. Ascending and Descending projections adjust the levels along the calculated slope to reflect market trends. These options allow the indicator’s outputs to align with different market behaviors.
An ascending projection along the ⌳BC slope aligns with resistance levels at 1.0, 0.618, and 0.236. The geometric relationship between points A, B, and C illustrates how the projection adapts to market structure, identifying resistance zones that may not be captured by traditional Fibonacci tools.
🧭 Orientation modifies the alignment of the setup area defined by points A, B, and C, which influences Fibonacci projections in 2-D and 3-D modes. In Default mode, the triangle aligns naturally based on the relative positions of points B and C. In Inverted mode, the geometric orientation of the setup area is reversed, altering the slope calculations while preserving the projection direction specified in the Projection setting. In 1-D mode, Orientation has no effect since only one side is used for the projection.
Adjusting the Orientation setting provides alternative views of how Fibonacci levels align with the market's structure. By recalibrating the triangle’s setup, the inverted orientation can highlight different relationships between the sides, providing additional perspectives on support and resistance zones.
2-D inverted. The ⌳AC slope defines the projection, and the inverted orientation adjusts the alignment of the setup area, altering the angles used in level calculations. Key levels are highlighted: resistance at 0.786, strong support at 0.5 and 0.236, and a resistance-turned-support interaction at 0.618.
🛠️ CONFIGURATION AND SETTINGS 🛠️
The Fibonacci 3-D indicator includes configurable settings to adjust its functionality and visual representation. These options include customization of the dimensions (1-D, 2-D, or 3-D), slope calculations, orientations, projections, Fibonacci levels, and visual elements.
When adding the indicator to a new chart, select three reference points (A, B, and C). These are usually set to recent swing points. All three points can be easily changed at any time by clicking on the reference point and dragging it to a new location.
By default, all settings are set to Auto . The indicator uses an internal algorithm to estimate the projections based on the orientation and relative positions of the reference points. However, all values can be overridden to reflect the user's interpretation of the current market geometry.
⚙️ Core Settings
Dimensions : Defines how many sides of the triangle formed by points A, B, and C are incorporated into the calculations for Fibonacci projections. This setting determines the level of complexity and detail in the analysis. 1-D : Projects levels along the angle of a single user-selected side of the triangle.
2-D : Projects levels based on a composite slope derived from the angles of two sides of the triangle.
3-D : Projects levels based on a composite slope derived from all three sides of the triangle (A-B, A-C, and B-C), providing a multi-dimensional projection that adapts to both historical and recent market movements.
Slope Source : Determines which side of the triangle is used as the basis for slope calculations. A–B: The slope between points A and B. In 1-D mode, this determines the projection. In 2-D and 3-D modes, it contributes to the composite slope calculation.
A–C: The slope between points A and C. In 1-D mode, this determines the projection. In 2-D and 3-D modes, it contributes to the composite slope calculation.
B--C: The slope between points B and C. In 1-D mode, this determines the projection. In 2-D and 3-D modes, it contributes to the composite slope calculation.
Orientation : Defines the triangle's orientation formed by points A, B, and C, influencing slope calculations. Auto : Automatically determines orientation based on the relative positions of points B and C. If point C is to the right of point B, the orientation is "normal." If point C is to the left, the orientation is inverted.
Inverted : Reverses the orientation set in "Auto" mode. This flips the triangle, reversing slope calculations ⌳AB becomes ⌳BA).
Projection : Determines the direction of Fibonacci projections: Auto : Automatically determines projection direction based on the triangle formed by A, B, and C.
Ascending : Projects the levels upward.
Neutral : Projects the levels horizontally, similar to traditional Fibonacci retracements.
Descending : Projects the levels downward.
⚙️ Fibonacci Level Settings Show or hide specific levels.
Level Value : Adjust Fibonacci ratios for each level. The 0.0 and 1.0 levels are fixed.
Color : Set level colors.
⚙️ Visibility Settings Show Setup : Toggle the display of the setup area, which includes the projected lines used in calculations.
Show Triangle : Toggle the display of the triangle formed by points A, B, and C.
Triangle Color : Set triangle line colors.
Show Point Labels : Toggle the display of labels for points A, B, and C.
Show Left/Right Labels : Toggle price labels on the left and right sides of the chart.
Fill % : Adjust the fill intensity between Fibonacci levels (0% for no fill, 100% for full fill).
Info : Set the location or hide the Slope Source and Dimension. If Orientation is Inverted , the Slope Source will display with an asterisk (*).
⚙️ Time-Price Points : Set the time and price for points A, B, and C, which define the Fibonacci projections.
A, B, and C Points : User-defined time and price coordinates that form the foundation of the indicator's calculations.
Interactive Adjustments : Changes made to points on the chart automatically synchronize with the settings panel and update projections in real time.
Notes
Unlike traditional Fibonacci tools that include extensions beyond 1.0 (e.g., 1.618 or 2.618), the Fibonacci 3-D indicator restricts Fibonacci levels to the range between 0.0 and 1.0. This is because the projections are tied directly to the proportional relationships along the sides of the triangle formed by points A, B, and C, rather than extending beyond its defined structure.
The indicator's calculations dynamically sort the user-defined A, B, and C points by time, ensuring point A is always the earliest, point C the latest, and point B the middle. This automatic sorting allows users to freely adjust the points directly on the chart without concern for their sequence, maintaining consistency in the triangular structure.
🖼️ ADDITIONAL CHART EXAMPLES 🖼️
Three-dimensional ⌳AC slope is used with an ascending projection, even as the broader market trend moves downward. Despite the apparent contradiction, the projected Fibonacci levels align closely with price action, identifying zones of support and resistance. These levels highlight smaller countertrend movements, such as pullbacks to 0.382 and 0.236, followed by continuations at resistance levels like 0.618 and 0.786.
In 2-D mode, an ascending projection based on the BC slope highlights the market's geometric structure. A setup triangle, defined by a swing high (A), a swing low (B), and another swing high (C), reveals Fibonacci projections aligning with support at 0.236, 0.382, and 0.5, and resistance at 0.618, 0.786, and 1.0, as shown by the green and red arrows. This demonstrates the ability to uncover dynamic support and resistance levels not calculated in traditional Fibonacci tools.
In 2-D mode with an ascending projection from the ⌳AB slope, price movement is contained within the 0.5 and 0.786 levels. The 0.5 level serves as support, while the 0.786 level acts as resistance, with price action consistently interacting with these boundaries.
An AC (2-D) ascending projection is derived from two swing highs (A and B) and a swing low (C), reflecting a non-linear market structure that deviates from traditional zigzag patterns. The ascending projection aligns closely with the market's upward trajectory, forming a channel between the 0.0 and 0.5 Fibonacci levels. Note how price action interacts with the projected levels, showing support at 0.236 and 0.382, with the 0.5 level acting as a mid-channel equilibrium.
Two-dimensional ascending Fibonacci projection using the ⌳AC slope. Arrows highlight resistance at 0.786 and support at 0.0 and 0.236. The projection follows the ⌳AC slope, reflecting the geometric relationship between points A, B, and C to identify these levels.
Three-dimensional Fibonacci projection using the ⌳AC slope, aligned with the actual market's directional trend. By removing additional Fibonacci levels, the image emphasizes key areas: resistance at Level 0.0 and support at Levels 1.0 and 0.5. The projection dynamically follows the ⌳AC slope, adapting to the market's structure as defined by points A, B, and C.
A three-dimensional configuration uses the ⌳AB slope as the baseline for projections while incorporating the geometric influence of point C. Only the 0.0 and 0.618 levels are enabled, emphasizing the relationship between support at 0.0 and resistance at 0.618. Unlike traditional Fibonacci tools, which operate in a single plane, this setup reveals levels that rely on the triangular relationship between points A, B, and C. The third dimension allows for projections that align more closely with the market’s structure and reflect its multi-dimensional geometry.
The Fibonacci 3-D indicator can adapt to non-traditional point selection. Point A serves as a swing low, while points B and C are swing highs, forming an unconventional configuration. ⌳The BC slope is used in 2-D mode with an inverted orientation, flipping the projection direction and revealing resistance at Level 0.786 and support at Levels 0.618 and 0.5.
⚠️ DISCLAIMER ⚠️
The Fibonacci 3-D indicator is a visual analysis tool designed to illustrate Fibonacci relationships. While the indicator employs precise mathematical and geometric formulas, no guarantee is made that its calculations will align with other Fibonacci tools or proprietary methods. Like all technical and visual indicators, the Fibonacci projections generated by this tool may appear to visually align with key price zones in hindsight. However, these projections are not intended as standalone signals for trading decisions. This indicator is intended for educational and analytical purposes, complementing other tools and methods of market analysis.
🧠 BEYOND THE CODE 🧠
The Fibonacci 3-D indicator, like other xxattaxx indicators , is designed to encourage both education and community engagement. Your feedback and insights are invaluable to refining and enhancing the Fibonacci 3-D indicator. We look forward to the creative applications, adaptations, and observations this tool inspires within the trading community.
