SPY 200SMA +4% Entry -3% Exit TQQQ/QLD/GLDM THREE PHASE STRATEGYWanted to take a look at all of the individual trades and provide a series of options to balance performance and risk. This post is expanding on my previous one - www.reddit.com
Here is the data and the backtesting splitting the strategy into three primary phases with multiple options and exact trade dates to help people easily backtest other combinations - docs.google.com (Three Tabs with the three phases)
If you just want my personal recommendations this would be what I will be using -
PHASE 1 (Strategy BUY signal triggers when SPY price crosses +4% over the SPY 200SMA) = 100% TQQQ
If trade lasts 366 days (Long Term Cap Gains) go to PHASE 2
If SPY price crosses below -3% SPY 200SMA go to PHASE 3
PHASE 2 (PHASE 1 lasts 366 days) = Deleverage and diversify into 50% QLD & 50% GLDM
PHASE 3 (Strategy SELL signal triggers when SPY price crosses -3% below the SPY 200SMA) = Defensive posture with 50% SGOV & 50% GLDM
As market degrades start selling SGOV and buying QQQ until 50% QQQ & 50% GLDM
TradingView Script for the THREE PHASE STRATEGY (imgur.com):
//
@version=
5
strategy("SPY 200SMA +4% Entry -3% Exit Strategy",
overlay=true,
default_qty_type=strategy.percent_of_equity,
default_qty_value=100)
// === Inputs ===
smaLength = input.int(200, title="SMA Period", minval=1)
entryThreshold = input.float(0.04, title="Entry Threshold (%)", step=0.01)
exitThreshold = input.float(0.03, title="Exit Threshold (%)", step=0.01)
startYear = input.int(1995, "Start Year")
startMonth = input.int(1, "Start Month")
startDay = input.int(1, "Start Day")
// === Time filter ===
startTime = timestamp(startYear, startMonth, startDay, 0, 0)
isAfterStart = time >= startTime
// === Calculations ===
sma200 = ta.sma(close, smaLength)
upperThreshold = sma200 * (1 + entryThreshold)
lowerThreshold = sma200 * (1 - exitThreshold)
// === Strategy Logic ===
enterLong = close > upperThreshold
exitLong = close < lowerThreshold
if isAfterStart
if enterLong and strategy.position_size == 0
strategy.entry("Buy", strategy.long)
if exitLong and strategy.position_size > 0
strategy.close("Buy")
// === 366-Day Marker Logic (Uninterrupted) ===
var
int
targetTime = na
// 1. Capture entry time only when a brand new position starts
if strategy.position_size > 0 and strategy.position_size == 0
targetTime := time + (366 * 24 * 60 * 60 * 1000)
// 2. IMPORTANT: If position is closed or a sell signal hits, reset the timer to "na"
if strategy.position_size == 0
targetTime := na
// 3. Trigger only if we are still in the trade and hit the timestamp
isAnniversary = not na(targetTime) and time >= targetTime and time < targetTime
// === Visuals ===
p_sma = plot(sma200, title="200 SMA", color=color.rgb(255, 0, 242))
p_upper = plot(upperThreshold, title="Entry Threshold (+4%)", color=color.rgb(0, 200, 0))
p_lower = plot(lowerThreshold, title="Exit Threshold (-3%)", color=color.rgb(255, 0, 0))
fill(p_sma, p_upper, color=color.new(color.green, 80), title="Entry Zone")
// Draw marker only if 366 days passed without a sell
if isAnniversary
label.new(bar_index, high, "366 DAYS - PHASE 2", style=label.style_label_down, color=color.yellow, textcolor=color.black, size=size.small)
// === Entry/Exit Labels ===
newOpen = strategy.position_size > 0 and strategy.position_size == 0
newClose = strategy.position_size == 0 and strategy.position_size > 0
if newOpen
label.new(x=bar_index, y=low * 0.97, text="BUY - PHASE 1", xloc=xloc.bar_index, yloc=yloc.price, color=color.lime, style=label.style_label_up, textcolor=color.black, size=size.small)
if newClose
label.new(x=bar_index, y=high * 1.03, text="SELL - PHASE 3", xloc=xloc.bar_index, yloc=yloc.price, color=color.red, style=label.style_label_down, textcolor=color.white, size=size.small)
200 SMA SPY Trading Range Bands Script:
//
@version=
5
indicator("200 SMA SPY Trading Range Bands", overlay=true)
// === Settings ===
smaLength = input.int(200, title="SMA Length")
mult1 = input.float(1.09, title="Multiplier 1 (9% Over)")
mult2 = input.float(1.15, title="Multiplier 2 (15% Over)")
// === Calculations ===
smaValue = ta.sma(close, smaLength)
line9Over = smaValue * mult1
line15Over = smaValue * mult2
// === Plotting ===
plot(smaValue, title="200 SMA", color=color.gray, linewidth=1, style=plot.style_linebr)
plot(line9Over, title="9% Over 200 SMA", color=color.rgb(255, 145, 0), linewidth=1)
plot(line15Over, title="15% Over 200 SMA", color=color.rgb(38, 1, 1), linewidth=2)
TQQQ

Bull/Bear vs Base vs Index (% Change Spread)Visualizes the performance gap ("Beta Decay") between 3x Leveraged ETFs (SOXL/SOXS) and their underlying sector (SOXX), relative to the S&P 500 (SPY).
This indicator is designed for traders who trade leveraged products (like SOXL/SOXS, TQQQ/SQQQ) and need to see true relative strength beyond simple price action.
It calculates the percentage change over a user-defined lookback period for four instruments:
Base (1x): The sector benchmark (Default: SOXX).
Bull (3x): The leveraged long ETF (Default: SOXL).
Bear (-3x): The leveraged inverse ETF (Default: SOXS).
Index: The broad market zero-line (Default: SPY).
It then plots the Spread to reveal the health of the trend:
Bull Spread (Green Line): Bull % - Base %
Bear Spread (Red Line): Bear % - Base %
Base vs Index (Filled Area): Base % - SPY %
🧠 The Logic: Why Use Spreads?
In a perfectly efficient trending market, a 3x Bull ETF should move exactly 300% of the underlying asset. However, in choppy or volatile markets, volatility decay (beta slippage) causes leveraged ETFs to underperform mathematically.
Positive Spread: The leveraged ETF is successfully capturing momentum (The "Sweet Spot").
Negative Spread: The leveraged ETF is suffering from drag or the underlying asset is chopping.
📈 Recommended Trading Plan
Note: This indicator works best as a filter for entry conditions, not a standalone signal. Always use proper risk management.
Strategy A: The "Clean Trend" (Momentum)
Goal: Enter a 3x position only when volatility drag is minimal.
1. Bull Signal:
Condition 1: The Base vs Index (Area) is Green (Sector is outperforming SPY).
Condition 2: The Bull Spread (Green Line) is Positive (> 0).
Why: This confirms the sector is strong AND the 3x ETF is amplifying that move efficiently without decay eating the profits.
2. Bear Signal:
Condition 1: The Base vs Index (Area) is Red (Sector is lagging SPY).
Condition 2: The Bear Spread (Red Line) is Positive (> 0).
Why: This confirms the sector is crashing and the Bear ETF is successfully capturing the downside momentum.
Strategy B: The "Decay Avoidance" (Cash is King)
Goal: Avoid leveraged funds during chop.
Condition: If BOTH the Bull Spread and Bear Spread are Negative (< 0) (below the zero line).
Action: Stay in Cash or trade the 1x underlying (SOXX) only.
Why: When both spreads are negative, it mathematically proves that the market is too choppy for leverage. Both the Long and Short leveraged funds are losing value relative to the underlying asset.
Features:
Pine Script® v6: Updated for the latest engine performance and visuals.
Dashboard Table: Real-time percentage spreads displayed directly on the chart (customizable position).
Fully Customizable: Works on any sector (e.g., set inputs to QQQ/TQQQ/SQQQ for Tech).
Disclaimer:
Trading leveraged ETFs involves significant risk. This script is for educational purposes only.

SPY200SMA (+4%/-3%) TQQQ/QQQ STRATEGYSummary of the Improved Strategy: When the price of AMEX:SPY is +4% above the 200SMA BUY NASDAQ:TQQQ and when the price of SPY drops to -3% under the SPY 200SMA SELL everything and slowly DCA into NASDAQ:QQQ over the next 6-12 months or until price returns to +4% above the SPY 200SMA at which point you will go back into 100% TQQQ.
Note: (if the price of QQQ goes 30% above the 200SMA of QQQ deleverage to QQQ or Sell to protect yourself from dot com level event)
More info and stats -https://www.reddit.com/r/LETFs/comments/1nhye66/spy_200sma_43_tqqqqqq_long_term_investment/

200 SMA (5%/-3% Buffer) for SPY & QQQ In my testing TQQQ is an absolute monster of an ETF that performs extremely well even from a buy and hold standpoint over long periods of time, its largest drawback is the massive drawdown exposure that it faces which can be easily sidestepped with this strategy.
This strategy is meant to basically abuse TQQQ's insane outperformance while augmenting the typical 200SMA strategy in a way that uses all of its strengths while avoiding getting whipsawed in sideways markets.
The strategy BUYS when price crosses 5% over the 200SMA and then SELLS when price drops 3% below the 200SMA. Between trades I'll be parking my entire account in SGOV.
So maximizing profit while minimizing risk.
You use the strategy based off of QQQ and then make the trades on TQQQ when it tells you to BUY/SELL.
Here are some reasons why I will be using this strategy:
Simple emotionless BUY and SELL signals where I don't care who the president is, what is happening in the world, who is bombing who, who the leadership team is, no attachment to individual companies and diversified across the NASDAQ.
~85% win percentage and when it does lose the loses are nothing compared to the wins and after a loss you're basically set up for a massive win in the next trade.
Max drawdown of around 53% when using TQQQ
You benefit massively when the market is doing well and when there is a recession you basically sit in SGOV for a year and then are set up for a monster recovery with a clear easy BUY signal. So as long as you're patient you win regardless of what happens.
The trades are often very long term resulting in you taking advantage of Long Term Capital Gains tax advantage which could mean saving up to 15-20% in taxes.
With only a few trades you can spend time doing other stuff and don't have to track or pay attention to anything that is happening.
Simple, easy, and massively profitable.

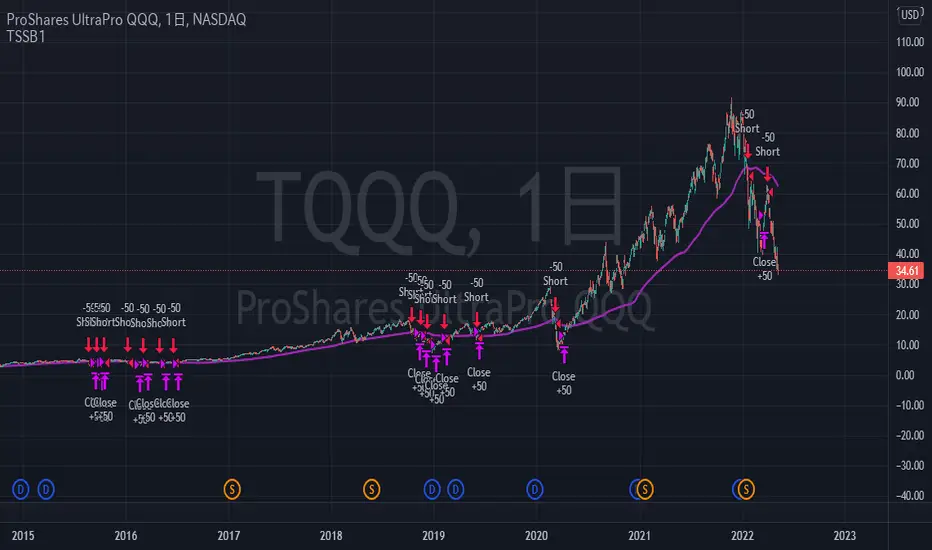
TriautoETF(TQQQ) Short Strategy B1○ Objective.
This is a strategy for the TQQQ NASDAQ:TQQQ short strategy in the TriAuto ETF .
It is used as a hedging short rather than for profit-making purposes.
Entry and close points are indicated.
○ Strategy
The strategy is to hold a short position when the price falls below the moving average line, which is a market-conscious line that is rarely broken.
The close (settlement) is determined by using the moving average.
The moving average is based on the market-conscious QQQ NASDAQ:QQQ .
This script is used on the daily chart of the TQQQ.
It works as a hedge for long positions because open interest is held even at the major bottoms of the China and Corona shocks.
The system is set up to quickly cut its losses even if the moving average is "tricked" into falling below the moving average.