ATR Trailing + Alerts + Price LabelsATR Trend is a clean and intelligent trend-following overlay built for traders who want clarity during both trending and ranging markets.
This indicator dynamically detects bullish and bearish market trends using the Average True Range (ATR), applying a confirmation-based approach to filter out false signals and minor pullbacks.
The trend line is:
Blue 🔵 during uptrends.
Black ⚫ during downtrends.
Continuous, recalculating only when the market truly shifts — not just when price temporarily crosses the line.
When a confirmed trend reversal occurs:
A 🔼 or 🔽 label shows the exact price of the flip.
An alert can be triggered to notify the user immediately.
💡 Features:
✅ Single-line trend direction
✅ Filters out short-term noise
✅ Exact price labeling on trend change
✅ Built-in alerts for up/down trend shifts
⚙️ Inputs:
ATR Period – Length of ATR calculation (default: 14)
ATR Multiplier – Offset for trend line placement (default: 2.0)
Flip Sensitivity – Number of bars required to confirm a trend reversal (default: 3)
This tool is suitable for:
Swing traders avoid false breakouts
Scalpers looking for high-probability trend entries
Algorithmic setups requiring structured trend logic
Trailing

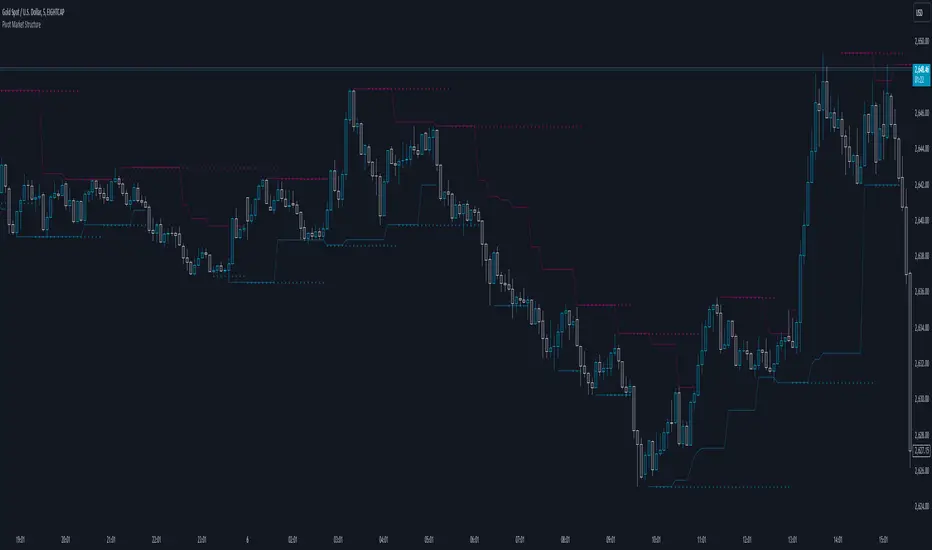
Pivot Market StructureDescription and Features
This script is designed to enhance technical analysis by identifying key market structure levels. It uses a price action trail (based on the last highest/lowest price) and pivot points to track market trends, offering insights into potential reversal zones or trend continuation signals.
How the Script Works
High/Low Trail Logic: The script includes a trail mechanism that compares the current price with the last highest and lowest price, determining whether the price has breached these levels. This helps pinpoint key price action events and potential trend shifts. Unlike pivot points the price action trail is more responsive changes within the market structure.
Step Size and Length for High/Low Trail:
- The Step Length parameter defines how many bars are used to compare the current price against the last highest/lowest price, providing a measure of price extremes.
- The Length parameter determines the number of bars considered for calculating the highest/lowest price since the last price action event (either price surpassing a previous high or dipping below a previous low).
Pivot Point Calculation: Pivot Point Highs are calculated by the number of bars with lower highs on either side of a Pivot Point High calculation. Similarly, Pivot Point Lows are calculated by the number of bars with higher lows on either side of a Pivot Point Low calculation. The script draws a line from/to every calculated pivot point to highlight market structure extremes. It can optionally extend these pivot lines to the left for added context, providing historical reference for decision-making.
Summary
By combining both pivot analysis and price action trailing techniques, the script provides a comprehensive view of a pivot point based market structure.
Trailing Stop Loss Smart [TradingFinder] Market Trend + CVD/EMA🔵 Introduction
Trailing Stop Loss (TSL) is one of the most powerful tools available. A Trailing Stop Loss is a modification of a typical stop order that adjusts dynamically based on market price movement. It can be set at a defined percentage or dollar amount away from the security's current market price, making it a flexible tool for locking in profits while minimizing risk. Unlike standard stop-loss orders, a Trailing Stop follows the market in the direction of the trade, protecting gains without requiring constant manual adjustments.
The Trailing Stop Loss Smart (TFlab Trailing Stop) indicator takes this concept even further by incorporating advanced metrics like Cumulative Volume Delta (CVD), volume dynamics, and Average True Range (ATR). This combination not only enhances risk management but also acts as a trend identifier, providing traders with a powerful tool to capitalize on both short-term and long-term price movements.
This indicator also supports various Order Types, allowing for flexible strategies that include a trailing stop/stop-loss combo to maximize winning trades while minimizing losses. The trailing stop limit is particularly useful for traders who want to set their stop at a precise level relative to the current market price, either by a percentage or a dollar amount. The Trailing Stop Loss Smart indicator can help ensure that traders do not exit too early during trends, while the stop-loss feature kicks in during reversals.
The advantages of using a Trailing Stop Loss are its ability to protect profits and reduce the emotional decision-making process in volatile markets. However, like all trading strategies, it has disadvantages, such as the risk of triggering too early during normal market fluctuations. By understanding how the Trailing Stop Loss Smart indicator integrates features like CVD, ATR, and volume analysis, traders can leverage its full potential while navigating these pros and cons.
With its unique ability to track market movements and trends using Cumulative Volume Delta, volume dynamics, and ATR-based trailing stops, this indicator offers a complete solution for traders looking to secure profits while minimizing downside risk. Whether you're employing a simple trailing stop or a trailing stop/stop-loss combo, this tool provides all the flexibility and precision needed to execute winning trades in various markets, including Forex, Crypto, and Stock.
🔵 How to Use
The Trailing Stop Loss Smart indicator integrates multiple advanced components to provide traders with superior risk management and trend identification.
Here’s how each part of the logic works :
🟣 Cumulative Volume Delta (CVD) Logic
The CVD tracks buying and selling pressure by calculating the difference between upward and downward price movements. When there’s more buying pressure, the CVD is positive, indicating a potential bullish trend. Conversely, more selling pressure results in a negative CVD, pointing to a bearish trend.
CVD Trend Detection : The indicator determines whether the market is in a bullish or bearish phase by comparing the CVD to its moving average. A bullish trend is confirmed when the CVD is above its moving average and the price is closing higher.
A bearish trend occurs when the CVD is below its moving average and the price is closing lower. This trend detection is critical for determining whether the trailing stop should be placed below the price (bullish) or above it (bearish).
🟣 Volume Dynamics
Volume is a key factor in identifying market strength. The Trailing Stop Loss Smart indicator pulls volume data based on the market selected (Forex, Crypto, or Stock) and adjusts the trailing stop based on whether the market is experiencing high volume or low volume.
High Volume : When the current volume exceeds the average volume, the market is in a high-volume state. During these conditions, the trailing stop is placed closer to the price, as high volume often indicates strong trends with less chance of reversals.
Low Volume : In low-volume conditions, the trailing stop gives the market more room to breathe by placing the stop further away from the price. This prevents premature stop-outs in periods of reduced market activity.
🟣 ATR-Based Trailing Stop
The Average True Range (ATR) is used to measure market volatility. The Trailing Stop Loss Smart uses the ATR to dynamically adjust the stop-loss distance.
Bullish Market : When a bullish trend is detected, the trailing stop is placed below the lowest price of the recent bars (determined by the Bar Back parameter), and adjusted by the ATR Multiplier. This allows for tighter protection during strong bullish trends.
Bearish Market : When the market is bearish, the trailing stop is placed above the highest price of recent bars, also adjusted by the ATR Multiplier. This ensures that short positions are safeguarded against sudden reversals.
🟣 Dynamic Stop-Loss Updates
The trailing stop is updated every few bars (according to the Refiner parameter), ensuring it remains relevant to the most recent price action and volume changes. This dynamic feature ensures the stop-loss adapts to both trending and volatile market conditions, without requiring manual intervention.
High Volume with Trends : In periods of high volume and a confirmed trend, the stop-loss is positioned tightly to lock in profits while minimizing the risk of reversal.
Low Volume with Trends : In low-volume conditions, the stop-loss is placed further from the price, allowing the market to move freely without triggering premature exits.
🟣 Visual Representation
The indicator visually represents the trailing stop on the chart, with green lines indicating bullish trends and red lines for bearish trends. This visual aid helps traders quickly assess the state of the market and the position of their trailing stop in real-time.
🔵 Settings
The Trailing Stop Loss Smart indicator offers several customizable settings to suit various trading strategies. Understanding these inputs is key to optimizing the tool for your specific trading style.
🟣 General Settings
Cumulative Mode : This controls how the CVD is calculated.
You can choose between :
EMA : Exponential Moving Average smoothing.
Periodic : Sums the delta over a fixed period.
CVD Period : Defines the look-back period for CVD calculation. A longer period smooths the data, making it less sensitive to short-term fluctuations.
Ultra Data : This Boolean input aggregates volume across multiple exchanges for a more comprehensive view of market activity.
Market Ultra Data : Select between Forex, Crypto, and Stock to ensure the indicator pulls accurate volume data for your market.
🟣 Logical Settings
Moving Average CVD Period : Defines the period for the moving average of the CVD. A longer period smooths the trend, reducing noise.
Moving Average Volume Period : Sets the period for the moving average used to distinguish between high and low volume conditions.
Level Finder Bar Back : Determines how many bars to look back when identifying the highest or lowest price for trailing stop placement.
Levels update per candles : Sets how often (in bars) the trailing stop should be updated to remain in sync with market movements.
ATR On : Toggles the use of ATR to adjust the trailing stop based on volatility.
ATR Multiplie r: Defines how far the stop is placed from the price based on the ATR. A larger multiplier increases the stop distance, reducing the likelihood of getting stopped out during market fluctuations.
ATR Multiplier Adjusts the distance of the trailing stop based on the ATR. A higher multiplier places the stop further from the price, providing more breathing room in volatile markets.
🔵 Conclusion
The Trailing Stop Loss Smart indicator is a comprehensive tool for traders looking to manage risk while identifying market trends. By incorporating Cumulative Volume Delta (CVD) to detect buying and selling pressure, volume dynamics to gauge market activity, and ATR to adjust for volatility, this indicator ensures that stop-loss levels are both adaptive and protective.
Whether you’re trading in Forex, Crypto, or Stock markets, the Trailing Stop Loss Smart allows you to capitalize on trends while dynamically adjusting to changing market conditions. Its ability to distinguish between high-volume and low-volume periods ensures that you’re not stopped out prematurely during periods of consolidation or market hesitation.
By providing real-time visual feedback, dynamic adjustments, and trend identification, this indicator serves as a vital tool for traders aiming to maximize profits while minimizing risk. Its versatility and adaptability make it an essential part of any trader’s toolkit, helping you stay ahead in fast-moving markets while safeguarding your positions.

TS CalculatorWhat is Trailing Stop?
A trailing stop is a type of stop-loss order that adjusts itself as the price of an asset moves in a favorable direction. It’s designed to lock in profits or limit losses by following the asset’s price movement. Here’s how it works:
How a Trailing Stop Works
Initial Setup: You set a trailing stop at a certain percentage or dollar amount below (for long trades) or above (for short trades) the current market price.
Price Movement: As the price moves in your favor, the trailing stop moves with it, maintaining the set distance.
Locking in Profits: If the price reverses direction by the set amount, the trailing stop triggers a market order to sell (for long trades) or buy (for short trades), locking in your profits or limiting your losses.
Example
Long Trade: If you buy a stock at $100 and set a trailing stop at 10%, the stop-loss order will initially be at $90. If the stock price rises to $120, the trailing stop moves up to $108 (10% below $120). If the price then drops to $108, the trailing stop triggers a sell order.
Short Trade: If you short a stock at $100 and set a trailing stop at 10%, the stop-loss order will initially be at $110. If the stock price falls to $80, the trailing stop moves down to $88 (10% above $80). If the price then rises to $88, the trailing stop triggers a buy order.
Benefits
Automated Risk Management: It helps manage risk without the need to constantly monitor the market.
Profit Protection: It locks in profits as the price moves in your favor.
Flexibility: It adjusts dynamically with the market price, unlike a fixed stop-loss order.
What this script does ?
This script plots the Trailing Stop from the point of entry to current date, until it hits the trailing stop. Some of the market did not give the trailing stop values exactly so this script may give you a wise view of that.
Variables
Date : Date with YYYY-MM-DD format
Time : Time with HH:MM:SS format
Entry Price : Activation Price of TS order
Bounceback Ratio : Ratio for TS
Order Type : Position of order as Long/Short
There is an also a table implemented which shows
Entry
Ratio
Position
Current Stop
For possible updates feel free to contact me via DM.

Trailing Stop ProTrailing Stop Pro is a sophisticated TradingView indicator designed to enhance your trading strategy by dynamically managing trailing stops based on market volatility. This tool leverages the Average True Range (ATR) to adjust stop levels, providing traders with a robust mechanism to protect profits and minimize losses.
Key Features:
Dynamic Trailing Stops: Automatically adjusts stop levels using ATR, allowing for responsive and adaptive risk management.
Customizable Inputs: Tailor the indicator to your trading style with adjustable parameters such as ATR Length, ATR Multiplier, and Source Vector.
Visual Clarity: Distinct color settings for long and short stops, with adjustable line thickness and transparency, ensuring clear visualization on your charts.
Professional Grade: The "Pro" designation signifies advanced features suitable for both novice and experienced traders seeking reliable and efficient stop management.
How It Works:
To set up the indicator, begin by defining the Chrono Point, which specifies the exact time you want the trailing stop mechanism to activate. This allows for precise control over when your stops begin to trail. Next, set the Credit Unit as the initial entry price for your trade, serving as the baseline from which the trailing stops will adjust.
The indicator uses ATR-based adjustments to determine stop levels. Customize the sensitivity of the trailing stop by adjusting the ATR Length (default is 14) and ATR Multiplier (default is 0.5). A longer ATR length smooths out volatility, while a higher multiplier increases the distance of the stop from the price.
Select your Source Vector from "High/Low," "Close," or "Open" prices as the basis for stop calculation. This flexibility allows you to align the indicator with your preferred trading strategy. The indicator plots trailing stops directly on the chart, with color-coded lines indicating long (teal) and short (red) positions. You can adjust the line thickness and transparency for optimal visibility.
The Mission Status feature automatically detects whether the trade is long or short and adjusts the trailing stop accordingly. If the price hits the trailing stop, the trade is considered exited, and the indicator calculates the profit or loss percentage.
Benefits:
Risk Management: Protect your trades from adverse market movements while locking in profits as prices move favorably.
Automation: Reduce manual intervention with automatic stop adjustments, allowing you to focus on strategic decision-making.
User-Friendly Interface: Intuitive settings and clear visual cues make it easy to integrate into your existing trading workflow.
Conclusion:
Trailing Stop Pro is an essential tool for traders looking to enhance their risk management strategies with precision and ease. By automating the trailing stop process and providing clear visual feedback, this indicator empowers you to navigate the markets with confidence. Whether you're a seasoned trader or just starting, Trailing Stop Pro offers the functionality and flexibility needed to optimize your trading performance.
The Trailing Stop Pro indicator is a tool designed to assist traders in managing risk and optimizing their trading strategies. However, it should not be considered as financial advice or a guarantee of profitability. Trading involves significant risk, and it is possible to lose more than your initial investment. Users are encouraged to thoroughly test the indicator in a demo environment and consider their own financial situation and risk tolerance before using it in live trading. Past performance is not indicative of future results, and users should seek advice from a qualified financial advisor if needed.

Custom ATR Trailing StopThis Script creates a custom ATR (Average True Range) trailing stop. It allows traders to set up automated stop-loss levels based on the ATR, which adjusts dynamically to market volatility. The script is designed to support both long and short trades, offering flexibility and precision in trade management.
When loading the indicator to your chart, simply click to set the trade begining time, confirm various settings and you are set.
Check tooltips for more details in the input settigns menu.
User Inputs
Trade Setup: Allows users to set the trade direction (Long or Short), the signal source for entries, and the specific bar time for the trade setup.
ATR Settings: Configurable ATR lookback period, ATR smoothing period, initial ATR multiplier for setting the stop-loss, breakeven ATR multiplier, and a manual breakeven level.
ATR Calculations
Computes the ATR and its moving average.
Determines initial and breakeven stop levels based on the ATR.
Signal Validation
Validates long or short trade signals based on the specified bar time and trade direction.
Triggers alerts when a valid trade signal is detected.
Trailing Stop Logic
For long trades, adjusts the stop-loss level dynamically based on the ATR.
For short trades, performs similar adjustments in the opposite direction.
Updates the trailing stop level to ensure it follows the price, moving closer as the price moves favorably.
Resets the trade state when the stop-loss is hit, triggering an alert.
Plotting
Plots the trailing stop levels on the chart.
Uses green for stop levels indicating profit and red for stop levels indicating a loss.

SLOPED Trailing SL with ATR-V1SLOPED Trailing SL with ATR
I thought capital is sometime locked for long periods s when volatility is low, hence:
SLOPED Trailing SL with ATR
This indicator provides a trailing stop loss that dynamically adjusts based on the Average True Range (ATR) and incorporates a user-defined upward slope on flat areas. It is designed to follow the price movement more closely during trends while allowing for a customizable slope to maintain a trailing stop even when the price movement is flat.
Key Features:
ATR-Based Stop Loss:
Utilizes the ATR to calculate a dynamic stop loss level, adjusting to market volatility.
Provides a normal ATR stop loss line that only trails upwards, preventing it from decreasing.
Upward Slope on Flat Areas:
Adds a user-defined upward slope to the trailing stop loss when the price movement is flat.
The slope value is specified in 1/1000 increments (e.g., 0.1% per bar), allowing for fine-tuned control.

HilalimSBHilalimSB A Wedding Gift 🌙
HilalimSB - Revealing the Secrets of the Trend
HilalimSB is a powerful indicator designed to help investors analyze market trends and optimize trading strategies. Designed to uncover the secrets at the heart of the trend, HilalimSB stands out with its unique features and impressive algorithm.
Hilalim Algorithm and Fixed ATR Value:
HilalimSB is equipped with a special algorithm called "Hilalim" to detect market trends. This algorithm can delve into the depths of price movements to determine the direction of the trend and provide users with the ability to predict future price movements. Additionally, HilalimSB uses its own fixed Average True Range (ATR) value. ATR is an indicator that measures price movement volatility and is often used to determine the strength of a trend. The fixed ATR value of HilalimSB has been tested over long periods and its reliability has been proven. This allows users to interpret the signals provided by the indicator more reliably.
ATR Calculation Steps
1.True Range Calculation:
+ The True Range (TR) is the greatest of the following three values:
1. Current high minus current low
2. Current high minus previous close (absolute value)
3. Current low minus previous close (absolute value)
2.Average True Range (ATR) Calculation:
-The initial ATR value is calculated as the average of the TR values over a specified period
(typically 14 periods).
-For subsequent periods, the ATR is calculated using the following formula:
ATRt=(ATRt−1×(n−1)+TRt)/n
Where:
+ ATRt is the ATR for the current period,
+ ATRt−1 is the ATR for the previous period,
+ TRt is the True Range for the current period,
+ n is the number of periods.
Pine Script to Calculate ATR with User-Defined Length and Multiplier
Here is the Pine Script code for calculating the ATR with user-defined X length and Y multiplier:
//@version=5
indicator("Custom ATR", overlay=false)
// User-defined inputs
X = input.int(14, minval=1, title="ATR Period (X)")
Y = input.float(1.0, title="ATR Multiplier (Y)")
// True Range calculation
TR1 = high - low
TR2 = math.abs(high - close )
TR3 = math.abs(low - close )
TR = math.max(TR1, math.max(TR2, TR3))
// ATR calculation
ATR = ta.rma(TR, X)
// Apply multiplier
customATR = ATR * Y
// Plot the ATR value
plot(customATR, title="Custom ATR", color=color.blue, linewidth=2)
This code can be added as a new Pine Script indicator in TradingView, allowing users to calculate and display the ATR on the chart according to their specified parameters.
HilalimSB's Distinction from Other ATR Indicators
HilalimSB emerges with its unique Average True Range (ATR) value, presenting itself to users. Equipped with a proprietary ATR algorithm, this indicator is released in a non-editable form for users. After meticulous testing across various instruments with predetermined period and multiplier values, it is made available for use.
ATR is acknowledged as a critical calculation tool in the financial sector. The ATR calculation process of HilalimSB is conducted as a result of various research efforts and concrete data-based computations. Therefore, the HilalimSB indicator is published with its proprietary ATR values, unavailable for modification.
The ATR period and multiplier values provided by HilalimSB constitute the fundamental logic of a trading strategy. This unique feature aids investors in making informed decisions.
Visual Aesthetics and Clear Charts:
HilalimSB provides a user-friendly interface with clear and impressive graphics. Trend changes are highlighted with vibrant colors and are visually easy to understand. You can choose colors based on eye comfort, allowing you to personalize your trading screen for a more enjoyable experience. While offering a flexible approach tailored to users' needs, HilalimSB also promises an aesthetic and professional experience.
Strong Signals and Buy/Sell Indicators:
After completing test operations, HilalimSB produces data at various time intervals. However, we would like to emphasize to users that based on our studies, it provides the best signals in 1-hour chart data. HilalimSB produces strong signals to identify trend reversals. Buy or sell points are clearly indicated, allowing users to develop and implement trading strategies based on these signals.
For example, let's imagine you wanted to open a position on BTC on 2023.11.02. You are aware that you need to calculate which of the buying or selling transactions would be more profitable. You need support from various indicators to open a position. Based on the analysis and calculations it has made from the data it contains, HilalimSB would have detected that the graph is more suitable for a selling position, and by producing a sell signal at the most ideal selling point at 08:00 on 2023.11.02 (UTC+3 Istanbul), it would have informed you of the direction the graph would follow, allowing you to benefit positively from a 2.56% decline.
Technology and Innovation:
HilalimSB aims to enhance the trading experience using the latest technology. With its innovative approach, it enables users to discover market opportunities and support their decisions. Thus, investors can make more informed and successful trades. Real-Time Data Analysis: HilalimSB analyzes market data in real-time and identifies updated trends instantly. This allows users to make more informed trading decisions by staying informed of the latest market developments. Continuous Update and Improvement: HilalimSB is constantly updated and improved. New features are added and existing ones are enhanced based on user feedback and market changes. Thus, HilalimSB always aims to provide the latest technology and the best user experience.
Social Order and Intrinsic Motivation:
Negative trends such as widespread illegal gambling and uncontrolled risk-taking can have adverse financial effects on society. The primary goal of HilalimSB is to counteract these negative trends by guiding and encouraging users with data-driven analysis and calculable investment systems. This allows investors to trade more consciously and safely.

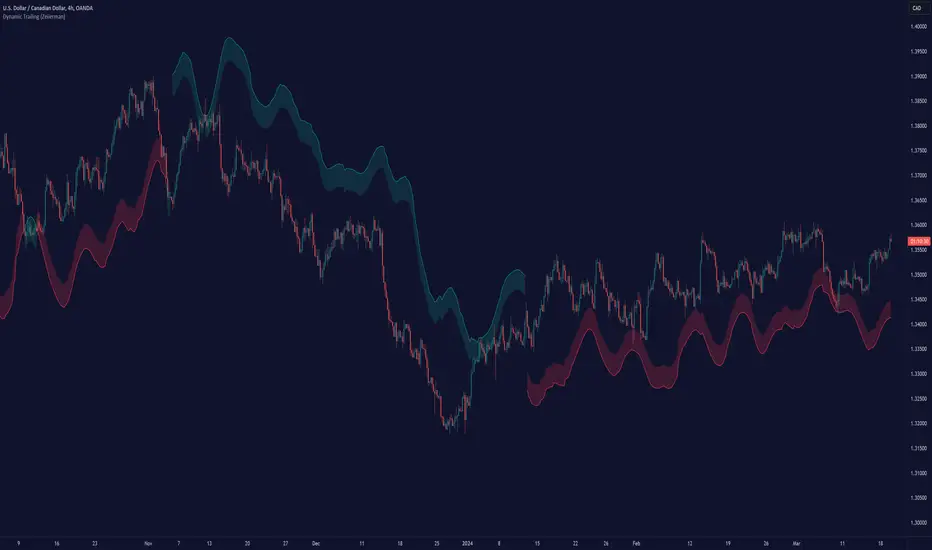
Dynamic Trailing (Zeiierman)█ Overview
The Dynamic Trailing (Zeiierman) indicator enhances the traditional SuperTrend approach by providing a more nuanced, adaptable tool for trend analysis and market volatility assessment. It combines techniques to identify dynamic support and resistance levels, trend directions, and market volatility. By integrating the Average True Range (ATR) with a unique multiplier system and smoothing mechanisms, this indicator offers a nuanced approach to trend-following strategies, making it a valuable asset for traders looking to leverage SuperTrend methodologies with additional insights into market dynamics.
█ How It Works
At its core, this indicator builds on the traditional SuperTrend formula by utilizing a modified ATR calculation to define the deviation for dynamic support and resistance levels. These levels are dynamically adjusted based on market volatility. The innovation lies in the addition of the Hull Moving Average (HMA) and the Triple Exponential Moving Average (TEMA) for an enhanced smoothing effect, making the indicator's trend signals more reliable and less prone to market noise. The trend direction is determined by comparing the closing price with the dynamic levels, facilitating clear bullish or bearish signals.
The indicator incorporates a 'Supertrend' function, which uses the dynamic levels and the price’s position relative to them to determine the trend direction. This determination is visualized through color-coded lines and a cloud zone, which expands or contracts based on the ATR and a user-defined width setting, illustrating the market's volatility and trend strength.
ATR Calculation: Utilizes the Average True Range (ATR) to measure market volatility. The ATR is a cornerstone of this indicator, helping to dynamically adjust the support and resistance levels according to the market’s changing conditions.
Supertrend Calculation: Implements a supertrend formula that combines the ATR with user-defined multipliers to plot potential trend directions. This feature helps in identifying whether the market is in an uptrend or downtrend, offering visual cues for potential reversals.
TEMA Calculation: Employs the Triple Exponential Moving Average (TEMA) through a Hull Moving Average (HMA) calculation to smooth out price data. This smoothing process helps in reducing market noise and makes the trend direction clearer.
Dynamic Support and Resistance: Calculates dynamic support and resistance levels by applying a deviation (derived from the ATR and user-defined multiplier) to the smoothed price data. These levels adapt to market conditions, providing areas where price might experience support or resistance.
Trend and Cloud Calculation: Determines the overall trend direction and plots a 'Cloud' zone around it, which adjusts in width based on the ATR and a user-defined cloud width setting. This cloud acts as a visual buffer, indicating the strength and stability of the current trend.
█ How to Use
Trend Identification: The primary function of this indicator is to help traders quickly identify the prevailing market trend. A change in the color of the dynamic trailing line or its position relative to the price can signal potential trend reversals.
Dynamic Support and Resistance: Unlike static levels, the dynamic levels adjust with market conditions, providing current areas where the price might experience support or resistance.
Dynamic Support
Dynamic Resistance
█ Settings
Mult (Multiplier): Adjusts the multiplier for the ATR calculation, affecting the deviation distance for support and resistance levels. Higher values decrease sensitivity and vice versa.
Len (Length): Sets the period for the HMA in the TEMA calculation, influencing the indicator's responsiveness to price changes.
Smoothness: Determines the smoothness of the dynamic support and resistance lines by setting the SMA length. Higher values result in smoother lines.
Cloud Width : Modifies the width of the cloud, providing a visual representation of market volatility.
Color Settings (upcol and dncol): Allows users to customize the colors of the indicator's lines and cloud, aiding in visual trend identification.
-----------------
Disclaimer
The information contained in my Scripts/Indicators/Ideas/Algos/Systems does not constitute financial advice or a solicitation to buy or sell any securities of any type. I will not accept liability for any loss or damage, including without limitation any loss of profit, which may arise directly or indirectly from the use of or reliance on such information.
All investments involve risk, and the past performance of a security, industry, sector, market, financial product, trading strategy, backtest, or individual's trading does not guarantee future results or returns. Investors are fully responsible for any investment decisions they make. Such decisions should be based solely on an evaluation of their financial circumstances, investment objectives, risk tolerance, and liquidity needs.
My Scripts/Indicators/Ideas/Algos/Systems are only for educational purposes!
Trailing Candle CounterThis script is for users who like to monitor and/or analyze a specified number of candles within the time the last candle closed. Al Brooks fans may enjoy this indicator.
While searching for an indicator that already had this functionality I found a script by @Steversteves which counted the candles/percentage within a set period of time. This let me know it could be done. In honor of Steversteves I kept the table the same colors - although, I added code to allow the table to be modified.
When opening the script the user will need to set a begin/end time to analyze – don't worry as you can set anything you want and it can be altered after the script is running.
This image shows the settings for a user to be able to set a begin time and have the indicator count all the candles from that time through to the current time and update at each candle close. The user can move the beginning time as needed. This is useful if the user is monitoring the length of a trend, wedge, channel, etc.:
If the indicator is in view and the beginning time is on the chart the user can select the table to view/select/change the beginning time.
This image shows the settings for a user to monitor the last set of candles since the last candle closed. This is useful if the user expects a pullback after a set number of candles or expects some alteration in a trend within a set number of candles. In this case the user setting is to watch five candles:
This setting is the reason for my creation of this indicator. This image shows the settings for a user to monitor two sets of candles. In this case an additional set of five candles has been added to the original set of five candles:
If one is watching for movements to last a certain number of bars when the first bar of the movement is exiting the background color the user can expect a change in the price momentum.
This image shows the same functionality as in Steversteves original script (although, I used almost none of his original code). The user can set a begin time and end time to analyze the number or red/green candles and the percentage of each within that time period.
If the indicator is in view and the beginning and end times are on the chart the user can select the table to view/select/change the times.
I hope you find this useful and if you have any questions/comments/suggestions for improvement please comment below.

Average True Range Trailing Mean [Alifer]Upgrade of the Average True Range default indicator by TradingView. It adds and plots a trailing mean to show periods of increased volatility more clearly.
ATR TRAILING MEAN
A trailing mean, also known as a moving average, is a statistical calculation used to smooth out data over time and identify trends or patterns in a time series.
In our indicator, it clearly shows when the ATR value spikes outside of it's average range, making it easier to identify periods of increased volatility.
Here's how the ATR Trailing Mean (atr_mean) is calculated:
atr_mean = ta.cum(atr) / (bar_index + 1) * atr_mult
The ta.cum() function calculates the cumulative sum of the ATR over all bars up to the current bar.
(bar_index + 1) represents the number of bars processed up to the current bar, including the current one.
By dividing the cumulative ATR ta.cum(atr) by (bar_index + 1) and then multiplying it by atr_mult (Multiplier), we obtain the ATR Trailing Mean value.
If atr_mult is set to 1.0, the ATR Trailing Mean will be equal to the simple average of the ATR values, and it will follow the ATR's general trend.
However, if atr_mult is increased, the ATR Trailing Mean will react more strongly to the ATR's recent changes, making it more sensitive to short-term fluctuations.
On the other hand, reducing atr_mult will make the ATR Trailing Mean less responsive to recent changes in ATR, making it smoother and less prone to reacting to short-term volatility.
In summary, adjusting the atr_mult input allows traders to fine-tune the ATR Trailing Mean's responsiveness based on their preferred level of sensitivity to recent changes in market volatility.
IMPLEMENTATION IN A STRATEGY
You can easily implement this indicator in an existing strategy, to only enter positions when the ATR is above the ATR Trailing Mean (with Multiplier-adjusted sensitivity). To do so, add the following lines of codes.
Under Inputs:
length = input.int(title="Length", defval=20, minval=1)
atr_mult = input.float(defval=1.0, step = 0.1, title = "Multiplier", tooltip = "Adjust the sensitivity of the ATR Trailing Mean line.")
smoothing = input.string(title="Smoothing", defval="RMA", options= )
ma_function(source, length) =>
switch smoothing
"RMA" => ta.rma(source, length)
"SMA" => ta.sma(source, length)
"EMA" => ta.ema(source, length)
=> ta.wma(source, length)
This will allow you to define the Length of the ATR (lookback length over which the ATR is calculated), the Multiplier to adjust the Trailing Mean's sensitivity and the type of Smoothing to be used for the ATR.
Under Calculations:
atr= ma_function(ta.tr(true), length)
atr_mean = ta.cum(atr) / (bar_index+1) * atr_mult
This will calculate the ATR based on Length and Smoothing, and the resulting ATR Trailing Mean.
Under Entry Conditions, add the following to your existing conditions:
and atr > atr_mean
This will make it so that entries are only triggered when the ATR is above the ATR Trailing Mean (adjusted by the Multiplier value you defined earlier).
ATR - DEFINITION AND HISTORY
The Average True Range (ATR) is a technical indicator used to measure market volatility, regardless of the direction of the price. It was developed by J. Welles Wilder and introduced in his book "New Concepts in Technical Trading Systems" in 1978. ATR provides valuable insights into the degree of price movement or volatility experienced by a financial asset, such as a stock, currency pair, commodity, or cryptocurrency, over a specific period.
ATR - CALCULATION AND USAGE
The ATR calculation involves three components:
1 — True Range (TR): The True Range is a measure of the asset's price movement for a given period. It takes into account the following factors:
The difference between the high and low prices of the current period.
The absolute value of the difference between the high price of the current period and the closing price of the previous period.
The absolute value of the difference between the low price of the current period and the closing price of the previous period.
Mathematically, the True Range (TR) for the current period is calculated as follows:
TR = max(high - low, abs(high - previous_close), abs(low - previous_close))
2 — ATR Calculation: The ATR is calculated as a Moving Average (MA) of the True Range over a specified period.
The ATR is calculated as follows:
ATR = MA(TR, length)
3 — ATR Interpretation: The ATR value represents the average volatility of the asset over the chosen period. Higher ATR values indicate higher volatility, while lower ATR values suggest lower volatility.
Traders and investors can use ATR in various ways:
Setting Stop Loss and Take Profit Levels: ATR can help determine appropriate stop-loss and take-profit levels in trading strategies. A larger ATR value might require wider stop-loss levels to allow for the asset's natural price fluctuations, while a smaller ATR value might allow for tighter stop-loss levels.
Identifying Market Volatility: A sharp increase in ATR might indicate heightened market uncertainty or the potential for significant price movements. Conversely, a decreasing ATR might suggest a period of low volatility and possible consolidation.
Comparing Volatility Between Assets: Since ATR uses absolute values, it shouldn't be used to compare volatility between different assets, as assets with higher prices will consistently have higher ATR values, while assets with lower prices will consistently have lower ATR values. However, the addition of a trailing mean makes such a comparison possible. An asset whose ATR is consistently close to its ATR Trailing Mean will have a lower volatility than an asset whose ATR continuously moves far above and below its ATR Trailing Mean. This can help traders and investors decide which markets to trade based on their risk tolerance and trading strategies.
Determining Position Size: ATR can be used to adjust position sizes, taking into account the asset's volatility. Smaller position sizes might be appropriate for more volatile assets to manage risk effectively.

Spinn: SuperStopAdaptive Trailing Stop-Loss Indicator
This indicator will be beneficial for traders who have already opened a position and are looking to maximize their profits but are uncertain about the optimal time to exit. It provides clear and adaptive stop-loss levels based on market data, especially in highly volatile markets. It offers the ability to close trades automatically (through the use of web-hooks).
The algorithm is based on using the Average True Range (ATR) to set stop-loss levels. The scaling factor allows you to adjust the optimal distance from the stop-loss line to the price line.
A unique feature of this indicator is that the user can set the target timeframe (Target TF). This means that instead of just using the current chart's timeframe, you can set a multiplier or choose the target timeframe manually. This offers the ability to analyze volatility across different timeframes, which can be valuable for various trading strategies.
The timeframe multiplier is a highlight of this indicator. When switching the current timeframe, there is no need to manually change the target timeframe - this is very convenient.
The ability for automatic alerts when the price touches or crosses stop-loss levels is included.
--
Индикатор адаптивных плавающих Стоп-лоссов
Индикатор будет полезен для трейдеров, которые уже открыли сделку и хотят максимизировать свою прибыль, но не уверены в оптимальном моменте для выхода. Он предоставляет четкие и адаптивные уровни стоп-лоссов, основанные на рыночных данных, особенно при высокой волатильности. Дает возможность закрывать сделки в автоматическом режиме (через использование веб-хуков).
Алгоритм основан на использовании среднего истинного диапазона (ATR) для определения уровней стоп-лоссов. Коэффициент масштабирования дает возможность настроить оптимальное расстояние от линии стоп-лосса до линии цены.
Особенность индикатора в том, что пользователь может настроить целевой таймфрейм (Target TF). Это значит, что вместо того чтобы просто использовать текущий таймфрейм графика, можно установить множитель или выбрать целевой таймфрейм вручную. Это дает возможность анализировать волатильность на разных временных рамках, что может быть полезно для различных торговых стратегий.
Множитель таймфрейма - это фишка данного индикатора. При переключении текущего таймфрейма не придется вручную менять целевой таймфрейм - это очень удобно.
Предусмотрена возможность автоматических оповещений при касании или пересечении уровней стоп-лоссов.

Limit Order + ATR Stop-Loss [TANHEF]This indicator enables interactive placement of limit or stop-limit orders with a trailing ATR stop-loss and optional profit target (with alerts). Refer to the images below for further clarification.
Why use a trailing stop-loss?
A trailing stop-loss serves as an exit strategy when price moves against you, while also allowing you to adjust the exit point further into profit when price moves favorably. The ATR (Average True Range), a reliable measure of volatility, acts as an effective risk management tool, functioning as a trailing stop-loss.
Indicator Explanation
Initial indicator placement: Select Long Limit or Long-Stop Limit order.
Change Entry Type: Switch between Long and Short within settings.
Modify entry price: Drag circle, adjust in settings, or re-add indicator to chart.
Optional Profit Target: Use Risk/Reward ratio or specify price.
Entry anticipation: Estimated ATR stop-loss and profit target as blue circles (fluctuates with volatility changes).
Entry triggered: Actual ATR stop-loss and profit target plotted.
Exit conditions: Stop-loss or profit target hit, exit entry.
Update Frequency: Continuously, Bar Open, or Bar Open on entry then continuously.
ATR Overlap: no entry occurs if the ATR overlaps with price (stop-loss 'hit' already on entry bar)
Table: Displays input settings selected.
Show Only On Ticker: Ability to hide indicator on other tickers.
Long Limit
Long Stop-Limit
Short Limit
Short Stop-Limit
Alerts
1. 'Check' alerts to use within indicator settings (entry, trailing stop hit, profit target hit, and failed entry).
2. Select 'Create Alert'
3. Set the condition to 'Limit Order + ATR Stop-Loss''
4. Select create.
Additional details can be added to the alert message using these words in between Curly (Brace) Brackets:
{{trail}} = ATR trailing stop-loss (price)
{{target}} = Price target (price)
{{type}} = Long or Short stop-loss (word)
{{traildistance}} = Trailing Distance (%)
{{targetdistance}} = Target Distance (%)
{{starttime}} = Start time of position (day:hr:min)
{{maxdrawdown}} = max loss
{{maxprofit}} = max profit
{{update}} = stoploss update frequency
{{entrysource}} = entry as 1st bar source (yes/no)
{{triggerentry}} = Wick/Close Trigger entry input
{{triggerexit}} = Wick/Close Trigger exit input
{{triggertarget}} = Wick/Close Trigger target input
{{atrlength}} = ATR length input
{{atrmultiplier}} = ATR multiplier input
{{atrtype}} = ATR type input
{{ticker}} = Ticker of chart (word)
{{exchange}} = Exchange of chart (word)
{{description}} = Description of ticker (words)
{{close}} = Bar close (price)
{{open}} = Bar open (price)
{{high}} = Bar high (price)
{{low}} = Bar low (price)
{{hl2}} = Bar HL2 (price)
{{volume}} = Bar volume (value)
{{time}} = Current time (day:hr:min)
{{interval}} = Chart timeframe
{{newline}} = New line for text

Donchian Channels [Gu5]█ OVERVIEW
I changed the design of the classic indicator "Donchian Channels", for easy reading.
█ CONCEPTS
Donchian Channels is an indicator made up of upper and lower bands around a mid-band or Basis.
The upper band marks the highest price of a security for N periods, while the lower band marks the lowest price of a security for N periods. The area between the upper and lower bands.
In this version, when there are new Higher High (HH), the trend is Bullish and the channel is painted green.
When there are new Lower Low (LL), the trend is Bearish and the channel is painted Red
█ OTHER SECTIONS
A plus in this script: When there are no new highs or new lows, there is no certain trend
The channel is painted yellow
www.tradingview.com
• HOW TO USE
Menu "Display"
• '■ Basis On/Off': Shows the midline Basis
• '■ Alert On/Off': Shows alerts labels
• '■ Fill On/Off': Paint the entire channel the color of the trend
• '■ Bar Color On/Off': Paint the candle the color of the trend
• '■ Close Alert On/Off': Shows alerts end of trend
• NOTES:
This code was written using the recommendations from the Pine Script™ User Manual's Style Guide
• RAMBLINGS:
You can use the "Basis" line as Trailing Stop.
• THANKS:
Donchian Channels developed by Richard Donchian
and many MANY thanks to @PineCoders

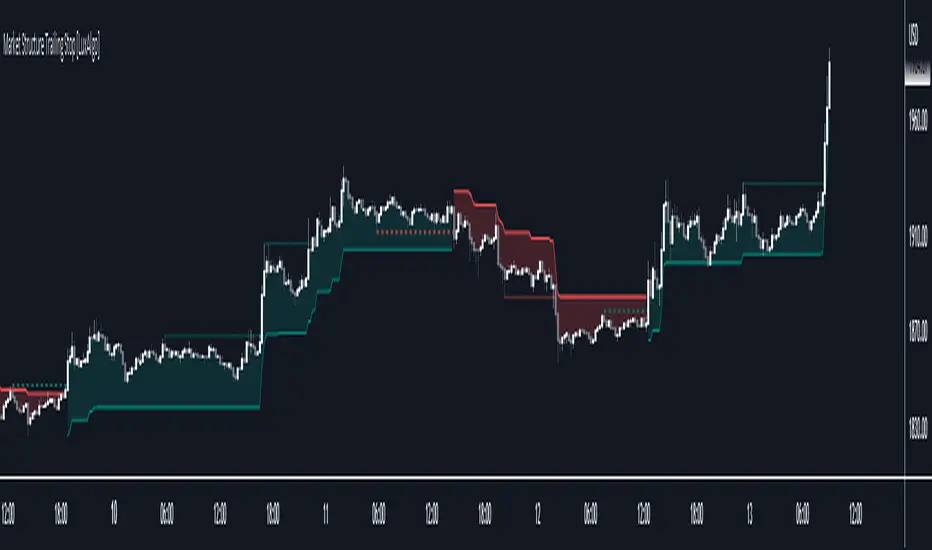
Market Structure Trailing Stop [LuxAlgo]This script returns trailing stops on the occurrence of market structure (CHoCH/BOS labeling). Trailing stops are adjusted based on trailing maximums/minimums with the option for users to be able to control how quickly a trailing stop can converge toward the price.
🔶 SETTINGS
Pivot Lookback: Pivot length used for the detection of swing points.
Increment Factor %: Controls how fast trailing stops converge toward the price, with lower values returning slower converging trailing stops.
Reset Stop On: Determines if trailing stops are reset on CHoCH structure or all (CHoCH + BOS).
Show Structure: Determines if market structure is displayed.
🔶 USAGE
Trailing stops allow traders to protect them against downside risk while also guaranteeing a potential profit in case the market goes in the expected direction of the trade.
Users making use of market structure as a primary entry condition can benefit from having trailing stops based on these to either provide an additional exit condition or to provide points of support/resistance with the price.
Trailing stops can avoid being hit more frequently by using a lower Increment Factor % setting.
Finally, users can reset the trailing stop when any market structure is detected (or only on CHoCHs). Allowing trailing stops to reset on the detection of any market structure allows the indicator to return trailing stops closer to the price. CHoCH labels are highlighted as dashed lines while BOS labels are highlighted as dotted lines.
🔶 DETAILS
When a new structure (or only CHoCH if specified by the user) is detected, trailing stops will initially be set based on the maximum/minimum made on the previous trend. This will also set the trailing maximum/minimum to the current price value.
If an uptrend is detected (most recent market structure is bullish) then the trailing stop will increase if the trailing maximum increase, the increment is calculated as:
trailing stop = trailing stop + Increment Factor % of (trailing maximum - previous trailing maximum)
If a downtrend is detected (most recent market structure is bearish) then the trailing stop will decrease if the trailing minimum decrease, the decrement is calculated as:
trailing stop = trailing stop + Increment Factor % of (trailing minimum - previous trailing minimum)
[TTI] ATR Trailing Stop Alerts––––HISTORY & CREDITS 🏦
The Trailing Stop Alert is a TradingView indicator developed by TintinTrading, which is designed to help traders manage their positions by updating and alerting them about their trailing stop levels. This tool is a valuable addition to a trader's arsenal, as it automates the process of maintaining trailing stop levels and alerts the user when they are updated or hit.
––––WHAT IT DOES 💡
The Trailing Stop Alert indicator calculates trailing stop levels based on the Average True Range (ATR) of an asset over a specified lookback period. It takes user inputs for trail type (Long or Short), lookback period, ATR length, ATR multiplier, and bar time. The indicator can be applied to any financial instrument and will dynamically update the trailing stop level based on price action. When the trailing stop level is updated or hit, the indicator generates alerts to inform the user of these events.
––––HOW TO USE IT 🔧
1. Add the Trailing Stop Alert indicator to your TradingView chart.
2. Configure the settings according to your preferred parameters:
👉Trail Type: Choose between "Long" or "Short" based on your trading position.
👉Lookback: Set the number of bars to look back for determining the highest high or lowest low.
👉ATR Length: Set the period for calculating the Average True Range.
👉ATR Multiplier: Set the multiplier to adjust the trailing stop distance.
👉Bar Time: Set the time at which the indicator starts updating the trailing stop levels.
3. The indicator will plot the trailing stop level on the chart, and update it as the price action unfolds.
4. When the trailing stop level is updated or hit, you will receive an alert in the form of a message with the new level or a notification that the stop has been hit.
5. Adjust your stop loss orders accordingly based on the trailing stop levels provided by the indicator.
By using the Trailing Stop Alert indicator, you can effectively manage your positions and reduce the risk of giving back profits in a trade.

Interactive SAR Stop-Loss [TANHEF]This indicator is "Interactive" which means some inputs can are manually added through the first click after adding the indicator to the chart (SAR Trailing Stop-loss start point).
Unlike the normal Parabolic SAR, this indicator allows for the modification of the start point of the Parabolic SAR’s first bar calculation. Normally, the Parabolic SAR automatically has a start point after the first bar of an asset’s historical price that will then switch between trailing above and below price respectively. It must be noted that due to how the first position of the Parabolic SAR is calculated, on occasion the Parabolic SAR will immediately flip on the next bar to the opposite side relative to price that it was just located. Modifying the setting “⭐Initial Interactive SAR Position Source”, then selecting either 'Clicked' or 'ATR' level as the vertical start position will prevent this. See images below for more explanation.
Why use a trailing stop-loss?
A trailing stop-loss provides an exit when price moves against you but also enables you to move the exit point further into profit when price is moving in the desired direction of a trade. The Parabolic SAR ( stop and reverse ) which is used to determine price direction as well as when price direction is changing, is very effective at functioning as a trailing stop loss.
Indicator Explanation
Initially when this indicator is added to the chart, you will be prompted to select where to begin the SAR Trailing Stop-loss.
For a long stop-loss, select below price.
For a short stop-loss, select above price.
After this indicator is placed, it can be modified via dragging or from within the settings by modifying the time and the price input. Or simply re-add the indicator to the chart. Another option is to have this Parabolic SAR begin directly on the price that was initially ‘Clicked’ or the ‘ATR’ level, which requires selecting the option in settings labeled “⭐Initial Interactive SAR Position Source”
The SAR Stop Loss plotted. Note that the calculation that occurs on this first bar of the ‘Interactive SAR’ is as if the prior bar was the oldest historical bar of the asset. Due to the SAR’s calculations, if the ‘Normal SAR’ were to also flip sides over to the position that has been manually set for the ‘Interactive SAR’, they won’t necessarily have the same result.
An optional fixed profit target can be added within the settings. This profit target will only actively be plotted when the SAR Trailing Stop-loss has not be hit yet or until the profit target has been hit.
Here shows that the profit target was hit, then later on the SAR Trailing Stop-loss was hit.
Note, trailing stop-loss will continue to be plotted until it has been hit regardless of the profit target being hit or not.
Here is an example of when the Parabolic SAR will immediately flip on the next bar to the opposite side relative to price that it was just first located. This is due to how the Parabolic SAR is calculated and will also occur with the traditional Parabolic SAR that is not interactively (manually) given a start location. To prevent this, either relocate this time in which this SAR beings or consider modifying the SAR’s (start, increment, max) settings specifically.
Here instead of using the SAR’s calculation for an initial bar, the ‘ATR’ was selected as the start point within the setting “⭐Initial Interactive SAR Position Source”.
Alerts
1. 'Check' alerts to use within indicator settings (trailing stop hit and/or profit target hit).
2. Select 'Create Alert'
3. Set the condition to 'Interactive SAR''
4. Select create.

Interactive ATR Stop-Loss [TANHEF]This indicator is "Interactive" which means some inputs can are manually added through the first click after adding the indicator to the chart (ATR Trailing Stop-loss start point). See images below for more explanation.
Why use a trailing stop-loss?
A trailing stop-loss provides an exit when price moves against you but also enables you to move the exit point further into profit when price is moving in the desired direction of a trade. The ATR (Average True Range) which is used to measure volatility, is very effective at functioning as a trailing stop loss.
Indicator Explanation
Initially when this indicator is added to the chart, you will be prompted to select where to begin the ATR Trailing Stop-loss.
For a long stop-loss, select below price.
For a short stop-loss, select above price.
After this indicator is placed, it can be modified via dragging or from within the settings by modifying the time and the price input. Or simply re-add the indicator to the chart.
The ATR Stop Loss plotted. Note that the trailing value that is considered as the stop loss value is the value of the ATR from the prior candle. The settings for the ATR calculation can be modified within the settings.
An optional fixed profit target can be added within the settings. This profit target will only actively be plotted when the ATR Trailing Stop-loss has not be hit hit yet or until the profit target has been hit.
Here shows that the profit target was hit, then later on the ATR Trailing Stop-loss was hit.
Note, trailing stop-loss will continue to be plotted until it has been hit regardless of the profit target being hit or not.
Alerts
1. 'Check' alerts to use within indicator settings (trailing stop hit and/or profit target hit).
2. Select 'Create Alert'
3. Set the condition to 'Interactive ATR''
4. Select create.

ATR alerts & backtestingThe Basics
Alert will trigger if the current (real time) price surpasses the high of the ATR of the previous bar. (can also be set for the Low of the ATR). Each time the follow up candle surpasses the high of the previous ATR, the background will be coloured orange. This makes back testing easier on the eye. This can be turned off.
- Colours can be changed.
- Can also set a color and alert when the current price surpasses the Low of the ATR of the previous bar.
- ATR distance can be changed.
- Can be used on different chart types.
- Can be used as entry or exits in combination with bots.
- Can display only ATR top or bottom or both.
Example
An alert will trigger if the price of the current bar surpasses the red dot (ATR) of the previous bar.
Alerts can be created on all timeframes, if this is within your Tradingview plan.
Final Words
Disclaimer: Please use it with care and at own risk. The owner of this indicator is not liable for any financial losses.
Past performance is no guarantee of future returns.

RSI Wave SignalsQuick Description: Smoothed RSI with optimized trailing moving average. Look for cross above or cross under signals for buy and sell orders respectively.
VIDYA moving average of RSI incorporated with "optimized trend tracker" system. Thanks to kivancozbilgic and anilozeksi for implementing this great idea on Tradingview. The indicator adds "1,000" to the RSI MA values for more natural and accurate percentage trailing.
Settings:
- Period MA is the moving average length of the blue line
- Trailing Percentage of MA adjusts the percentage (sort of) trailing level of the moving average.
- RSI Length adjusts the rsi length in calculation.
Trading Tips:
- System might be enhanced by taking signals only on "oversold" or "overbought" territories (i.e <~1020 or >~1080)
- Adjust position size of by 4 times of atr(length=14)
- Take 50% of position as profit when position reaches the 4*atr TP Level (breakeven)
- Let the rest ride.
- Best performing on short frequencies such as 1, 3, 5 mins.

Pivot Based Trailing Maxima & Minima [LuxAlgo]This indicator returns trailing maximums/minimums and the resulting average, each resetting on the occurrence of a pivot point high/low, thus allowing to highlight past and current support and resistance levels.
Note that the user has the option to make the indicator subject to backpainting or not. Backpainting would offset the indicator output to the past and as such would be less suited for real-time applications.
🔶 USAGE
🔹 Non Backpainting
The indicator can highlight points of support and resistance given by the trailing maximum/minimum average.
An uptrend is indicated when the trailing maximum is making a new higher high, while a downtrend is indicated when the trailing minimum makes a new lower low.
🔹 Backpainting
When backpainting is enabled the historical trailing maximum/minimum and their resulting average are offset to the past. However, we extend these to the most recent bar, allowing for real-time applications of the indicator.
Users can easily analyze past trends and determine their type by observing the trailing maximum/minimum behavior. For example, trailing maximums/minimums not making new higher high/lower low would indicate a ranging market.
The frequency of new higher high/lower low can also help determine how bullish/bearish a trend was.
🔶 SETTINGS
Length: Determines the pivot high/low lookback, with higher values allowing to detect longer-term tops and bottoms.
Backpaint: Determine if the indicator is subject to backpainting. Enabling this setting would offset the returned results in the past.

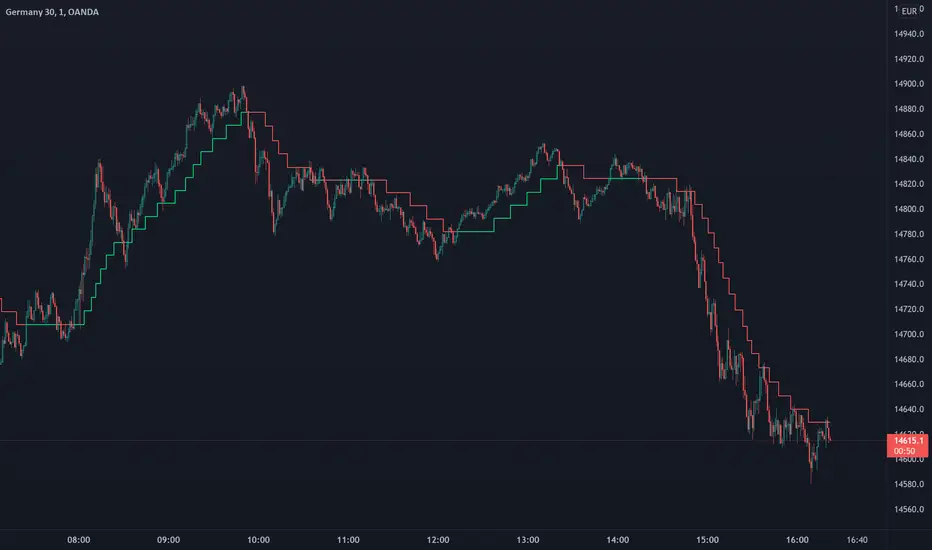
Trend Step - TrailingTrend Step - Trailing Stop is a moving average-based trailing stop that moves in pre-defined steps. In this way, the user can set the number of pips/points they want the trailing to move in relation to the movements in the average. You can also see it as trend steps. Every step represents the trend movement.
Usage
Use it as a trailing stop or as a trend direction tool.
Disclaimer: No financial advice, only for educational/entertainment purposes.
ST_trailingThe trailing indicator. If ohlc4 becomes "Percent activate trail" above the entry price set by the value and entry date, then the trailing function is activated, which is considered as the maximum ohlc4 for the time in the position minus "Percent activate trail" multiplied by "koeff trail"
