ADX Trend Strength Filter + TRAMA [DotGain]Summary
Are you tired of trading trend signals, only to get stopped out in volatile, sideways chop?
The ADX Trend Strength Filter (ADX TSF) is designed to solve this exact problem. It is a comprehensive trend-following system that only generates signals when a trend not only has the right direction and momentum, but also sufficient strength.
This indicator filters out weak or indecisive market phases (the "chop") and will only color the bars Green or Red when all conditions for a strong, confirmed trend are met.
⚙️ Core Components and Logic
The ADX TSF relies on a triple-filter logic to generate a clear trade signal:
Trend Filter (TRAMA): A TRAMA (Trending Adaptive Moving Average) is used as the main trendline. This adaptive average automatically adjusts to market volatility, acting as a dynamic support/resistance level.
Price > TRAMA = Bullish
Price < TRAMA = Bearish
Momentum Filter (RSI Crossover): Momentum is measured by a crossover of two moving averages of the RSI (a fast EMA and a slow SMA). This confirms whether the momentum is pointing in the same direction as the trend.
Strength Filter (ADX): This is the most important filter. A signal is only considered valid if the ADX (Average Directional Index) is above a defined threshold (Default: 30). This ensures the trend has sufficient strength.
🚦 How to Read the Indicator
The indicator has three states, displayed directly as bar colors on your chart:
🟩 GREEN BARS (Strong Uptrend) All three conditions are met:
Price is above the TRAMA.
RSI momentum is bullish (Fast MA > Slow MA).
ADX is above 30 (Strong trend is present).
🟥 RED BARS (Strong Downtrend) All three conditions are met:
Price is below the TRAMA.
RSI momentum is bearish (Fast MA < Slow MA).
ADX is above 30 (Strong trend is present).
🟧 ORANGE BARS (Neutral / Caution) This state appears if any of the following conditions are true:
Weak Trend: The ADX is below 30. The market is in consolidation or a sideways phase. (This is the primary filter!)
Indecision: The price is caught in the "Neutral Zone" between the TRAMA and the 200 SMA.
Visual Elements
Bar Colors: (Green/Red/Orange) Show the current trend status.
TRAMA (Orange Line): Your primary adaptive trendline.
200 SMA (White Line): Serves as a reference for the long-term trend.
Orange Background (Fill): Fills the area between the TRAMA and SMA to visually highlight the "Neutral Zone."
Key Benefit
The goal of the ADX TSF is to keep traders out of weak, unpredictable markets and help them participate only in strong, momentum-confirmed trends.
Have fun :)
Disclaimer
This "Buy The F*cking Dip" (BTFD) indicator is provided for informational and educational purposes only. It does not, and should not be construed as, financial, investment, or trading advice.
The signals generated by this tool (both "Buy" and "Sell") are the result of a specific set of algorithmic conditions. They are not a direct recommendation to buy or sell any asset. All trading and investing in financial markets involves substantial risk of loss. You can lose all of your invested capital.
Past performance is not indicative of future results. The signals generated may produce false or losing trades. The creator (© DotGain) assumes no liability for any financial losses or damages you may incur as a result of using this indicator.
You are solely responsible for your own trading and investment decisions. Always conduct your own research (DYOR) and consider your personal risk tolerance before making any trades.
Trend-filter

Generalized Smooth StepHello, folks. Sorry for not posting anything for a long time, just busy with my university studies for the moment.
Quick script for today — Smooth Step.
You can search for it in Wikipedia, but saying shortly and informatively, this is just an advanced type of oscillator, used as momentum indicator.
In the codes across the Internet everybody uses the 3rd order equation, BUT I found it kinda boring to use indicator this simple, so I made an option to choose the order of the equation in the settings — parameter "Order of the equation". This why it is called generalized smooth step, as it makes possible to use equation of virtually any order.
It is limited to 18 because very strange behaviour that you get after passing 18th order (it jsut becomes not tradeable any longer).
As I've mentioned above, it is an advanced version of classical oscillator, used as momentum indicator .
How to use it?
If smooth step is above 50, then the price momentum is bullish;
If smooth step is below 50, then the price momentum is bearish.
As simple as it is, it becomes useful enough on the higher timeframes (>=1H), so feel free to play with it and find optimal settings for yourself.
Hints
Try perform different smoothing and leading methods (developed by Ehler) to get better results;
You can use smooth step as confirmation/filter for trend-following trades.
Hope you will find it valueable.
Take your profits!
- Tarasenko Fyodor
RU:
Привет, ребята. Извините, что долго ничего не выкладывал, просто сейчас занят учебой в университете.
Быстрый скрипт на сегодня — Smooth Step.
Вы можете поискать его теоретическое обоснование в Википедии, но если говорить кратко и информативно, то это совершенствованный тип классического осциллятора, используемый в качестве моментум-индикатора .
В кодах в интернете все используют уравнение 3-го порядка, НО Мне было скучно пользоваться таким простым индикатором, поэтому я сделал возможность выбирать порядок уравнения в настройках — параметр " Порядок уравнения». Поэтому он называется обобщеннымsmooth step, так как позволяет использовать уравнение практически любого порядка.
Я ограничил порядок уравнения 18 , потому что индикатор показывает начинается очень странное поведение, когда вы делаете порядок больше 18 (индикатор просто начинается вести семя хаотично, что ли).
Как я уже упоминал выше, это усовершенствованная версия классического осциллятора, используемого в качестве моментум-индикатора .
Как им пользоваться?
Если smooth step выше 50, то импульс цены бычий;
Если smooth steз\p ниже 50, то импульс цены медвежий.
Хоть это и очень простой индикатор, он может оказаться достаточно полезным на старших таймфреймах (>=1H), так что не стесняйтесь играть с ним и находить оптимальные настройки для себя.
Советы
Попробуйте использовать различные методы сглаживания и лидирования (разработан Джоном Элером (John Ehler)), чтобы получить лучшие результаты;
Вы можете использовать smooth step в качестве подтверждения/фильтра для сделок, следующих за трендом.
Надеюсь, этот скрипт будет вам полезен.
Получите прибыль!
- Тарасенко Фёдор

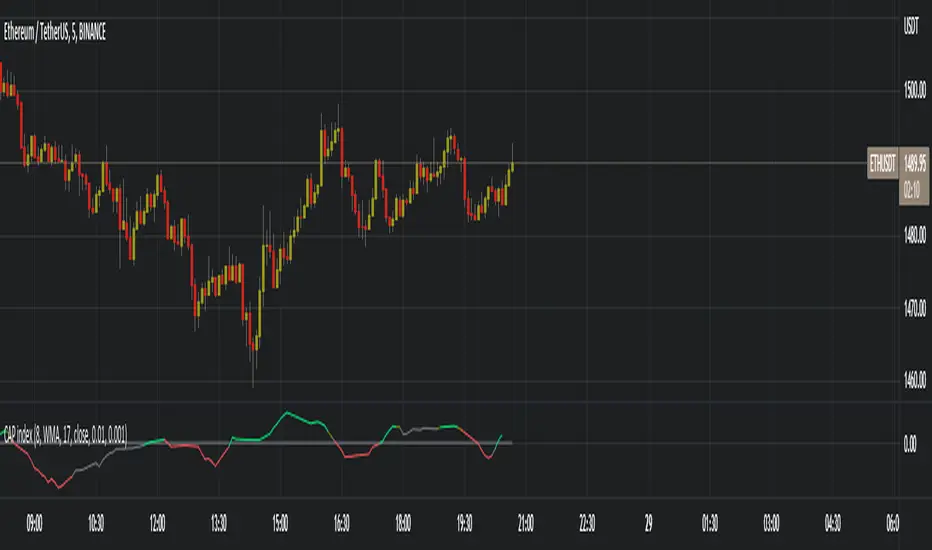
Constantly Applied Pressure Index (CAP index)BINANCE:ETHUSDT
The CAP index is my own homebrew trend indicator made to help traders see the slightly bigger picture, because we all know that as traders we can tend to hyper-focus in on a few candles and end up making a stupid trade because of it, or is it just me ? On a more serious note this indicator helps you find the short term trend by looking at bullish and bearish candles comparing their sizes, volumes and predominance.
The indicator has many technical settings for you to play around with but on the defaults it will render in a few colors which I will explain. Gray means no trend or that the current trend has died, bright green or red mean that a trend has formed, is playing out or that there is a good change a strong trend is about to form. Obviously green means bullish and red means bearish. Finally darker green and red mean a weak or weakening trend, this serves as a warning if you are about to take a trade in the trend direction.
The way I recommend using the indicator is the same way many trend indicators are used, as a filter to either a different indicator creating trading signals or to your own strategy's signals. I would add an illustration here that I prepared but I cannot because of tradingview's reputation rules
ATR with MAOVERVIEW
The Average True Range Moving Average (ATRMA) is a technical indicator that gauges the amount of volatility currently present in the market, relative to the historical average volatility that was present before. It adds a moving average to the Average True Range (ATR) indicator.
This indicator is extremely similar to the VOXI indicator, but instead of measuring volume, it measures volatility. Volume measures the amount of shares/lots/units/contracts exchanged per unit of time. Volatility, on the other hand, measures the range of price movement per unit of time.
The purpose of this indicator is to help traders filter between non-volatile periods in the market from volatile periods in the market without introducing subjectivity. It can also help long-term investors to determine market regime using volatility without introducing subjectivity.
CONCEPTS
This indicator assumes that trends are more likely to start during periods of high volatility, and consolidation is more likely to persist during periods of low volatility. The indicator also assumes that the average true range (ATR) of the last 14 candles is reflective of the current volatility in the market. ATR is the average height of all the candles, where height = |high - low|.
Suppose the ATR of the last 14 candles is greater than a moving average of the ATR(14) of the last 20 candles (this occurs whenever the indicator's filled region is colored BLUE). In that case, we can assume that the current volatility in the market is high.
Suppose the ATR of the last 14 candles is less than the moving average of the ATR(14) of the last 20 candles (this occurs whenever the indicator's filled region is colored RED). In that case, we can assume that the current volatility in the market is low.
HOW DO I READ THIS INDICATOR?
If the ATR line is above the ATR MA line (indicated by the blue color), the current volatility is greater than the historical average volatility.
If the ATR line is above the ATR MA line (indicated by the red color), the current volatility is less than the historical average volatility.

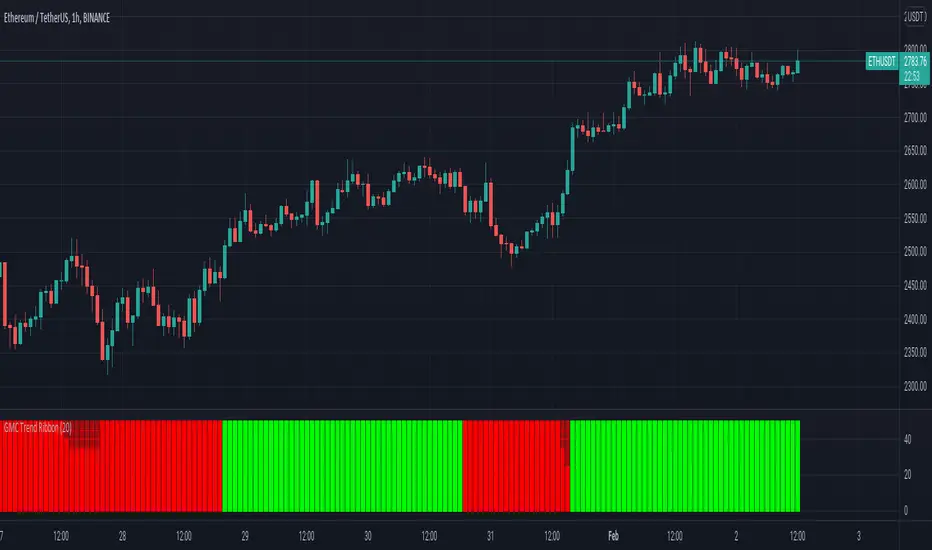
GMC Trend FilterAvoid Fake Signals, and identify the trend.
How it works ?
- it calculates main trend direction by using the length that is user-defined. so you can change it as you wish
- then it calculates trend direction for each 9 lower lengths. if you set the length = 20 then the lengths are 19, 18,...11
- and it checks if the trend directions that came from lower lengths is same or not with main trend direction.
- it changes the trend color of the ribbon.
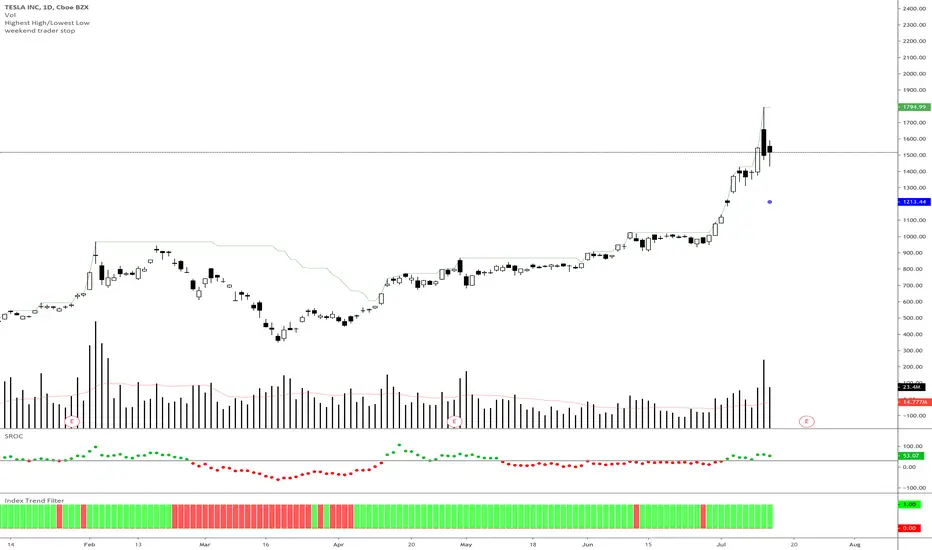
Index Trend Filter - Weekend Trend TraderThis little script simply gives you a quick visual cue of where price is compared to a particular EMA of another security or underlying index.
It is based on Nick Radge's broader market filter weekend trend trader system, but can be applied to other timeframes if you want to confirm if the index is in an up trend or down trend.
• Green means the underlying index price is above the EMA
• Red means the underlying index price is below the EMA
Ehlers Decycler OscillatorThis indicator was originally developed by John F. Ehlers (Stocks & Commodities , V.33:10 (September, 2015): "Decyclers").
The idea is still the same as for the Simple Decycler.
Mr. Ehlers suggested to virtually eliminate lag by getting rid of the very low-frequency components. So, he applied the high-pass filter to the simple decycler.
Mr. Ehlers recommended to use two instances of the Decycler Oscillator with different parameters (high-pass filter period and multiplier). As a result, he got the Decycler Oscillator pair.
The first oscillator (red line) has a period of 125 bars, the second one (yellow line) has a period of 100 bars.
The interpretation is straightforward:
When the yellow line crosses over the red line, a trend reversal to the upside is indicated.
When the yellow line crosses under the red line, a trend reversal to the downside is indicated.

Repulsion Moving Average - Least Crosses MAA Moving Average With Less Whipsaws Signals
The cross of the price with a moving average is one of the easiest strategy in technical analysis and could have worked if market price wasn't so noisy (In general periods of 1 to 20 produces the most whipsaws) . So it is possible to create a moving average who can manage to escape those noisy periods and produce 0 whipsaws ?
This question was asked by one of my work colleagues and i responded : "well... almost 0".
The Motion Of A Moving Average
Moving Average estimate the Trend and will always have phase shift, they will still follow the price and cross it during high volatility or low volatility periods, and when a moving average cross the price during a low volatility period you can expect lot of crosses.
In order to fix this behaviour a simple calculation exist :
FixMa = LongPeriodMA + MediumPeriodMA - ShortPeriodMA
We can see things in that way, the medium term MA is high pass filtered (subtracted) with a short term MA and the result is summed to a long term MA. We give more reactivity to our long term MA and thus creating some kind of repulsion motion with the price. Of course this can sometimes make the filter kinda zero-lag to some price periods (when the long term MA is near the price) .
Comparison
In red a simple moving average of period 100 and in blue our repulsion moving average :
In the image the short term moving average period is 100, since the long term period of the moving average is equal to short term x 3 you could be interested to look at the comparison of our moving average with the actual long term moving average :
Less crosses, i think you can see it.
Something to notice is that its always a tradeoff between Signal Speed and Signal Numbers , a classic moving average create faster signals but also a high numbers of them, a classic trailing stop create less signals but slowest ones, our moving average is some kind of average between those indicators.
Improvement Methods - Choice of The Filter/More Terms
A bad behaviour of our filter can be fixed by using filters who tend to create less crosses with the price or by developing the formula of our filter by adding more terms as follow :
fixma = ma(Price,a) + ma(Price,b) + ma(Price,c) - ma(Price,d) - ma(Price,e)
where a > b > c > d > e . The number of subtractive terms is equal to the number of summing terms - 1.
Way To Use
This indicator can be used like any moving average with cross strategy. Can also be used as a trailing stop.
No tests have been made proving that this indicator provide support and resistance levels, such signals come from more centered indicators.
Hope you enjoy
For any questions/demands feel free to pm me, i would be happy to help you :)

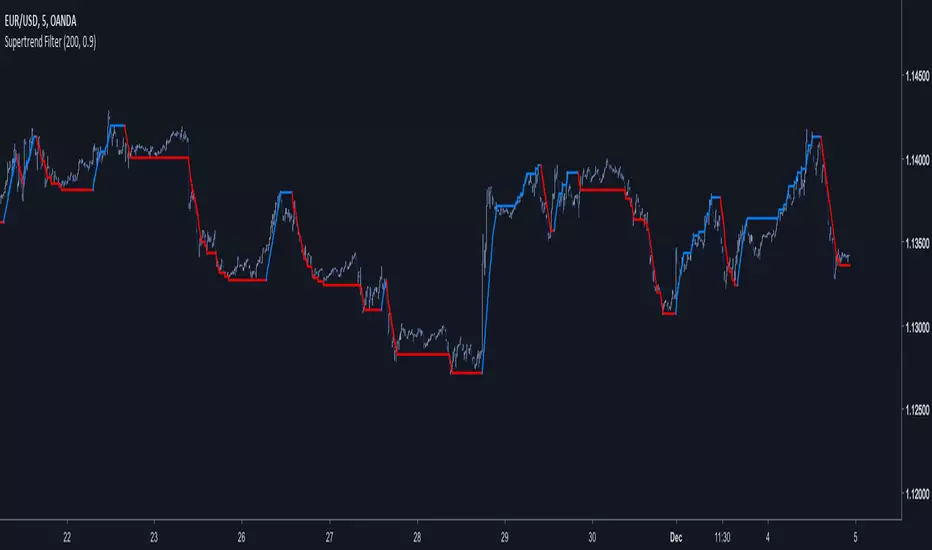
Supertrend FilterA derivation of the famous SuperTrend indicator.
My motivation for such indicator was to use more recursion in the original SuperTrend code, this work was made quite fast but feel free to modify it, as always my work is more for inspirational use than anything else so i hope it will inspire you to get more involved with the SuperTrend code or to start coding with Pine.
The indicator no longer act as a trailing-stop but more like a filter, this is due to the fact that the indicator conditions are swapped and that the output is reused many times in the calculation.
Parameters change as well and involve particular gestion. The Factor Parameter is no longer an integer but decimals such that 0 < Factor < 1 .
When the Period is high the indicator tend to become less linear/static and look more like a classic moving average.So it is important to have higher Factor values when the Period is high and reciprocally.Here a table to help you with parameters settings :
for Period = 1 to 50 Factor = 0.5
for Period = 50 to 100 Factor = 0.6
for Period = 100 to 150 Factor = 0.7
for Period = 150 to 200 Factor = 0.8
for Period = 200 to 300 Factor = 0.9
There could be a formula to scale the Factor depending on the Period but there would be no proof that the scaling method used is optimal.
Hope you enjoy
For any questions/demands feel free to pm me, i would be happy to help you
Trend FilterThe indicator colours the candles either Green or Red depending on the following conditions:-
If the N Bar Average Close > N Bar Average Open, the Bars are coloured Green.
If the N Bar Average Close < N Bar Average Open, the Bars are coloured Red.
