EMA and Dow Theory Strategies V2📘 Overview
This strategy is an advanced evolution of the original EMA × Dow Theory hybrid model. V2 introduces true swing‑based trend detection, gradient trend‑zones, higher‑timeframe swing overlays, and dynamic exit logic designed for intraday to short‑term trading across crypto, forex, stocks, and indices.
The system provides precise entries, adaptive exits, and highly visual guidance that helps traders understand trend structure at a glance.
🧠 Key Features
🔹 1. Dual‑EMA Trend Logic (Symbol + External Index)
Both the chart symbol and an external index (OTHERS.D) are evaluated using fast/slow EMAs to determine correlation‑based trend bias.
🔹 2. Dow Theory Swing Detection (Real‑time)
The script identifies swing highs/lows and updates trend direction when price breaks them. This creates a structural trend model that reacts faster than EMAs alone.
🔹 3. Gradient Trend Zones (Visual Trend Strength)
When trend is up or down, the area between price and the latest swing level is filled with a multi‑step gradient. This makes trend strength and distance-to-structure visually intuitive.
🔹 4. Higher‑Timeframe Swing Trend (htfTrend)
Swing highs/lows from a higher timeframe (e.g., 4H) are plotted to show macro structure. Used only for visual context, not for filtering entries.
🔹 5. RSI‑Based Entry Protection
RSI prevents entries during extreme overbought/oversold conditions.
🔹 6. Dynamic Exit System
Includes:
Custom stop‑loss (%)
Partial take‑profit (TP1/TP2/TP3)
Automatic scale‑out when trend color weakens
“Color‑change lockout” to prevent immediate re‑entry
Real‑time PnL tracking and labels
🔹 7. Alerts for All Key Events
Entry, stop‑loss, partial exits, and trend‑change exits all generate structured JSON alerts.
🔹 8. Visual PnL Labels & Equity Tracking
PnL for the latest trade is displayed directly on the chart, including scale‑out adjustments.
⚙️ Input Parameters
Parameter Description
Fast EMA / Slow EMA EMAs used for symbol trend detection
Index Fast / Slow EMA EMAs applied to external index
StopLoss (%) Custom stop‑loss threshold
Scale‑Out % Portion to exit when trend color weakens
RSI Period / Levels Overbought/oversold filters
Swing Detection Length Bars used to detect swing highs/lows
Stats Display Position of statistics table
🧭 About htfTrend (Higher Timeframe Trend)
The higher‑timeframe swing trend is displayed visually but not used for entry logic.
Why? Strict HTF filtering reduces trade frequency and often removes profitable setups. By keeping it visual‑only, traders retain flexibility while still benefiting from macro structure awareness.
Use it as a contextual guide, not a constraint.
📘 概要
本ストラテジーは、V1 を大幅に拡張した EMA × ダウ理論 × スイング構造 × 上位足トレンド可視化 の複合型モデルです。 短期〜デイトレード向けに最適化されており、仮想通貨・FX・株式・指数など幅広いアセットで利用できます。
V2 では、スイング構造の自動検出、グラデーションによるトレンド強度の可視化、上位足スイングライン、動的な利確/損切りロジック が追加され、視覚的にもロジック的にも大幅に強化されています。
🧠 主な機能
🔹 1. 銘柄+外部インデックスの EMA クロス判定
対象銘柄と OTHERS.D の EMA を比較し、相関を考慮したトレンド方向を判定します。
🔹 2. ダウ理論に基づくスイング高値・安値の自動検出
スイング更新によりトレンド方向を切り替える、構造ベースのトレンド判定を採用。
🔹 3. グラデーション背景によるトレンド強度の可視化
スイングラインから現在価格までを段階的に塗り分け、 「どれだけトレンドが伸びているか」を直感的に把握できます。
🔹 4. 上位足スイングトレンド(htfTrend)の表示
4H などの上位足でのスイング高値・安値を表示し、 大局的なトレンド構造を視覚的に把握できます(ロジックには未使用)。
🔹 5. RSI による過熱・売られすぎフィルター
極端な RSI 状態でのエントリーを防止。
🔹 6. 動的イグジットシステム
カスタム損切り(%)
TP1/TP2/TP3 の段階的利確
トレンド色の弱まりによる自動スケールアウト
色変化後の再エントリー制限(waitForColorChange)
リアルタイム PnL の追跡とラベル表示
🔹 7. アラート完備(JSON 形式)
エントリー、損切り、部分利確、トレンド反転などすべてに対応。
🔹 8. 損益ラベル・統計表示
直近トレードの損益をチャート上に表示し、視覚的に把握できます。
⚙️ 設定項目
設定項目名 説明
Fast / Slow EMA 銘柄の EMA 設定
Index Fast / Slow EMA 外部インデックスの EMA 設定
損切り(%) カスタム損切りライン
部分利確割合 トレンド弱化時のスケールアウト割合
RSI 期間・水準 過熱/売られすぎフィルター
スイング検出期間 スイング高値・安値の検出に使用
統計表示位置 テーブルの表示位置
🧭 上位足トレンド(htfTrend)について
上位足スイングの更新に基づくトレンド判定を表示しますが、 エントリー条件には使用していません。
理由: 上位足を厳密にロジックへ組み込むと、トレード機会が大幅に減るためです。
本ストラテジーでは、 「大局の把握は視覚で、エントリーは柔軟に」 という設計思想を採用しています。
→ 裁量で利確判断や逆張り回避に活用できます。
趋势分析

Liquidity Maxing [JOAT]Liquidity Maxing - Institutional Liquidity Matrix
Introduction
Liquidity Maxing is an open-source strategy for TradingView built around institutional market structure concepts. It identifies structural shifts, evaluates trades through multi-factor confluence, and implements layered risk controls.
The strategy is designed for swing trading on 4-hour timeframes, focusing on how institutional order flow manifests in price action through structure breaks, inducements, and liquidity sweeps.
Core Functionality
Liquidity Maxing performs three primary functions:
Tracks market structure to identify when control shifts between buyers and sellers
Scores potential trades using an eight-factor confluence system
Manages position sizing and risk exposure dynamically based on volatility and user-defined limits
The goal is selective trading when multiple conditions align, rather than frequent entries.
Market Structure Engine
The structure engine tracks three key events:
Break of Structure (BOS): Price pushes beyond a prior pivot in the direction of trend
Change of Character (CHoCH): Control flips from bullish to bearish or vice versa
Inducement Sweeps (IDM): Market briefly runs stops against trend before moving in the real direction
The structure module continuously updates strong highs and lows, labeling structural shifts visually. IDM markers are optional and disabled by default to maintain chart clarity.
The trade engine requires valid structure alignment before considering entries. No structure, no trade.
Eight-Factor Confluence System
Instead of relying on a single indicator, Liquidity Maxing uses an eight-factor scoring system:
Structure alignment with current trend
RSI within healthy bands (different ranges for up and down trends)
MACD momentum agreement with direction
Volume above adaptive baseline
Price relative to main trend EMA
Session and weekend filter (configurable)
Volatility expansion/contraction via ATR shifts
Higher-timeframe EMA confirmation
Each factor contributes one point to the confluence score. The default minimum confluence threshold is 6 out of 8, but you can adjust this from 1-8 based on your preference for trade frequency versus selectivity.
Only when structure and confluence agree does the strategy proceed to risk evaluation.
Dynamic Risk Management
Risk controls are implemented in multiple layers:
ATR-based stops and targets with configurable risk-to-reward ratio (default 2:1)
Volatility-adjusted position sizing to maintain consistent risk per trade as ranges expand or compress
Daily and weekly risk budgets that halt new entries once thresholds are reached
Correlation cooldown to prevent clustered trades in the same direction
Global circuit breaker with maximum drawdown limit and emergency kill switch
If any guardrail is breached, the strategy will not open new positions. The dashboard clearly displays risk state for transparency.
Market Presets
The strategy includes configuration presets optimized for different market types:
Crypto (BTC/ETH): RSI bands 70/30, volume multiplier 1.2, enhanced ATR scaling
Forex Majors: RSI bands 75/25, volume multiplier 1.5
Indices (SPY/QQQ): RSI bands 70/30, volume multiplier 1.3
Custom: Default values for user customization
For crypto assets, the strategy automatically applies ATR volatility scaling to account for higher volatility characteristics.
Monitoring and Dashboards
The strategy includes optional monitoring layers:
Risk Operations Dashboard (top-right):
Trend state
Confluence score
ATR value
Current position size percentage
Global drawdown
Daily and weekly risk consumption
Correlation guard state
Alert mode status
Performance Console (top-left):
Net profit
Current equity
Win rate percentage
Average trade value
Sharpe-style ratio (rolling 50-bar window)
Profit factor
Open trade count
Optional risk tint on chart background provides visual indication of "safe to trade" versus "halted" state.
All visualization elements can be toggled on/off from the inputs for clean chart viewing or full telemetry during parameter tuning.
Alerts and Automation
The strategy supports alert integration with two formats:
Standard alerts: Human-readable messages for long, short, and risk-halt conditions
Webhook format: JSON-formatted payloads ready for external execution systems (optional)
Alert messages are predictable and unambiguous, suitable for manual review or automated forwarding to execution engines.
Built-in Validation Suite
The strategy includes an optional validation layer that can be enabled from inputs. It checks:
Internal consistency of structure and confluence metrics
Sanity and ordering of risk parameters
Position sizing compliance with user-defined floors and caps
This validation is optional and not required for trading, but provides transparency into system operation during development or troubleshooting.
Strategy Parameters
Market Presets:
Configuration Preset: Choose between Crypto (BTC/ETH), Forex Majors, Indices (SPY/QQQ), or Custom
Market Structure Architecture:
Pivot Length: Default 5 bars
Filter by Inducement (IDM): Default enabled
Visualize Structure: Default enabled
Structure Lookback: Default 50 bars
Risk & Capital Preservation:
Risk:Reward Ratio: Default 2.0
ATR Period: Default 14
ATR Multiplier (Stop): Default 2.0
Max Drawdown Circuit Breaker: Default 10%
Risk per Trade (% Equity): Default 1.5%
Daily Risk Limit: Default 6%
Weekly Risk Limit: Default 12%
Min Position Size (% Equity): Default 0.25%
Max Position Size (% Equity): Default 5%
Correlation Cooldown (bars): Default 3
Emergency Kill Switch: Default disabled
Signal Confluence:
RSI Length: Default 14
Trend EMA: Default 200
HTF Confirmation TF: Default Daily
Allow Weekend Trading: Default enabled
Minimum Confluence Score (0-8): Default 6
Backtesting Considerations
When backtesting this strategy, consider the following:
Commission: Default 0.05% (adjustable in strategy settings)
Initial Capital: Default $100,000 (adjustable)
Position Sizing: Uses percentage of equity (default 2% per trade)
Timeframe: Optimized for 4-hour charts, though can be tested on other timeframes
Results will vary significantly based on:
Market conditions and volatility regimes
Parameter settings, especially confluence threshold
Risk limit configuration
Symbol characteristics (crypto vs forex vs equities)
Past performance does not guarantee future results. Win rate, profit factor, and other metrics should be evaluated in context of drawdown periods, trade frequency, and market conditions.
How to Use This Strategy
This is a framework that requires understanding and parameter tuning, not a one-size-fits-all solution.
Recommended workflow:
Start on 4-hour timeframe with default parameters and appropriate market preset
Run backtests and study performance console metrics: focus on drawdown behavior, win rate, profit factor, and trade frequency
Adjust confluence threshold to match your risk appetite—higher thresholds mean fewer but more selective trades
Set realistic daily and weekly risk budgets appropriate for your account size and risk tolerance
Consider ATR multiplier adjustments based on market volatility characteristics
Only connect alerts or automation after thorough testing and parameter validation
Treat this as a risk framework with an integrated entry engine, not merely an entry signal generator. The risk controls are as important as the trade signals.
Strategy Limitations
Designed for swing trading timeframes; may not perform optimally on very short timeframes
Requires sufficient market structure to identify pivots; may struggle in choppy or low-volatility environments
Crypto markets require different parameter tuning than traditional markets
Risk limits may prevent entries during favorable setups if daily/weekly budgets are exhausted
Correlation cooldown may delay entries that would otherwise be valid
Backtesting results depend on data quality and may not reflect live trading with slippage
Design Philosophy
Many indicators tell you when price crossed a moving average or RSI left oversold. This strategy addresses questions institutional traders ask:
Who is in control of the market right now?
Is this move structurally significant or just noise?
Do I want to add more risk given what I've already done today/week?
If I'm wrong, exactly how painful can this be?
The strategy provides disciplined, repeatable answers to these questions through systematic structure analysis, confluence filtering, and multi-layer risk management.
Technical Implementation
The strategy uses Pine Script v6 with:
Custom types for structure, confluence, and risk state management
Functional programming approach for reusable calculations
State management through persistent variables
Optional visual elements that can be toggled independently
The code is open-source and can be modified to suit individual needs. All important logic is visible in the source code.
Disclaimer
This script is provided for educational and informational purposes only. It is not intended as financial, investment, trading, or any other type of advice or recommendation. Trading involves substantial risk of loss and is not suitable for all investors. Past performance, whether real or indicated by historical tests of strategies, is not indicative of future results.
No representation is being made that any account will or is likely to achieve profits or losses similar to those shown. In fact, there are frequently sharp differences between backtested results and actual results subsequently achieved by any particular trading strategy.
The user should be aware of the risks involved in trading and should trade only with risk capital. The authors and publishers of this script are not responsible for any losses or damages, including without limitation, any loss of profit, which may arise directly or indirectly from use of or reliance on this script.
This strategy uses technical analysis methods and indicators that are not guaranteed to be accurate or profitable. Market conditions change, and strategies that worked in the past may not work in the future. Users should thoroughly test any strategy in a paper trading environment before risking real capital.
Commission and slippage settings in backtests may not accurately reflect live trading conditions. Real trading results will vary based on execution quality, market liquidity, and other factors not captured in backtesting.
The user assumes full responsibility for all trading decisions made using this script. Always consult with a qualified financial advisor before making investment decisions.
Enjoy - officialjackofalltrades

Heikin Ashi Wick Strategy
🔥 Heikin Ashi Wick Momentum Strategy
“Trade momentum decay before the trend breaks.
>> FOCUS ON WICKS, NOT ONLY CANDLE COLOR<<
What Makes This Different (Traffic Driver)
✔ Uses Heikin Ashi wicks (almost nobody does this correctly)
✔ Captures trend continuation, not breakouts
✔ Exits before momentum collapse, not after
✔ Non-repainting
✔ Clean charts, instant readability
This Strategy Is REALLY Trading
This is a Heikin Ashi momentum-decay system:
• Enters when trend is strong but not euphoric
• Exits when:
o Trend stops probing higher
o Sellers gain relative strength
It avoids:
• Chasing strong breakout candles
• Holding through momentum rollovers
Candle Type Used: Heikin Ashi (manually calculated)
NOTE: The script does not use regular candles.
It reconstructs Heikin Ashi (HA) candles from raw OHLC:
• HA Close = average of open, high, low, close
• HA Open = midpoint of prior HA candle (smoothed)
• HA High / Low = extremes of HA open/close vs real high/low
➡️ This filters noise and emphasizes trend structure and momentum.
Strengths
✅ Works well in strong, smooth trends
✅ Very clean logic (no indicators)
✅ Non-repainting
✅ Early exits protect capital
Best Use
This works best on:
• Daily timeframe
• Strong trend ETFs / megacaps
o QQQ
o SPY
o NVDA, MSFT, AAPL
• When combined with:
o EMA 21 trend filter (your preference)
o Market regime filter (e.g., above 50/200 SMA)
o Rising 10 EMA and 20 EMA
________________________________________
8️⃣ Weaknesses (Important)
⚠️ No stop loss (only structure-based exits)
⚠️ Can exit too early in explosive trends
⚠️ Will chop in sideways markets
⚠️ No volatility filter (ATR, EMA, regime)
How to Avoid the Weaknesses — Summary
Turn the setup from a concept into a robust strategy by adding these controls:
1. Trade Only Trends
o Require price above EMA-21 (optionally EMA-21 > EMA-50)
o Eliminates chop and sideways markets
2. Improve Exits (Avoid Leaving Winners Too Early)
o Partial exit when upper wick disappears
o Full exit only when lower wick dominates
o Optional: require 2 consecutive exit candles
3. Add Risk Protection
o Use a volatility stop: ~1.5× ATR(14) below entry or below HA swing low
o Protects against gaps and sudden reversals
4. Filter Weak Signals
o Require meaningful wick size (≈30–40% of candle range)
o Avoids low-quality indecision candles
5. Avoid Bad Volatility
o Skip entries when ATR is expanding aggressively
o Focus on calmer, controllable trends
6. Limit Time in Trade
o Add a max bars hold (e.g., 10–15 bars on daily)
o Prevents capital getting stuck in fading trends
⚠️ Educational use only. Not financial advice. Trading involves risk and losses can exceed expectations. Past performance does not guarantee future results. Use at your own risk.

sullaojo 3mHere is the English translation for the alert setup instructions:
**How to Set Up Alerts (After Adding the Code)**
1. Click the **Add to chart** button to apply the indicator to your graph.
2. Click the **Alarm Clock icon (Alerts)** on the top right toolbar of TradingView, or press `Alt + A`.
3. In the **Condition** field:
* Select the indicator named **"MA Crossover Buy Alert..."**
* Select **"แจ้งเตือนซื้อ (Buy Alert)"** to receive only buy signals.
4. In the **Trigger** (or Options) section: Select **Once per bar close**.
*(This is recommended per the textbook to confirm that the closing price actually crossed the line, avoiding false signals during intraday volatility.)*
5. Check **Notify on App** (for mobile) or **Show pop-up** as desired, then click **Create**.
Now, when the moving averages cross according to the textbook's conditions, the system will send you an alert immediately!

SMH_DualMomentum (ROC + Volume Trend)SMH Dual Momentum (ROC + Volume Confirmation)
This indicator identifies high-quality bullish trends by combining price momentum (Rate of Change) with volume confirmation, and exits when momentum structurally fails.
Core Logic
BUY signal
Rate of Change (ROC) over N periods is above a positive threshold (strong upside momentum)
Current volume is above its moving average (rising market participation)
SELL signal
ROC crosses below zero, indicating loss of bullish momentum
Why It Works
ROC measures the speed and strength of price movement, filtering out weak or drifting trends
Volume confirmation ensures momentum is supported by real capital flow, reducing false breakouts
Momentum-based exit avoids prolonged drawdowns and capital stagnation
Key Advantages
Focuses on trend continuation, not prediction
Filters out low-quality price moves and range-bound markets
Captures long, high-conviction trends with relatively few trades
Simple, robust rules using only price and volume
Best Use Cases
Designed for trend-driven ETFs such as SMH (Semiconductors)
Suitable for swing to position trading on daily charts
Works best in markets with strong sector rotation and institutional participation
Notes
This is a trend-following momentum tool, not a mean-reversion indicator
No stop-loss is built in; risk management should be handled externally if required
Parameters can be adjusted to match different timeframes or assets

Infinity Algo Backtest═════════════════════════════════════════════════════════════════════════
█ THE PROBLEM
Most trading strategies fail because they rely on static settings that break when market conditions change. Traders spend hours manually optimizing parameters — only to see them underperform in live markets. Backtesting becomes guesswork instead of science.
█ THE SOLUTION
Infinity Algo V3.0 Backtest solves this with Auto-Tune — an optimization engine that runs 500+ parameter simulations in the background and selects the best configuration for your specific market, automatically.
Combined with multi-mode entry engines, flexible exit management, and adaptive risk controls — this is a complete backtesting system trusted by 8,000+ traders worldwide.
═════════════════════════════════════════════════════════════════════════
█ KEY FEATURES
✅ 5 Entry Modes: Normal, Smart, AI, HL Sniper, AI Sniper
✅ 3 Exit Modes: Percentage targets, Signal step-outs, Opposite signal flip
✅ 6 Take-Profit Levels with customizable partial position sizing
✅ Trailing Stop-Loss (None / Breakeven / Moving Target)
✅ Auto-Tune Optimization (Walk-Forward or Static)
✅ Pyramiding support for add-on entries
✅ Structured alert payloads for webhook automation
✅ Works on any market: Crypto, Forex, Stocks, Indices, Commodities
═════════════════════════════════════════════════════════════════════════
█ WHAT MAKES INFINITY ALGO DIFFERENT
🧠 Auto-Tune Engine (The Core Innovation)
Unlike static strategies, Infinity Algo continuously backtests parameter combinations and surfaces the optimal settings for your current asset. Choose from 12 scoring metrics including Sharpe Ratio, Sortino Ratio, Profit Factor, and Win Rate.
🎯 Multi-Mode Entry System
Switch between trend-following, contrarian, and sniper modes — all within one strategy. No need to maintain multiple scripts.
🛡️ Adaptive Risk Management
Trailing SL modes that respond to your TP hits:
Breakeven: Locks in safety after your chosen TP is reached
Moving Target: Ratchets your stop to the previous TP level as profit grows
═════════════════════════════════════════════════════════════════════════
█ ENTRY ENGINES 🎯
Normal + Smart (Default)
Normal: Contrarian entries — momentum cross against the trend filter for reversal plays
Smart: Trend-following entries — momentum cross with the trend filter for continuation plays
AI / Auto-Tune
Automated parameter selection based on historical simulation
Walk-Forward: Re-optimizes every N bars to adapt to regime changes
Static: Locks in the best settings from full history
HL Sniper
Trend-trigger mode for selective, high-conviction entries
Fewer signals, but higher probability setups
AI Sniper
Auto-Tune optimizes the Sniper configuration specifically for your market
═════════════════════════════════════════════════════════════════════════
█ EXIT MODES 🚪
1) Percentage Targets
Up to 6 TP levels (TP1…TP6) with customizable partial exits
Configure both price distance (%) and position size (%) for each level
Designed for scaling out rather than all-in/all-out
2) Signal Step-Outs
Momentum-shift condition triggers partial exits
Optional higher-timeframe confirmation
"New TP Must Beat Last" prevents weak consecutive exits
3) Opposite Signal
Closes/flips position when the next opposite entry signal appears
Best for trend-following systems
═════════════════════════════════════════════════════════════════════════
█ USE CASES
📈 Trending Markets
Use "Smart" signals + Percentage TPs. Stay aligned with momentum while scaling out at multiple targets. Enable Moving Target trailing to lock in profits.
📉 Ranging / Choppy Markets
Use "Normal" signals (contrarian mode). Catch reversals at range boundaries. Tighter TP targets work better here.
⚡ High Volatility / News Events
Use "HL Sniper" for selective entries. Fewer signals, higher conviction. Wider SL to avoid stop hunts.
🤖 Automation & Bots
Structured alert payloads work with 3Commas, Alertatron, Cornix, TradingConnector, and custom webhooks. One alert contains Entry + 6 TPs + SL.
═════════════════════════════════════════════════════════════════════════
█ HOW TO USE 🔧
Apply to your chart (any timeframe, any market)
Start with Entry Signals = "Normal + Smart", Exit Mode = "Percentage"
Pick your direction (Long / Short / Both)
Adjust signal thresholds and trend filter length to match your style
Configure TP% levels and Qty% — total should sum to 100%
Enable Stop-Loss and choose a trailing mode
Set commission and slippage in Strategy Properties for realistic results
Optional: Enable Auto-Tune for adaptive optimization
═════════════════════════════════════════════════════════════════════════
█ STRATEGY PROPERTIES 📊
Default settings for reproducible backtests:
Initial capital: 10,000 USD
Order size type: Cash
Default order size: 10,000
Process orders on close: Enabled
Pyramiding: Controlled by "Allow Add-On Entries"
For realistic results, set commission and slippage in Strategy Properties to match your broker/exchange.
═════════════════════════════════════════════════════════════════════════
█ ALERTS & AUTOMATION 🔔
The strategy outputs structured alert payloads compatible with:
3Commas, Alertatron, Cornix, TradingConnector, Wunderbit
Custom webhook receivers (JSON format)
Setup: Create alert → Select "Order fills and alert() function calls" → Use {{strategy.order.alert_message}} placeholder
═════════════════════════════════════════════════════════════════════════
█ WORKS ON
Crypto
Forex
Stocks
Indices
Commodities
═════════════════════════════════════════════════════════════════════════
█ OUR PHILOSOPHY 💡
We believe success lies in the trader, not the indicator. Infinity Algo is a decision-support tool — not a crystal ball.
Realistic Expectations:
No strategy wins 100% of the time — Infinity Algo is no exception
Auto-Tune optimizes on past data — it cannot predict the future
Backtest results ≠ live results (fees, slippage, and emotions matter)
Always validate with out-of-sample data before going live
Use proper position sizing and risk management
═════════════════════════════════════════════════════════════════════════
█ LIMITATIONS ⚠️
Backtests are simulations — results depend on market conditions, fees, slippage, and parameters
Auto-Tune can overfit if used without out-of-sample validation
Multi-timeframe exit logic confirms on higher-TF bar closes (slight delay expected)
Use standard candles/bars for strategy testing (avoid Heikin Ashi, Renko)
═════════════════════════════════════════════════════════════════════════
█ DISCLAIMER 📜
This strategy is provided for educational and informational purposes only and does not constitute financial advice. Past performance is not indicative of future results. Trading involves substantial risk of loss, and you are solely responsible for your own trading decisions.
═════════════════════════════════════════════════════════════════════════

NIFTY_2MIN_CVD_Absorption_long_StrategySummary
This strategy is an intraday system designed for the Nifty index on a 2-minute timeframe, focusing on high-probability reversal entries. It utilizes price action patterns and Cumulative Volume Delta (CVD) to identify market turning points.
Long Strategy: Concept & Core Logic
The long strategy is engineered to identify "V-shaped" recoveries where selling pressure is exhausted and absorbed by aggressive buyers.
Price Action Trigger: The strategy looks for a specific two-part sequence:
Sudden Bearish Movement: A rapid downward move representing a final flush of sellers.
Sudden Reversal: Immediately followed by a strong, high-momentum bullish (green) candle, indicating a swift change in market sentiment.
CVD Absorption Filter: To confirm the validity of the reversal, the strategy analyzes the Cumulative Volume Delta (CVD). It specifically looks for instances where the relative movement of CVD is significantly higher than the corresponding price movement. This divergence suggests "selling absorption"—where large buy orders are soaking up sell-side liquidity, creating a floor for the reversal.
Risk Management (Long)
The strategy utilizes fixed exit parameters based on the underlying Nifty price points:
Take Profit: 25 points.
Stop Loss: 30 points.
Intended Use
This tool is intended for traders who study mechanical, rule-based systems. It demonstrates how price action, volume delta divergence (CVD), and trend filters can be combined to time entries in both trending and reversal market conditions.
Disclaimer: This script is for educational and informational purposes only. It is not financial advice. All trading involves risk, and past performance is not indicative of future results. Please conduct your own research and backtesting before making any trading decisions.

ParetoCapital AlogrithmThis strategy is a volatility-based breakout system designed to trade only when the market shows sufficient expansion and directional clarity.
It operates by:
Filtering market regime using a long-term trend reference to avoid trading against dominant momentum.
Activating only during elevated volatility, ensuring trades are taken when price movement has enough energy to justify risk.
Entering via breakout orders, not market orders, so trades are triggered only if price confirms continuation.
Applying strict risk control, with capital usage and risk capped per trade.
Separating backtest logic from live execution, using fixed external order sizing for consistency in automation.
The strategy is intended for systematic, automated execution and avoids overtrading by remaining inactive during low-volatility or unclear market conditions.

Signal Algo - Elephant Edge Strategy🔶 Strategy Overview:
This strategy is designed for intraday trading and focuses on taking trades near important price reference areas instead of random market locations.
This strategy is designed to:
Take trades only near important price levels
Avoid random mid-market entries
Validate every trade using multiple confirmation filters
It combines the following core concepts:
Elephant Edge zones based on previous session volatility
Index & F&O strike price levels (psychological and liquidity-based levels)
Previous Day OHLC levels (important institutional reference prices)
The goal of this strategy is to allow trades only when price behavior is meaningful and occurs near key market reference areas, while filtering out low-quality signals. All filters are optional, allowing traders to customize the strategy according to their trading style, risk preference, and market conditions.
🔶 How to Use: Elephant Edge Support–Resistance
This strategy is based on the Elephant Edge Support–Resistance concept, where trades are taken only near important price zones instead of random market areas.
The image above shows how the strategy identifies Support Zones, Resistance Zones, and how trade entries and exits are generated.
🟩 Support Zones:
Shown as green areas. These are considered potential Buy zones.
A positive price reaction from these zones is required before a Buy entry is generated.
🟥 Resistance Zones:
Shown as red areas. These are considered potential Sell zones.
Price rejection from these zones is required before a Sell entry is generated.
Important:
The strategy does not blindly buy or sell at the zone. Entries are generated only after additional confirmation, such as: Candle structure validation, Directional filters, Optional, volume and time filters (if enabled)
Trade entries are generated only when price touches a Support or Resistance zone.
These zones represent areas where price is more likely to react, helping to avoid low-quality trades during sideways or random market movement.
Final Understanding:
This strategy is not about predicting the market. It is about reacting to price behavior at important levels and trading only when conditions are meaningful.
🔶 How to Use: Index Strike Price Support–Resistance
This concept is based on *Index & F&O Strike Price levels*, where trades are taken near important *round-number strike prices* (for example: every 50 or 100 points), instead of random price locations.
The image above shows how *strike prices act as natural Support and Resistance levels** in index trading.
🟩 Strike Price Support:
Strike levels below the current price act as potential Support zones. Price reaction from these levels is required before a Buy entry is generated.
🟥 Strike Price Resistance:
Strike levels above the current price act as potential Resistance zones. Price rejection from these levels is required before a Sell entry is generated.
Trade entries are generated only when price touches or reacts near a strike price level.
These levels represent *psychological and liquidity-based areas*, where price is more likely to pause, reverse, or react.
🔶 How to Use: Previous Day OHLC Levels
This concept is based on *Previous Day Open, High, Low, and Close (OHLC)* levels, which are widely used as *important market reference prices* by traders and institutions.
The image above shows how price reacts around Previous Day OHLC levels and how they act as natural *Support and Resistance areas** during intraday trading.
🟩 Previous Day Support Levels:
Previous Day Open, Low, or Close levels below the current price act as potential Support zones.
A positive price reaction from these levels is required before a Buy entry is generated.
🟥 Previous Day Resistance Levels:
Previous Day Open, High, or Close levels above the current price act as potential Resistance zones. Price rejection from these levels is required before a Sell entry is generated.
Trade entries are generated only when price touches or reacts near a Previous Day OHLC level.
These levels represent *high-interest price areas* where price is more likely to pause, reverse, or show strong reactions.
🔵 Strategy Setting Features Overview :
Trade Direction Controls : -
Buy Only When enabled: The strategy will generate only Buy trades All Sell signals are ignored Sell Only When enabled: The strategy will generate only Sell trades All Buy signals are ignored
Important Note If both Buy Only and Sell Only are enabled: The strategy can generate both Buy and Sell trades
Candle Direction & Color Filter : -
Available Options:
Both - Candle color is ignored Trades depend only on strategy logic
Trend - Buy → Green candles only. Sell → Red candles only
O-Trend - Buy → Red candles only. Sell → Green candles only
Continuous Buy / Sell Check : -
When enabled: Prevents repeated trades in the same direction Reduces over-trading during sideways markets Example: After a Buy trade, another Buy trade will not be taken immediately unless conditions reset.
Elephant Edge Percentile Levels : -
When enabled: Buy trades are allowed only near lower percentile levels Sell trades are allowed only near upper percentile levels
Why this matters: Percentile levels act as dynamic intraday support and resistance based on historical price movement.
Strike Price Level Filters : -
When enabled: Buy trades require price to touch lower strike zones Sell trades require price to touch upper strike zones
Why strike levels are important: Strike prices often act as psychological and liquidity zones, especially in index trading.
Previous Day OHLC Levels : -
When enabled: Draws Previous Day Open, High, Low, and Close on the chart Trades are allowed only when price touches any of these levels
Why Previous Day levels matter: These levels are widely watched by traders and institutions Price often reacts strongly near them Helps filter out low-probability trades
Stoploss Settings : -
Candle Touch: Stoploss triggers immediately when price touches the level
Candle Close: Stoploss triggers only after candle closes beyond the level
Stoploss Type Choose how stoploss distance is calculated:
Candle High / Low
Fixed Points
Percentage based
Trailing Stoploss : -
Trailing stoploss helps protect profits as price moves favorably. Trailing Mode
Points
Percentage
Trailing Activation Defines how much profit is required before trailing starts.
Candle Structure Filters : -
Candle Size : Filter Avoids trades on: Very small candles (low momentum) Extremely large candles (high risk)
Candle Body : Filter Ensures trades are taken only on candles with sufficient body strength.
Wick Filter : Filters out candles with unusually long wicks, which often indicate fake breakouts.
Hammer Candle Detection : -
Enable Hammer Pattern Detects hammer-type candles using wick-to-body ratios.
Useful for: Reversal-based setups near key levels
Entry & Stop Buffers : -
Buffers add small offsets to: Entry price Stoploss price
Purpose: Helps avoid false triggers caused by small price spikes or noise.
Volume-Based Validation : -
Use Volume Alert Validity Trades are allowed only after a high-volume candle appears.
Why volume matters: High volume confirms participation and interest.
Time & Trade Limits : -
Entry / Exit Time Restricts trades to specific market hours. Trade Count Limits Controls the maximum number of trades per session to avoid over-trading.
Quantity Calculation: -
Investment Amount Automatically calculates trade quantity based on capital amount.
Benefit: Helps maintain consistent risk across different instruments.
JSON Alert Output: -
Used for: Automation Broker integration This does not affect strategy logic.
⚠️ Disclaimer This strategy is provided for educational and research purposes only. Past performance does not guarantee future results. Users should test and manage risk independently.

New Rate - PREMIUM v2New Rate - PREMIUM v2
New Rate - PREMIUM v2 is an intraday Opening Range Breakout (ORB) strategy built around a strict one-trade-per-day execution model.
The strategy defines a price range using the first N candles of a user-defined session, freezes the High/Low at the close of candle N, and places OCO stop orders exactly at those levels. The first breakout fills, the opposite order is canceled, and no further trades are allowed until the next trading day.
This script is published for educational and research purposes, with documented mechanics and backtest settings to support transparency and reproducibility.
How the strategy works
Session range construction
The user selects a minutes-based timeframe, a session start time, and the number of candles N. During the session window, the strategy tracks the highest High and lowest Low formed by the first N candles. These candles are visually highlighted on the chart.
Range freeze
When candle N closes, the range is locked. Horizontal High/Low lines are drawn and extended forward. An optional 50% midpoint can be displayed for reference.
OCO breakout execution
Immediately after the range is frozen, the strategy places:
A buy stop at the frozen High
A sell stop at the frozen Low
Orders are linked using OCO (One-Cancels-Other) logic. When one side fills, the opposite order is automatically canceled.
Exit management
Two exit frameworks are available:
Tick-based exits: stop-loss and take-profit are fixed distances in ticks from entry.
Risk/Reward exits: optional stop at the opposite side of the range, with TP calculated as RR × risk.
Both modes can display SL/TP boxes projected forward for visual review.
Daily execution lock
After the first filled trade of the day, the strategy blocks any new entries until the next daily reset. This enforces strict discipline and prevents over-trading.
Visual features
Configurable High/Low lines and labels (color, style, width, alignment)
Optional midpoint (50%) line
Session background highlight with adjustable opacity
Optional SL/TP boxes with configurable colors, borders, and projection length
Weekday filter (trade only selected days)
Settings used for the published backtest (replication)
The performance screenshots included with this publication were generated using the following configuration:
Market & chart
Symbol: FX:XAUUSD
Timeframe: 15 minutes
Session & range
Session start: as configured on chart (exchange time)
Range candles (N): 1
Auto range end: enabled (TF × N)
Line extension: 20 bars
Exits
Exit mode: SL/TP by ticks
Stop-loss: 1500 ticks
Take-profit: 2000 ticks
Weekdays
Monday to Friday enabled
Strategy Properties (TradingView settings)
Initial capital: 1,000 USD
Commission: 0.1 (as set in Strategy Properties)
Slippage: 1 tick
Users should adjust commission, slippage, and position sizing to match their own broker and execution conditions.
Backtest context and limitations
This strategy uses stop orders that may fill intrabar depending on TradingView’s execution model.
Results vary by symbol, timeframe, session selection, and trading costs.
Past performance does not guarantee future results.
This script is not financial advice.
Originality and usefulness
While opening-range breakouts are a known concept, this strategy’s implementation focuses on:
Exact range-freeze timing: orders are armed precisely at the close of the N-th candle.
True OCO + hard daily lock: one-and-done execution enforced at the engine level.
Dual exit framework: fixed-tick and RR exits analyzed with the same SL/TP visual logic.
Operational safeguards: weekday filters and drawing limits designed for stable long-term backtesting.

FluxMA ProFluxMA Pro
FluxMA Pro is an intraday trend-following strategy based on moving-average cross signals , with built-in execution filters (time window + weekdays), direction control, and an optional strict one-trade-per-day rule.
The system enters when price crosses the selected moving average, and manages risk using fixed SL/TP in ticks . For clarity and auditing, it plots the MA and draws risk (SL) / reward (TP) zones on the chart.
This script is published for educational and research purposes , with documented mechanics and replication settings to support transparency and reproducibility.
How the strategy works
Signal engine (MA cross)
A base Moving Average (MA) is computed from a selectable price source.
A Long signal triggers when price crosses above the MA.
A Short signal triggers when price crosses below the MA.
Execution filters
Time filter : trades only inside the configured window (supports overnight windows correctly).
Weekday filter : enable/disable trading by day (Mon–Sun).
Direction filter : run Long only , Short only , or Both .
One trade per day (optional) : if enabled, once a trade is placed, no new trades are allowed until the next daily reset.
Risk management (ticks)
Stop-loss and take-profit are set using fixed distances in ticks from entry.
Orders are placed with a stop and a limit exit to keep execution auditable.
Visual audit layer
Plots the Moving Average on the chart.
Draws SL/TP zones as boxes that extend while the position is open.
Adds entry labels (“buy” / “sell”) for quick review in replays and optimizations.
Visual features
MA plot with selectable MA type (SMA/EMA/WMA/RMA) and length.
Risk/Reward boxes projected from entry (SL zone + TP zone).
Entry labels with configurable styling (label/flag) and colors.
Settings used for the published backtest (replication)
The performance screenshots included with this publication were generated using the following configuration:
Market & chart
Symbol : XAUUSD (FXCM feed)
Timeframe : 15 minutes
Date range : 02 Jan 2025 → 07 Nov 2025
Inputs (Strategy settings)
Source : Close
MA type : SMA
MA length : 10
Stop Loss : 1400 ticks
Take Profit : 2000 ticks
Time filter : enabled — 06:00 to 22:15 (exchange time)
Weekday filter : enabled — Monday to Sunday enabled
Direction : Long only
One trade per day : enabled
TradingView Strategy Properties used
Initial capital : 1,000 USD
Commission : 0.2 (as set in Strategy Properties)
Slippage : 1 tick
Backtest snapshot (as shown)
Net Profit : +727.41 USD (+72.74%)
Max Drawdown : 200.25 USD (12.71%)
Total Trades : 218
Win Rate : 52.29% (114 / 218)
Profit Factor : 1.485
Backtest context and limitations
Stop/limit fills may occur intrabar depending on TradingView’s execution model and bar magnifier assumptions.
Results vary by symbol, timeframe, broker feed, spreads, commissions, slippage, and session selection.
Past performance does not guarantee future results.
This script is not financial advice.
Originality and usefulness
While MA-cross strategies are a known concept, FluxMA Pro focuses on an execution-grade implementation designed for testing and disciplined deployment:
Execution guardrails : optional one-trade-per-day lock + direction filter to prevent over-trading and strategy drift.
Session handling done properly : time windows support overnight logic (no “broken window” edge cases).
MA modularity : SMA/EMA/WMA/RMA selection enables controlled experiments without rewriting logic.
Auditable visuals : SL/TP zones and labels allow fast review of behavior during replays, optimization, and multi-asset scans.

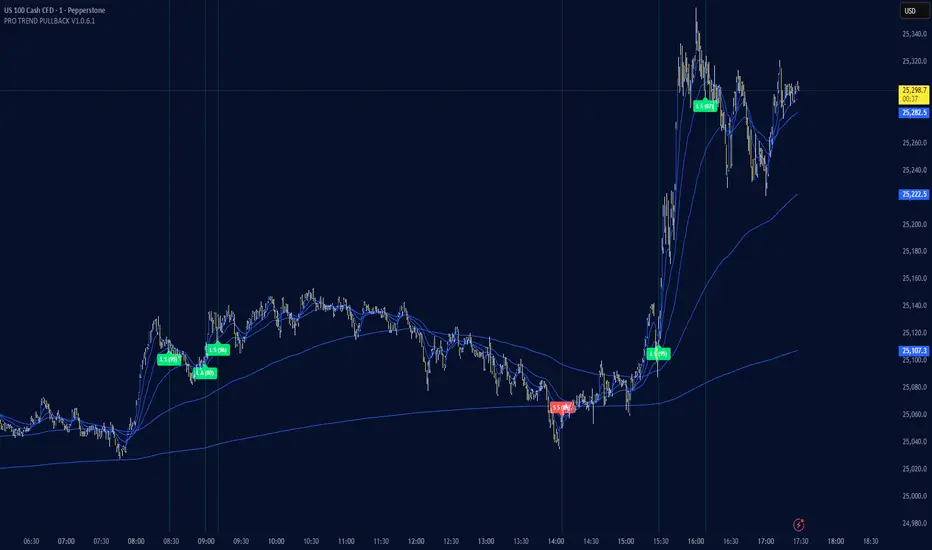
PRO TREND PULLBACK
PRO TREND PULLBACK – trend-following pullback strategy (NAS100 / US30 focus, 1m)
What is this?
- EMA-based trend + pullback entry logic, with optional VWAP and EMA-order filters.
- Built-in preset system for NAS100/US30 on the 1-minute timeframe (Safe / Balanced / Turbo), plus a fully manual “Custom” mode.
Core logic (quick overview)
1) Trend filter:
- Above EMA TREND: long bias, below: short bias
- Optional: VWAP filter, EMA order filter, HTF EMA TREND filter, Multi-EMA direction filter
2) Pullback trigger:
- Pullback level selectable: FAST / MID / SLOW EMA
- Long: touch + bullish confirmation, Short: touch + bearish confirmation (toggleable)
3) Quality filters:
- RSI zone filter (separate for long/short)
- Candle filters: doji / oversized candle / wick (pin-zone) / low-volatility block
- ADX trend-strength filter (via ta.dmi), entry cooldown (bar-based)
- Sideways/range handling: Filter / Penalty / Edge-only mode (ADX + slope + “chop” cross counter)
Risk management / trade management (backtest & automation)
- ATR-based SL/TP: SL, TP1, TP2 (TP1 partial close optional)
- Break-even trigger based on ATR (optional)
- “Max bars in trade” time-based exit (optional)
- Volatility-regime scaling: dynamic SL/TP scaling in high-volatility regimes (optional)
Signal grading (Grade / Score)
- Radar-style scoring + grade: S / A / B / C
- Structural penalties (e.g., lower low / higher high, EMA50 touch, proximity to swing high)
- Trend “fatigue” penalty (down-weights repeated same-direction signals)
- Optional “Lux SMC-lite” score layer (BOS/CHoCH + OB + EQH/EQL + Premium/Discount)
- Optional “ABC-lite (Elliott A-B-C)” score layer (pivot-based)
Alerts / Robot JSON (for webhook)
- Built-in JSON alerts via alert() with watchlist-friendly fields:
secret, strategy, signal, signal_type, symbol, timeframe, time (UTC), price, + optional grade/score
- TradingView alert setup: Condition = “Any alert() function call”
(Webhook URL + your own secret is recommended)
Important notes
- This is a STRATEGY (strategy) intended for backtesting and signal logic. Before live use, test thoroughly and account for slippage/spread differences.
- Pivot-based components (SMC-lite / ABC-lite) are naturally confirmation-based (delayed), so “structure/ABC” values do not print instantly.
- Not financial advice. Use at your own risk.
Suggested starting setup
- Presets: Auto + Balanced (NAS100/US30 1m), then fine-tune with Safe/Turbo.
- For robot mode: turn useRobotAlert=ON and change payloadSecret to a unique value.
Liquidity Sweep pro📌 Liquidity Sweep Pro – Strategy Description
Liquidity Sweep Pro is a price–action based trading strategy designed to identify liquidity grabs and smart money reversals around key swing highs and lows.
This strategy focuses on moments where price takes out resting liquidity above recent highs or below recent lows, then shows clear rejection and directional intent, which often precedes strong reversals or continuations.
🔍 Core Logic
The strategy is built on three main concepts:
1️⃣ Liquidity Sweep Detection
Identifies recent swing highs and swing lows using pivot structure
Detects when price sweeps above a high or below a low, signaling liquidity collection
2️⃣ CISD Confirmation (Change in State of Delivery)
After a liquidity sweep, the strategy waits for:
Bearish confirmation after sweeping highs
Bullish confirmation after sweeping lows
This confirmation is based on candle behavior and price closing back inside the structure, filtering out false breakouts.
3️⃣ Optional Trend Filter (Hull MA)
An optional Hull Moving Average filter can be enabled to trade:
Longs in bullish conditions
Shorts in bearish conditions
This helps reduce counter-trend trades while keeping the strategy flexible.
🎯 Risk Management
Stop Loss and Take Profit are calculated dynamically using ATR
Fully customizable Risk : Reward ratio
Designed to adapt to different market conditions and volatility levels
⚙️ Recommended Usage
Best suited for intraday and scalping trading
Works well on:
XAUUSD (Gold) – M3 / M5
Crypto – M5 / M15
Indices – M5
The strategy does not repaint and only generates signals after candle close.
⚠️ Disclaimer
This strategy is for educational and research purposes only.
Always test and optimize parameters for your specific market and timeframe before using it in live trading.

Panic Spike Reversal Strategy | KR3000Panic Spike Reversal Strategy | KR3000
This is a highly attractive yet dangerous trading tool, designed for traders who understand risk and are willing to face it.
The core idea is simple but powerful:
when the market experiences an abnormal surge or collapse within a higher timeframe, this strategy identifies those panic-driven spikes and enters against the move, aiming to capture the natural price mean reversion that often follows extreme emotional behavior.
This strategy is not designed for comfort.
It is designed for discipline, execution, and courage.
🔍 What This Strategy Does
Monitors a higher timeframe (e.g. 1H) in real time
Detects sharp upward or downward price spikes based on user-defined percentage thresholds
Automatically enters contrarian positions:
Spike up → Short
Spike down → Long
Optionally allows both directions within the same monitoring bar, selecting the stronger extreme when both occur
Executes all entries only after bar close, ensuring non-repainting behavior
Uses fixed percentage-based take profit and stop loss, fully adjustable by the user
Limits signals to one trigger per monitoring timeframe bar (optional), preventing overtrading
⚙️ Core Logic & Principles
Markets do not move in straight lines.
Extreme moves are often driven by fear, greed, and forced liquidity, not balanced price discovery.
This strategy is built on the assumption that:
Violent price expansions are statistically unstable
Panic moves frequently overextend, creating short-term opportunities in the opposite direction
However, mean reversion is not guaranteed.
This is why strict stop loss control is essential and fully configurable.
⚠️ Risk Warning
This is a contrarian strategy by nature.
It intentionally trades against strong momentum
Losses can occur quickly if the trend continues
It is not suitable for beginners
Best used by experienced traders who understand:
market structure
volatility behavior
and emotional discipline
If you are looking for safety, this strategy is not for you.
If you are looking for controlled danger with defined risk, this tool may be worth your attention.
🧠 Who This Strategy Is For
Traders who specialize in mean reversion or fade setups
Instruments with high liquidity and volatility (e.g. indices, gold, FX majors)
Users who value transparent logic, non-repainting signals, and full parameter control
Traders who accept that high reward potential comes with high psychological pressure

Ichimoku Cloud Strategy - 1H HyperliquidStategy for Hyperliquid 1hr time frame using Ichimoku's Cloud.

Heikin Ashi Color Flip StrategyManual HA calculation → no repainting
✔ Entry on first green after red
✔ Exit on first red after green
✔ process_orders_on_close = false → orders execute on next bar open
✔ Logic is clean and readable
How to make it your kind of strategy (next step)
Given your past preferences, the best upgrade is:
• Trade only when price > EMA 21
• Or only when SPY > EMA 50 & VIX < 20
• Exit on price close below EMA 21 (your preferred rule)
Consider the following to increase win rate and decrease drawdown:
• Add EMA-21 exit instead of HA red
• Add SPY/VIX regime filter
• Give you real QQQ daily backtest metrics
• Convert this into a scan/alert-only indicator
Disclaimer:
This indicator is provided for educational and informational purposes only and does not constitute financial, investment, or trading advice. The signals generated by this indicator are not guaranteed to be accurate or profitable. Past performance is not indicative of future results. Trading and investing involve substantial risk, and you should perform your own analysis and consult a qualified financial professional before making any trading decisions. The author is not responsible for any financial losses incurred from the use of this indicator.

SU Trend Filter Box-15min-SOLSU Trend Filter Box-15min-SOL,Within this strategy, you can configure various box range criteria, freely combine them, select the number of filters to activate, and it supports 12 different box filtering methods.


Supertrend + EMA + RSI Algo (Low Risk High Accuracy)This is a trend-following + momentum confirmation strategy designed to reduce false signals and control loss.
Supertrend (10,3) → Identifies overall market direction (Buy in uptrend, Sell in downtrend)
EMA 50 & EMA 200 → Confirms strong trend and avoids sideways market
Buy only when EMA 50 is above EMA 200
Sell only when EMA 50 is below EMA 200
RSI (14) → Confirms momentum
Buy when RSI > 55 (strong bullish momentum)
Sell when RSI < 45 (strong bearish momentum)
---
🔹 Entry Logic
BUY: Market is in uptrend + strong momentum
SELL: Market is in downtrend + strong bearish pressure
---
🔹 Risk Management (Most Important)
Stop Loss: Based on ATR (adapts to volatility)
Target: Fixed Risk-Reward ratio (example: 1 : 2.5)
This keeps loss small and profits larger
---
🔹 Best Use Case
Works best in trending markets
Ideal timeframes: 15m, 1h, 4h
Suitable for crypto futures & swing trading
Beginner-friendly if used with low leverage

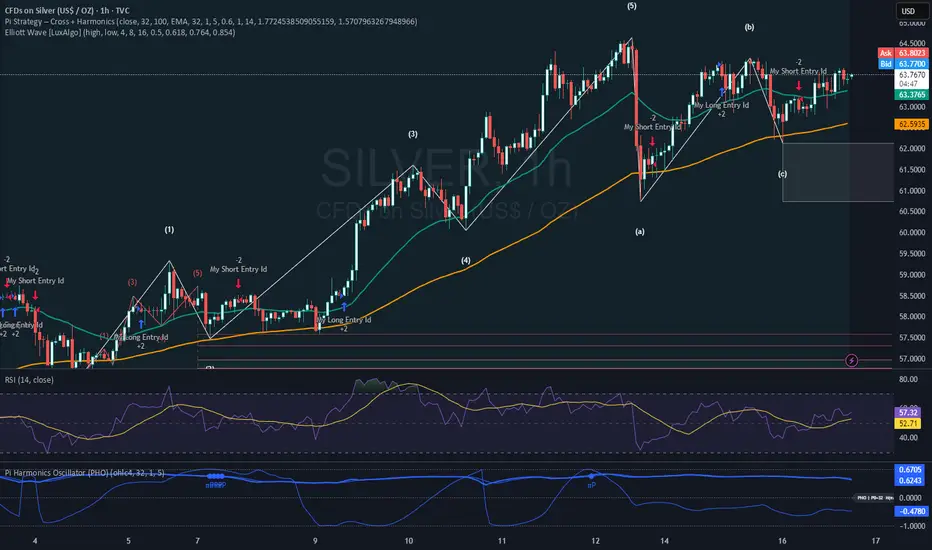
Pi Strategy Cross Harmonicsstill customizing this one, buy and sell seems to off on alternate time settings.
a work in progress, see if this works for anyone.
thanks again.
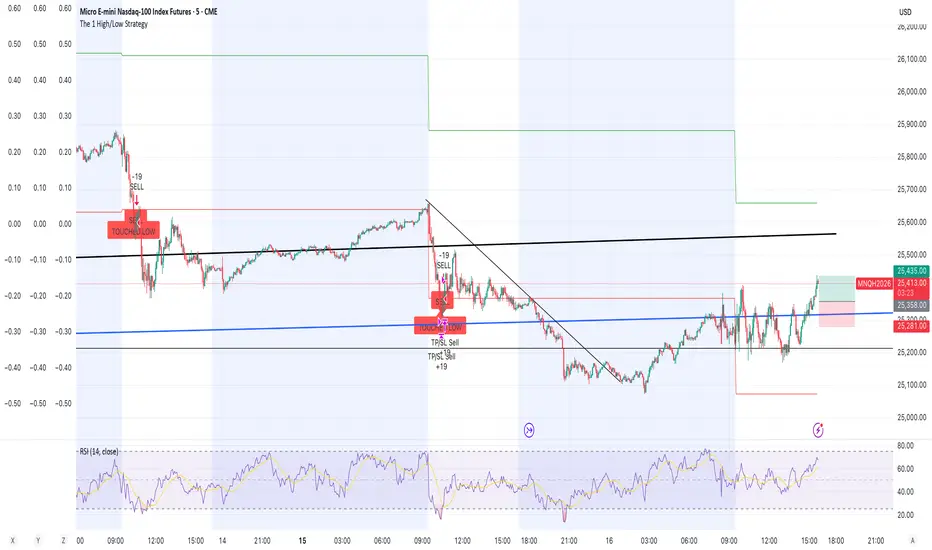
The 1 High/Low StrategyThis strategy takes advantage of price Support and Resistance at High and Low level points of the day to enter high Risk to Reward positions with a high win rate.
Relative Outperformance + EMA Trend Filter (Long Only)Relative Outperformance based on underlying and EMA based trend filtering
