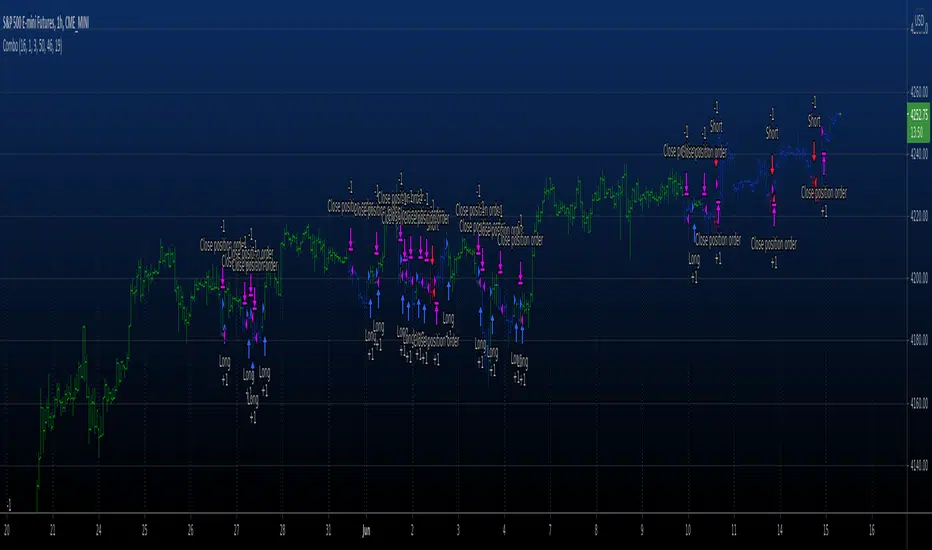
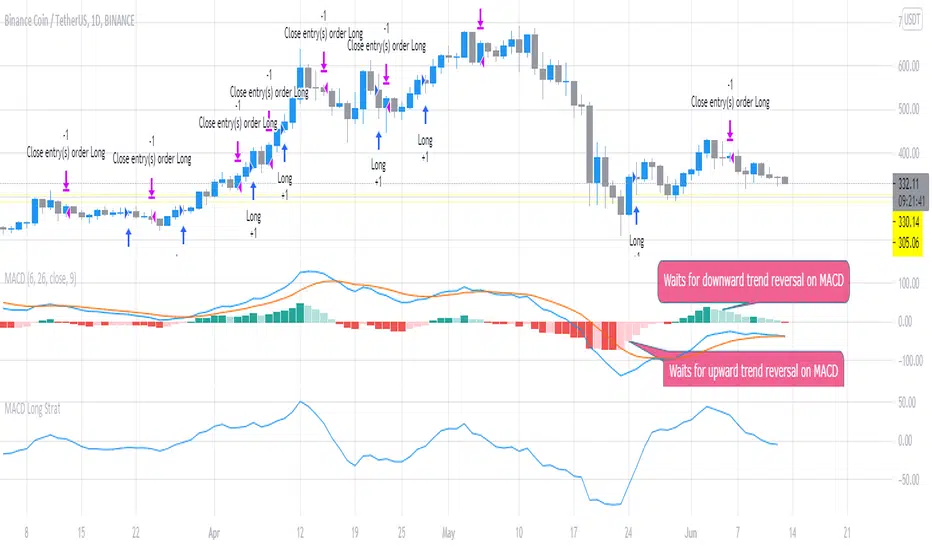
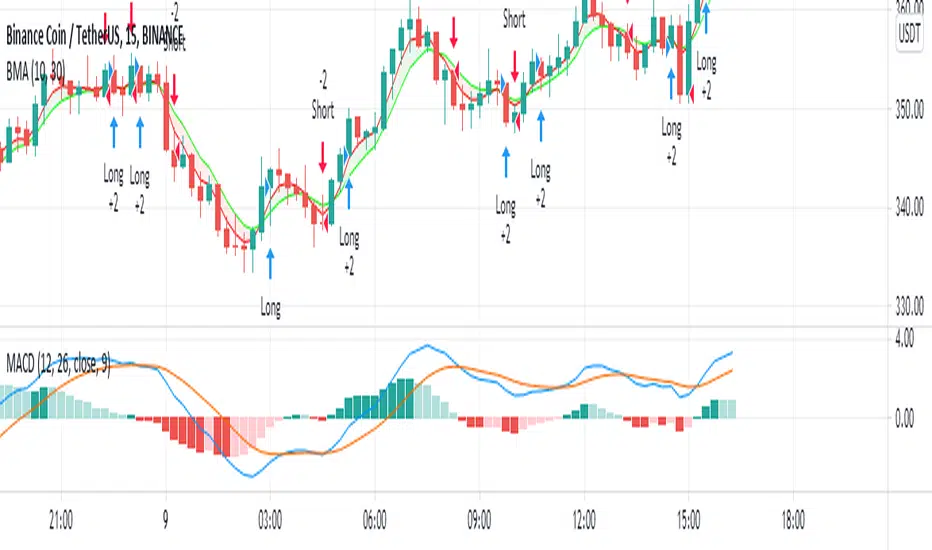
Combo Backtest 123 Reversal & Empirical Mode Decomposition This is combo strategies for get a cumulative signal.
First strategy
This System was created from the Book "How I Tripled My Money In The
Futures Market" by Ulf Jensen, Page 183. This is reverse type of strategies.
The strategy buys at market, if close price is higher than the previous close
during 2 days and the meaning of 9-days Stochastic Slow Oscillator is lower than 50.
The strategy sells at market, if close price is lower than the previous close price
during 2 days and the meaning of 9-days Stochastic Fast Oscillator is higher than 50.
Second strategy
The related article is copyrighted material from Stocks & Commodities Mar 2010
WARNING:
- For purpose educate only
- This script to change bars colors.
趋势分析
Noro's RiskTurtle StrategyThe idea of this strategy script was taken here:
(PDF-Book, English) bigpicture.typepad.com
Strategy
2 Donchian price channels are being created. Fast and slow. The number of candles for the channels is selected by the user. By default, 20 bars for fast and 50 bars for slow. Blue lines show a slow price channel . And used to enter positions. Using market stop orders. A fast price channel is needed to find out the price for stop-loss. This is the center line of the fast channel. Shown by a red line. The background shows when the positions were opened. Lime background for long positions, and red background for short positions. There is no background if there are no positions.
Risk size
Stop Placement
The Turtles placed their stops based on position risk. No trade could incur more than 2% risk.
Since 1N of price movement represented 1% of Account Equity, the maximum stop
that would allow 2% risk would be 2N of price movement. Turtle stops were set at 2N
below the entry for long positions, and 2N above the entry for short positions.
For
- XBT/USD, BTC /USD, BTC /USDT, ETH/USD, ETH/USDT, etc - need ***/(T)USD(T)
- Timeframes 1h, 2h, 3h, 4h
Noro's SimpleTurtle StrategyThis is a highly simplified version of the Turtle strategy. It is very different from the original Turtle strategy.
Lines
2 Donchian price channels are being created. Fast and slow. The number of candles for the channels is selected by the user. By default, 20 bars for fast and 50 bars for slow. Blue lines show a slow price channel. And used to enter positions. Using market stop orders. A fast price channel is needed to find out the price for stop-loss. This is the center line of the fast channel. Shown by a red line. The background shows when the positions were opened. Lime background for long positions, and red background for short positions. There is no background if there are no positions.
For
- XBT/USD, BTC/USD, BTC/USDT, ETH/USD, ETH/USDT, etc - need ***/(T)USD(T)
- Timeframes 1h, 2h, 3h, 4h
Simple SMA Strategy BacktestAdded strategy logic.
Part 3:
www.tradingview.com
Part 2:
www.tradingview.com
Part 1:
Simple SMA Indicator
www.tradingview.com
WARNING:
- For purpose educate only
sa-strategy with HTF-TSLEntry- based on HA close above HMA confirmation done with ST and HTF ATR
Exit- based on close below ATR which works as trailing SL
Noro's Turtles StrategyOriginal idea from book «Way of the Turtle: The Secret Methods that Turned Ordinary People into Legendary Traders» (2007, CURTIS FAITH, ISBN: 9780071486644)
Strategy
2 positions types are used. Fast and slow. The period for fast and slow user specifies separately. For example for quick: if the price is higher than the highest price in the last 10 candles, then open a long position using a stop order. If the price is below the lowest price in the last 20 candles, then close the long position. In the same way for a short position and also for slow positions.
Combo Backtest 123 Reversal & EMA & MA Crossover This is combo strategies for get a cumulative signal.
First strategy
This System was created from the Book "How I Tripled My Money In The
Futures Market" by Ulf Jensen, Page 183. This is reverse type of strategies.
The strategy buys at market, if close price is higher than the previous close
during 2 days and the meaning of 9-days Stochastic Slow Oscillator is lower than 50.
The strategy sells at market, if close price is lower than the previous close price
during 2 days and the meaning of 9-days Stochastic Fast Oscillator is higher than 50.
Second strategy
The Moving Average Crossover trading strategy is possibly the most popular
trading strategy in the world of trading. First of them were written in the
middle of XX century, when commodities trading strategies became popular.
This strategy is a good example of so-called traditional strategies.
Traditional strategies are always long or short. That means they are never
out of the market. The concept of having a strategy that is always long or
short may be scary, particularly in today’s market where you don’t know what
is going to happen as far as risk on any one market. But a lot of traders
believe that the concept is still valid, especially for those of traders who
do their own research or their own discretionary trading.
This version uses crossover of moving average and its exponential moving average.
WARNING:
- For purpose educate only
- This script to change bars colors.
[LunaOwl] Support Resistance Strategy V4作品: 支撐壓力策略
A simple Support Resistance Breakthrough Strategy, the only difference is that it is PineScript @version=4. interested parties can use it as a reference.
Its logic is simple, wish your all the best.
一個簡單的支撐阻力突破策略,唯一的差異,在於它是PineScript第四版。有興趣的可以拿來當作參考,簡易的指標。祝你們順心。
Support level refers to the support price that the exchange rate may encounter when it falls, so as to stop falling and stabilize the price.
The corresponding concept is the resistance level, that is, the pressure that the exchange rate may encounter when it rises, thus reversing to a falling price.
支撐位是指匯價在下跌時可能遇到的支撐價格,從而止跌回穩的價格,對應的概念是阻力位,也即匯價上漲時可能遇到的壓力,從而反轉為下跌的價格。
Ichimoku Kinko Hyo StrategyStrategy based on the Ishimoku Kinko Hyo system, using the different indicators it provides to build signals.
This strategy could be better as it should ideally use the position of the price line compared to Chikou to determine if signals should be looked for, but I've been unable to fully implement this so far (an imperfect implementation is provided, but disable by default). I'll update the script once I figure it out, but it still gives good results without this.
EMA Slope Cross Trend Follower StrategyThis strategy uses the cross of the slopes of two EMAs having different lengths to generate trend follower signals. By default, I use 130 and 400, which behave very well.
The conditions which make the strat enter the market are:
- Fast Slope > Slow Slope and price > EMA 200 : go Long
- Fast Slope < Slow Slope and price < EMA200 : go Short
The simple slopes cross in the opposite direction, closes the position.
The strategy performs best on Bitcoin and the most liquid and capitalized Altcoins, but works greatly on volatile assets as well, in particular if they often go trending.
Works best on 4h time frame.
There's also an optional Volatility filter, which opens the position only if the difference between the two slopes is more than a specific value, which can be set in the strategy inputs. The purpose is not opening positions if price is going sideways and the noise is way > than the signal.
Enjoy it!
Combo Backtest 123 Reversal & Elder Ray (Bull Power) This is combo strategies for get a cumulative signal.
First strategy
This System was created from the Book "How I Tripled My Money In The
Futures Market" by Ulf Jensen, Page 183. This is reverse type of strategies.
The strategy buys at market, if close price is higher than the previous close
during 2 days and the meaning of 9-days Stochastic Slow Oscillator is lower than 50.
The strategy sells at market, if close price is lower than the previous close price
during 2 days and the meaning of 9-days Stochastic Fast Oscillator is higher than 50.
Second strategy
Developed by Dr Alexander Elder, the Elder-ray indicator measures buying
and selling pressure in the market. The Elder-ray is often used as part
of the Triple Screen trading system but may also be used on its own.
Dr Elder uses a 13-day exponential moving average (EMA) to indicate the
market consensus of value. Bull Power measures the ability of buyers to
drive prices above the consensus of value. Bear Power reflects the ability
of sellers to drive prices below the average consensus of value.
Bull Power is calculated by subtracting the 13-day EMA from the day's High.
Bear power subtracts the 13-day EMA from the day's Low.
You can use in the xPrice any series: Open, High, Low, Close, HL2, HLC3, OHLC4 and ect...
WARNING:
- For purpose educate only
- This script to change bars colors.
Tan_Aug09Crypto pairs: ETH/USDT
Time-frame: D1
Based on Heikin Ashi Candle and Exponential Moving Average Indicators
Crypto pick: 5D
Stock pick: 8D
Best work in strong trend.
Recommend using with trend line .
Pivot Point V2 Backtest Pivot points simply took the high, low, and closing price from the previous period and
divided by 3 to find the pivot. From this pivot, traders would then base their
calculations for three support, and three resistance levels. The calculation for the most
basic flavor of pivot points, known as ‘floor-trader pivots’, along with their support and
resistance levels.
WARNING:
- For purpose educate only
- This script to change bars colors.
Breakout Trend Follower StrategyThis strategy goes long when highs are broken and uses a trailing stop that follows swing lows. User can configure a back test date range and choose whether or not to only take trades above a selected moving average.
The desire for me to make this script was to try to capture those extreme breakouts that can occur after a consolidation/equilibrium pattern. This catches those using stop-buys as the entry. Out of all the scripts I have made thus far, this one is the one that has the best results. Time frames might vary due to commission structures, etc. I currently use this strategy on stocks on the 30-min time frame and crypto (with Coinbase's high fees) on the 2-hr time frame.
ADX | DMI Trend StrategyThis strategy takes the ADX Indicator I wrote and applies it to a strategy for back testing purposes.
I've also applied a date filter so you can back test specific date ranges and a moving average filter so you can choose whether to filter your longs/shorts based on a moving average.
WOMBO COMBO: EMA & VWAP & MACD & BB & STCHello my fellow investors,
After hours of reading, backtesting, and YouTube video watching I discovered that EMA, VWAP, BB, MACD, and STC produce the most consistent results for investment planning. This strategy allows you to pick between the aforementioned indicators or layer them together.
It works on the pricipal of:
1) Always follow the market trend - buy/sell above/below 200EMA
2) Follow corporate investing trends - buy/sell above/below VWAP
3) Apply MACD check - buy--> MACD line above signal line and corssover below histogram \\ sell --> MACD line below signal line and crossover above histogram.
4) Check volitility with price against BB limits upper/Sell or lower/buy
5) When STC crosses about 10 buy and when it drops below 90 sell
6) Exit position when stop loss is triggered or profit target is hit. BB also provides a parameter to exit positions.
This code is the product of many hours of hard work on the part of the greater tradingview community. The credit goes to everyone in the community who has put code out there for the greater good.
MACD Cross+MAStrategy MACD cross + Ma cross
การเข้าจะเข้าต่อเมื่อมีการ Cross ของ MACD ก่อน แล้วมีการ Cross ของเส้น ma 9,26 ตามมา
จากการ Backtest ของผมถือว่าเป้น Indicator ที่ค่อนข้างบอกให้เข้าช้าเลยทีเดียว แต่ใช้ Follow เทรนพอใช้ได้อยู่ครับ
แนะนำให้ใช้ในช่วงที่ตลาดเป็นขาขึ้นนะครับ ช่วงหมียาวอย่างปี 2018 Indicator ตั้วนี้ไม่เวิร์คอย่างแรงเลยครับ
ในภาพ backtest ตั้งแต่ปี 2019 - ปัจจุบันนะครับ
ใช้ใน TF Day จะเห็นผลดีที่สุด
Trend Reversal / Potential pressureThis strategy looks for potential trend reversals by looking at hammer candles (defined in the is_hammer and is_stick functions). After getting confirmation a trade is open with determined SL/TP. ATR is used to justify the volatility. Fine-tune the parameters for your specific use case.
RSI W Pattern strategyThis strategy is similar to RSI V pattern strategy, but it looks for W pattern in RSI chart.
RULES
======
BUY
1. ema20 is above ema50
2. RSI5 crossing up 30 from oversold area
3. and RSI5 must be below overbought area (default value set to 65)
Add to existing Position
1. You can add on the next W pattern OR
2. if RSI5 is crossing up from below 20
Exit
1. when RSI5 reaches 75
Note: This is for short term/swing trading . which gets on when price dip in trending and quickly gets you out on RSI overbought area
cATRpillar Strategy**This is my first strategy on the Pine editor, any tips or tricks from the community would be awesome!
This strategy was developed from my indicator "cATRpillar". it uses the ATR range values to determine entry, and uses EMA values to determine an exit if the market goes against it.
Highest High and Lowest Low Channel StrategyHighest / Highest High Highest (Data) - HHV (Data, Period)
Lowest / Lowest Low Lowest (Data) LLV (Data, Period)
These functions calculate the highest / lowest value of a selected data.
Highest High and Lowest Low options are mostly used.
The Highest function calculates the highest value of the selected data in the past.
The Lowest function calculates the lowest value of the selected data in the past.
RSI Divergence X Ichimoku Cloud X 200EMAHi all,
This script is a combination of the RSI Divergence Strategy combined with Ichimoku Cloud and 200 EMA .
A long position is entered only when the RSI identifies a bullish divergence (either regular or hidden), and that the Ichimoku Cloud is above the 200 EMA . This is to ensure that there is a confirmation of a bullish trend before an entry.
Similarly, a short position is entered only when the RSI identified a bearish divergence (either regular or hidden), and that the Ichimoku Cloud is below the 200 EMA . This is to ensure that there is a confirmation of a bearish trend before an entry.
I find that this script works best on Intraday charts.
This is just a simple script I built on my third attempt of backtesting strategies on TradingView. Do give it a go and let me know if you guys have any feedback or comments about it. Happy trading!