Regime Filter [BigBeluga]🔵 OVERVIEW
Regime Filter is a dual-factor trend condition tool combining price trend momentum and volume expansion into a single, easy-to-read visual framework. It quantifies recent trend direction and volume shifts, then shows them as:
Two oscillator plots for Trend and Volume regimes
Dynamic candle coloring for trend clarity
A quadrant scatter map in your chart corner for immediate regime recognition.
This filter helps traders quickly detect when a trend is healthy & confirmed by strong volume, or weakening & vulnerable due to low volume.
🔵 CONCEPTS
Trend Oscillator: A loop-based trend value calculated by comparing the current smoothed price (HMA of HLC3) against its own trailing history. Positive values indicate trend-up regimes, negative values signal trend-down phases.
Volume Oscillator: Similar loop logic but on smoothed volume (HMA of Volume) — highlighting whether trading activity is expanding or contracting relative to past bars.
hma = ta.hma(hlc3, 15)
vol = ta.hma(volume, 15)
for i = 0 to len
if hma > hma
trend += 1
else
trend -= 1
for i = 0 to len
if vol > vol
voltrend += 1
else
voltrend -= 1
Regime Map Scatter Plot: A unique 2D quadrant displayed in the bottom-right corner. This shows where the market is sitting:
> Top Right (green): Trend ↑ and Volume ↑ → strong confirmed up trend.
> Top Left (red): Trend ↓ but Volume ↑ → strong sell momentum.
> Bottom Right (blue): Trend ↑ but Volume ↓ → uptrend losing steam.
> Bottom Left (yellow): Trend ↓ and Volume ↓ → weak bearish drift.
Dynamic Candle Coloring: Candles are colored by trend only: green for uptrends, red for downtrends, and orange near reversals.
Threshold Fills: The oscillator region is shaded green above +10 (healthy uptrend) and red below -10 (strong downtrend) for instant confidence.
🔵 FEATURES
Normalized trend and volume values adapt automatically to your lookback length.
Candlestick color overrides highlight current trend state in real-time.
Clear zero-line and fill bands help you gauge strength vs. noise.
Scatter regime dashboard updates live to track when trend and volume align or decouple.
Color gradients show intensification or cooling in both oscillators and the regime map.
🔵 HOW TO USE
Look for sustained positive trend and volume values to confirm strong directional moves.
Watch for the scatter dot in the green square (top right) for high-confidence breakouts.
If the dot drops to bottom right, uptrend may be tiring — possible exit zone.
If the dot jumps top left, bearish drive is reinforced by heavy volume — caution on longs.
Use the orange trend coloring as an early warning that trend pressure may be shifting.
Combine with breakout levels or moving averages for a robust regime filter system.
🔵 CONCLUSION
The Regime Filter distills price trend and volume dynamics into an actionable multi-mode display: oscillators, color-coded candles, and an intuitive scatter map. This all-in-one layout helps traders visually read market regime strength and spot fading trends before they turn — perfect for swing traders, intraday scalpers, and macro trend followers alike.
Trendvolume

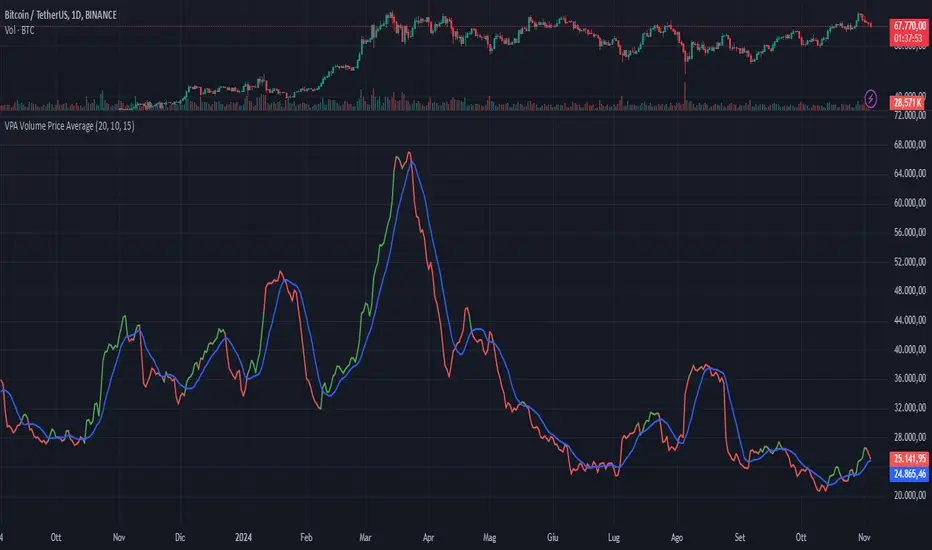
VPA Volume Price AverageDescription:
This indicator displays a moving average of volume and its signal line in a separate pane, with conditional highlighting to help interpret buyer and seller pressure. It’s based on two main lines:
Volume Moving Average (red line) : represents the average volume calculated over a configurable number of periods.
Signal Line of the Volume Moving Average (blue line): this is an average of the volume moving average itself, used as a reference for volume trends.
Key Features
Volume Moving Average with Conditional Highlighting:
The volume moving average is plotted as a red line and changes color based on two specific conditions:
The closing price is above its moving average, calculated over a configurable number of periods, indicating a bullish trend.
The volume moving average is greater than the signal line, suggesting an increase in buyer pressure.
When both conditions are met, the volume moving average turns green. If one or both conditions are not met, the line remains red.
Signal Line of the Volume Moving Average:
The signal line is plotted in blue and represents a smoothed version of the volume moving average, useful for identifying long-term volume trends and as a reference for the highlighting condition.
Customizable Periods
The indicator allows you to set the periods for each average to adapt to different timeframes and desired sensitivity:
Period for calculating the volume moving average.
Period for calculating the signal line of the volume moving average.
Period for the price moving average (used in the highlighting condition).
How to Use
This indicator is especially useful for monitoring volume dynamics in detail, with a visual system that highlights conditions of increasing buyer strength when the price is in an uptrend. The green highlight on the volume moving average provides an intuitive signal for identifying potential moments of buyer support.
Try it to gain a clearer and more focused view of volume behavior relative to price movement!
Zig-Zag Volume Profile (Bull vs. Bear) [Kioseff Trading]Hello!
Thank you @Pinecoders and @TradingView for putting polylines in production and making this viable!!
This script "Zig Zag Volume Profile" implements the polyline feature for Pine Script!
Features
Volume Profile anchored to zig zag trends
Bull vs Bear profiles!
Delta x price level
Standard POC and value area lines, in addition to separated POCs and value area lines for bull profiles and bear profiles
Up to 9999 profile rows per zigzag trend
Stylistic options for profiles
Configurable zig zag - profiles generated for small to large trends
Polylines!
This script generates Bull vs. Bear volume profiles for zig zag trends!
The zigzag indicator is configurable as normal; minor and major trend volume profiles are calculable. This indicator can be thought of as "Volume Profile/Delta for Trends''.
Up to 9999 volume profile levels (price levels) can be calculated for each profile, thanks to the new polyline feature, allowing for less aggregation / more precision of volume at price and volume delta.
Zig Zag Bull Vs Bear Profiles
The image above shows primary functionality!
Green profiles = buying volume
Red profiles = selling volume
Profiles are generated for each trend identified by the zigzag indicator.
The image above shows the indicator calculating volume delta for specific price blocks on the profile. Aggregate volume delta for the identified trend is displayed over the profile!
The image above shows Bull Profile POC lines and value area lines. Bear Profile POC lines and value area lines are also shown!
All colors and transparencies are configurable to the user's liking :D
Additionally, you can select to have the profiles drawn on contrasting sides. Bull Profile on left and Bear Profile on right.
For a more traditional look - you can select to draw the Bull & Bear profiles on the same x-point.
The indicator is robust enough to calculate on "long zig zags" and "short zig zags"; curved profiles can also be used!
The image above exemplifies usage of the indicator!
Bull & Bear volume profiles are calculated for trends on the 30-second timeframe.
The image above shows a more "utilitarian" presentation of the profiles. Once more, line and linefill colors/transparencies are all customizable; the indicator can look however you would like it to!
The image above shows key levels, the Bull vs. Bear profile, and volume delta for the current trend!
That's about it :D
This indicator is part of a series titled "Bull vs. Bear" - a suite of profile-like indicators I will be releasing over coming days. Thanks for checking this out!
Of course, a big thank you to @RicardoSantos for his MathOperator library that I use in every script.
If you have any suggestions please feel free to share!
