ATR with MAOVERVIEW
The Average True Range Moving Average (ATRMA) is a technical indicator that gauges the amount of volatility currently present in the market, relative to the historical average volatility that was present before. It adds a moving average to the Average True Range (ATR) indicator.
This indicator is extremely similar to the VOXI indicator, but instead of measuring volume, it measures volatility. Volume measures the amount of shares/lots/units/contracts exchanged per unit of time. Volatility, on the other hand, measures the range of price movement per unit of time.
The purpose of this indicator is to help traders filter between non-volatile periods in the market from volatile periods in the market without introducing subjectivity. It can also help long-term investors to determine market regime using volatility without introducing subjectivity.
CONCEPTS
This indicator assumes that trends are more likely to start during periods of high volatility, and consolidation is more likely to persist during periods of low volatility. The indicator also assumes that the average true range (ATR) of the last 14 candles is reflective of the current volatility in the market. ATR is the average height of all the candles, where height = |high - low|.
Suppose the ATR of the last 14 candles is greater than a moving average of the ATR(14) of the last 20 candles (this occurs whenever the indicator's filled region is colored BLUE). In that case, we can assume that the current volatility in the market is high.
Suppose the ATR of the last 14 candles is less than the moving average of the ATR(14) of the last 20 candles (this occurs whenever the indicator's filled region is colored RED). In that case, we can assume that the current volatility in the market is low.
HOW DO I READ THIS INDICATOR?
If the ATR line is above the ATR MA line (indicated by the blue color), the current volatility is greater than the historical average volatility.
If the ATR line is above the ATR MA line (indicated by the red color), the current volatility is less than the historical average volatility.
Volatilityindex

Dynamic ADX - [The Pine Guru]Dynamic ADX by The Pine Guru
What is the Dynamic ADX?
The Dynamic ADX is an indicator created using the regular ADX, Line, and additional ADX Moving Average. This MA allows the script to calculate the ADX differently to the original ADX, providing greater input and accessibility to the user. As the ADX is a volatility indicator, it is communicates to trend strength in the markets. The Dynamic ADX displays these trending Periods through user controlled visualizers like Fills, Background Color, and Bar Color.
How do I use the Dynamic ADX?
This indicator has 4 different "versions" or "conditions" in which it displays trend strength. These are achieved by checking and unchecking ADX, ADX MA and Line. Different combinations of these 3 inputs will result in a change of true condition that the script outputs.
Dynamic ADX Achieved by checking the ADX and ADX MA, results in an ADX similar to an MA Crossover, with the ADX being over the MA indicating a true or strong trend condition.
Regular ADX Achieved by Checking the ADX and Line. Results in the regular calculation of the ADX.
Mixture Achieved by Checking all three sections, which results in the calculation a normal ADX as well as the MA. Provides and extra condition or confluence into the ADX.
MA and Line Achieved by checking the ADX MA and Line. Results in a similar calculation to an original ADX but with a smoother MA.
Recommendations
This indicator will work typically in all markets with high volume and volatility. It is recommended that it is used as a confluence in a trading system, and not as an outright indicator. As always do your own testing before live use with this indicator. Do your own Research and refinements.
Please Leave a like if you enjoy this Indicator

LS Volatility Index█ OVERVIEW
This indicator serves to measure the volatility of the price in relation to the average.
It serves four purposes:
1. Identify abnormal prices, extremely stretched in relation to an average;
2. Identify acceptable prices in the context of the main trend;
3. Identify market crashes;
4. Identify divergences.
█ CONCEPTS
The LS Volatility Index was originally described by Brazilian traders Alexandre Wolwacz (Stormer) , Fabrício Lorenz , and Fábio Figueiredo (Vlad)
Basically, this indicator can be used in two ways:
1. In a mean reversion strategy , when there is an unusual distance from it;
2. In a trend following strategy , when the price is in an acceptable region.
Perhaps the version presented here may have some slight differences, but the core is the same.
The original indicator is presented with a 21-period moving average, but here this value is customizable.
I made some fine tuning available, namely:
1. The possibility of smoothing the indicator;
2. Choose the type of moving average;
3. Customizable period;
4. Possibility to show a moving average of the indicator;
5. Color customization.
█ CALCULATION
First, the distance of the price from a given average in percentage terms is measured.
Then, the historical average volatility is obtained.
Finally the indicator is calculated through the ratio between the distance and the historical volatility.
To facilitate visualization, the result is normalized in a range from 0 to 100.
When it reaches 0, it means the price is on average.
When it hits 100, it means the price is way off average (stretched).
█ HOW TO USE IT
Here are some examples:
1. In a return-to-average strategy
2. In a trend following strategy
3. Identification of crashes and divergences
█ THANKS AND CREDITS
- Alexandre Wolwacz (Stormer), Fabrício Lorenz, Fábio Figueiredo (Vlad)
- Feature scaler (for normalization)
- HPotter (for calc of Historical Volatility)

VIX Volatility Trend Analysis With Signals - Stocks OnlyVIX VOLATILITY TREND ANALYSIS CLOUD WITH BULLISH & BEARISH SIGNALS - STOCKS ONLY
This indicator is a visual aid that shows you the bullish or bearish trend of VIX market volatility so you can see the VIX trend without switching charts. When volatility goes up, most stocks go down and vice versa. When the cloud turns green, it is a bullish sign. When the cloud turns red, it is a bearish sign.
This indicator is meant for stocks with a lot of price action and volatility, so for best results, use it on charts that move similar to the S&P 500 or other similar charts.
This indicator uses real time data from the stock market overall, so it should only be used on stocks and will only give a few signals during after hours. It does work ok for crypto, but will not give signals when the US stock market is closed.
**HOW TO USE**
When the VIX Volatility Index trend changes direction, it will give a green or red line on the chart depending on which way the VIX is now trending. The cloud will also change color depending on which way the VIX is trending. Use this to determine overall market volatility and place trades in the direction that the indicator is showing. Do not use this by itself as sometimes markets won’t react perfectly to the overall market volatility. It should only be used as a secondary confirmation in your trading/trend analysis.
For more signals with earlier entries, go into settings and reduce the number. 10-100 is best for scalping. For less signals with later entries, change the number to a higher value. Use 100-500 for swing trades. Can go higher for long swing trades. Our favorite settings are 20, 60, 100, 500 and 1000.
***MARKETS***
This indicator should only be used on the US stock markets as signals are given based on the VIX volatility index which measures volatility of the US Stock Markets.
***TIMEFRAMES***
This indicator works on all time frames, but after hours will not change much at all due to the markets being closed.
**INVERSE CHARTS**
If you are using this on an inverse ETF and the signals are showing backwards, please comment with what chart it is and I will configure the indicator to give the correct signals. I have included over 50 inverse ETFs into the code to show the correct signals on inverse charts, but I'm sure there are some that I have missed so feel free to let me know and I will update the script with the requested tickers.
***TIPS***
Try using numerous indicators of ours on your chart so you can instantly see the bullish or bearish trend of multiple indicators in real time without having to analyze the data. Some of our favorites are our Auto Fibonacci, Directional Movement Index, Volume Profile with buy & sell pressure, Auto Support And Resistance, Vix Scalper and Money Flow Index in combination with this Vix Trend Analysis. They all have real time Bullish and Bearish labels as well so you can immediately understand each indicator's trend.

Volatility Risk Premium GOLD & SILVER 1.0ENGLISH
This indicator (V-R-P) calculates the (one month) Volatility Risk Premium for GOLD and SILVER.
V-R-P is the premium hedgers pay for over Realized Volatility for GOLD and SILVER options.
The premium stems from hedgers paying to insure their portfolios, and manifests itself in the differential between the price at which options are sold (Implied Volatility) and the volatility GOLD and SILVER ultimately realize (Realized Volatility).
I am using 30-day Implied Volatility (IV) and 21-day Realized Volatility (HV) as the basis for my calculation, as one month of IV is based on 30 calendaristic days and one month of HV is based on 21 trading days.
At first, the indicator appears blank and a label instructs you to choose which index you want the V-R-P to plot on the chart. Use the indicator settings (the sprocket) to choose one of the precious metals (or both).
Together with the V-R-P line, the indicator will show its one year moving average within a range of +/- 15% (which you can change) for benchmarking purposes. We should consider this range the “normalized” V-R-P for the actual period.
The Zero Line is also marked on the indicator.
Interpretation
When V-R-P is within the “normalized” range, … well... volatility and uncertainty, as it’s seen by the option market, is “normal”. We have a “premium” of volatility which should be considered normal.
When V-R-P is above the “normalized” range, the volatility premium is high. This means that investors are willing to pay more for options because they see an increasing uncertainty in markets.
When V-R-P is below the “normalized” range but positive (above the Zero line), the premium investors are willing to pay for risk is low, meaning they see decreasing uncertainty and risks in the market, but not by much.
When V-R-P is negative (below the Zero line), we have COMPLACENCY. This means investors see upcoming risk as being lower than what happened in the market in the recent past (within the last 30 days).
CONCEPTS :
Volatility Risk Premium
The volatility risk premium (V-R-P) is the notion that implied volatility (IV) tends to be higher than realized volatility (HV) as market participants tend to overestimate the likelihood of a significant market crash.
This overestimation may account for an increase in demand for options as protection against an equity portfolio. Basically, this heightened perception of risk may lead to a higher willingness to pay for these options to hedge a portfolio.
In other words, investors are willing to pay a premium for options to have protection against significant market crashes even if statistically the probability of these crashes is lesser or even negligible.
Therefore, the tendency of implied volatility is to be higher than realized volatility, thus V-R-P being positive.
Realized/Historical Volatility
Historical Volatility (HV) is the statistical measure of the dispersion of returns for an index over a given period of time.
Historical volatility is a well-known concept in finance, but there is confusion in how exactly it is calculated. Different sources may use slightly different historical volatility formulas.
For calculating Historical Volatility I am using the most common approach: annualized standard deviation of logarithmic returns, based on daily closing prices.
Implied Volatility
Implied Volatility (IV) is the market's forecast of a likely movement in the price of the index and it is expressed annualized, using percentages and standard deviations over a specified time horizon (usually 30 days).
IV is used to price options contracts where high implied volatility results in options with higher premiums and vice versa. Also, options supply and demand and time value are major determining factors for calculating Implied Volatility.
Implied Volatility usually increases in bearish markets and decreases when the market is bullish.
For determining GOLD and SILVER implied volatility I used their volatility indices: GVZ and VXSLV (30-day IV) provided by CBOE.
Warning
Please be aware that because CBOE doesn’t provide real-time data in Tradingview, my V-R-P calculation is also delayed, so you shouldn’t use it in the first 15 minutes after the opening.
This indicator is calibrated for a daily time frame.
----------------------------------------------------------------------
ESPAŇOL
Este indicador (V-R-P) calcula la Prima de Riesgo de Volatilidad (de un mes) para GOLD y SILVER.
V-R-P es la prima que pagan los hedgers sobre la Volatilidad Realizada para las opciones de GOLD y SILVER.
La prima proviene de los hedgers que pagan para asegurar sus carteras y se manifiesta en el diferencial entre el precio al que se venden las opciones (Volatilidad Implícita) y la volatilidad que finalmente se realiza en el ORO y la PLATA (Volatilidad Realizada).
Estoy utilizando la Volatilidad Implícita (IV) de 30 días y la Volatilidad Realizada (HV) de 21 días como base para mi cálculo, ya que un mes de IV se basa en 30 días calendario y un mes de HV se basa en 21 días de negociación.
Al principio, el indicador aparece en blanco y una etiqueta le indica que elija qué índice desea que el V-R-P represente en el gráfico. Use la configuración del indicador (la rueda dentada) para elegir uno de los metales preciosos (o ambos).
Junto con la línea V-R-P, el indicador mostrará su promedio móvil de un año dentro de un rango de +/- 15% (que puede cambiar) con fines de evaluación comparativa. Deberíamos considerar este rango como el V-R-P "normalizado" para el período real.
La línea Cero también está marcada en el indicador.
Interpretación
Cuando el V-R-P está dentro del rango "normalizado",... bueno... la volatilidad y la incertidumbre, como las ve el mercado de opciones, es "normal". Tenemos una “prima” de volatilidad que debería considerarse normal.
Cuando V-R-P está por encima del rango "normalizado", la prima de volatilidad es alta. Esto significa que los inversores están dispuestos a pagar más por las opciones porque ven una creciente incertidumbre en los mercados.
Cuando el V-R-P está por debajo del rango "normalizado" pero es positivo (por encima de la línea Cero), la prima que los inversores están dispuestos a pagar por el riesgo es baja, lo que significa que ven una disminución, pero no pronunciada, de la incertidumbre y los riesgos en el mercado.
Cuando V-R-P es negativo (por debajo de la línea Cero), tenemos COMPLACENCIA. Esto significa que los inversores ven el riesgo próximo como menor que lo que sucedió en el mercado en el pasado reciente (en los últimos 30 días).
CONCEPTOS :
Prima de Riesgo de Volatilidad
La Prima de Riesgo de Volatilidad (V-R-P) es la noción de que la Volatilidad Implícita (IV) tiende a ser más alta que la Volatilidad Realizada (HV) ya que los participantes del mercado tienden a sobrestimar la probabilidad de una caída significativa del mercado.
Esta sobreestimación puede explicar un aumento en la demanda de opciones como protección contra una cartera de acciones. Básicamente, esta mayor percepción de riesgo puede conducir a una mayor disposición a pagar por estas opciones para cubrir una cartera.
En otras palabras, los inversores están dispuestos a pagar una prima por las opciones para tener protección contra caídas significativas del mercado, incluso si estadísticamente la probabilidad de estas caídas es menor o insignificante.
Por lo tanto, la tendencia de la Volatilidad Implícita es de ser mayor que la Volatilidad Realizada, por lo cual el V-R-P es positivo.
Volatilidad Realizada/Histórica
La Volatilidad Histórica (HV) es la medida estadística de la dispersión de los rendimientos de un índice durante un período de tiempo determinado.
La Volatilidad Histórica es un concepto bien conocido en finanzas, pero existe confusión sobre cómo se calcula exactamente. Varias fuentes pueden usar fórmulas de Volatilidad Histórica ligeramente diferentes.
Para calcular la Volatilidad Histórica, utilicé el enfoque más común: desviación estándar anualizada de rendimientos logarítmicos, basada en los precios de cierre diarios.
Volatilidad Implícita
La Volatilidad Implícita (IV) es la previsión del mercado de un posible movimiento en el precio del índice y se expresa anualizada, utilizando porcentajes y desviaciones estándar en un horizonte de tiempo específico (generalmente 30 días).
IV se utiliza para cotizar contratos de opciones donde la alta Volatilidad Implícita da como resultado opciones con primas más altas y viceversa. Además, la oferta y la demanda de opciones y el valor temporal son factores determinantes importantes para calcular la Volatilidad Implícita.
La Volatilidad Implícita generalmente aumenta en los mercados bajistas y disminuye cuando el mercado es alcista.
Para determinar la Volatilidad Implícita de GOLD y SILVER utilicé sus índices de volatilidad: GVZ y VXSLV (30 días IV) proporcionados por CBOE.
Precaución
Tenga en cuenta que debido a que CBOE no proporciona datos en tiempo real en Tradingview, mi cálculo de V-R-P también se retrasa, y por este motivo no se recomienda usar en los primeros 15 minutos desde la apertura.
Este indicador está calibrado para un marco de tiempo diario.

Volatility Risk Premium (VRP) 1.0ENGLISH
This indicator (V-R-P) calculates the (one month) Volatility Risk Premium for S&P500 and Nasdaq-100.
V-R-P is the premium hedgers pay for over Realized Volatility for S&P500 and Nasdaq-100 index options.
The premium stems from hedgers paying to insure their portfolios, and manifests itself in the differential between the price at which options are sold (Implied Volatility) and the volatility the S&P500 and Nasdaq-100 ultimately realize (Realized Volatility).
I am using 30-day Implied Volatility (IV) and 21-day Realized Volatility (HV) as the basis for my calculation, as one month of IV is based on 30 calendaristic days and one month of HV is based on 21 trading days.
At first, the indicator appears blank and a label instructs you to choose which index you want the V-R-P to plot on the chart. Use the indicator settings (the sprocket) to choose one of the indices (or both).
Together with the V-R-P line, the indicator will show its one year moving average within a range of +/- 15% (which you can change) for benchmarking purposes. We should consider this range the “normalized” V-R-P for the actual period.
The Zero Line is also marked on the indicator.
Interpretation
When V-R-P is within the “normalized” range, … well... volatility and uncertainty, as it’s seen by the option market, is “normal”. We have a “premium” of volatility which should be considered normal.
When V-R-P is above the “normalized” range, the volatility premium is high. This means that investors are willing to pay more for options because they see an increasing uncertainty in markets.
When V-R-P is below the “normalized” range but positive (above the Zero line), the premium investors are willing to pay for risk is low, meaning they see decreasing uncertainty and risks in the market, but not by much.
When V-R-P is negative (below the Zero line), we have COMPLACENCY. This means investors see upcoming risk as being lower than what happened in the market in the recent past (within the last 30 days).
CONCEPTS:
Volatility Risk Premium
The volatility risk premium (V-R-P) is the notion that implied volatility (IV) tends to be higher than realized volatility (HV) as market participants tend to overestimate the likelihood of a significant market crash.
This overestimation may account for an increase in demand for options as protection against an equity portfolio. Basically, this heightened perception of risk may lead to a higher willingness to pay for these options to hedge a portfolio.
In other words, investors are willing to pay a premium for options to have protection against significant market crashes even if statistically the probability of these crashes is lesser or even negligible.
Therefore, the tendency of implied volatility is to be higher than realized volatility, thus V-R-P being positive.
Realized/Historical Volatility
Historical Volatility (HV) is the statistical measure of the dispersion of returns for an index over a given period of time.
Historical volatility is a well-known concept in finance, but there is confusion in how exactly it is calculated. Different sources may use slightly different historical volatility formulas.
For calculating Historical Volatility I am using the most common approach: annualized standard deviation of logarithmic returns, based on daily closing prices.
Implied Volatility
Implied Volatility (IV) is the market's forecast of a likely movement in the price of the index and it is expressed annualized, using percentages and standard deviations over a specified time horizon (usually 30 days).
IV is used to price options contracts where high implied volatility results in options with higher premiums and vice versa. Also, options supply and demand and time value are major determining factors for calculating Implied Volatility.
Implied Volatility usually increases in bearish markets and decreases when the market is bullish.
For determining S&P500 and Nasdaq-100 implied volatility I used their volatility indices: VIX and VXN (30-day IV) provided by CBOE.
Warning
Please be aware that because CBOE doesn’t provide real-time data in Tradingview, my V-R-P calculation is also delayed, so you shouldn’t use it in the first 15 minutes after the opening.
This indicator is calibrated for a daily time frame.
ESPAŇOL
Este indicador (V-R-P) calcula la Prima de Riesgo de Volatilidad (de un mes) para S&P500 y Nasdaq-100.
V-R-P es la prima que pagan los hedgers sobre la Volatilidad Realizada para las opciones de los índices S&P500 y Nasdaq-100.
La prima proviene de los hedgers que pagan para asegurar sus carteras y se manifiesta en el diferencial entre el precio al que se venden las opciones (Volatilidad Implícita) y la volatilidad que finalmente se realiza en el S&P500 y el Nasdaq-100 (Volatilidad Realizada).
Estoy utilizando la Volatilidad Implícita (IV) de 30 días y la Volatilidad Realizada (HV) de 21 días como base para mi cálculo, ya que un mes de IV se basa en 30 días calendario y un mes de HV se basa en 21 días de negociación.
Al principio, el indicador aparece en blanco y una etiqueta le indica que elija qué índice desea que el V-R-P represente en el gráfico. Use la configuración del indicador (la rueda dentada) para elegir uno de los índices (o ambos).
Junto con la línea V-R-P, el indicador mostrará su promedio móvil de un año dentro de un rango de +/- 15% (que puede cambiar) con fines de evaluación comparativa. Deberíamos considerar este rango como el V-R-P "normalizado" para el período real.
La línea Cero también está marcada en el indicador.
Interpretación
Cuando el V-R-P está dentro del rango "normalizado",... bueno... la volatilidad y la incertidumbre, como las ve el mercado de opciones, es "normal". Tenemos una “prima” de volatilidad que debería considerarse normal.
Cuando V-R-P está por encima del rango "normalizado", la prima de volatilidad es alta. Esto significa que los inversores están dispuestos a pagar más por las opciones porque ven una creciente incertidumbre en los mercados.
Cuando el V-R-P está por debajo del rango "normalizado" pero es positivo (por encima de la línea Cero), la prima que los inversores están dispuestos a pagar por el riesgo es baja, lo que significa que ven una disminución, pero no pronunciada, de la incertidumbre y los riesgos en el mercado.
Cuando V-R-P es negativo (por debajo de la línea Cero), tenemos COMPLACENCIA. Esto significa que los inversores ven el riesgo próximo como menor que lo que sucedió en el mercado en el pasado reciente (en los últimos 30 días).
CONCEPTOS:
Prima de Riesgo de Volatilidad
La Prima de Riesgo de Volatilidad (V-R-P) es la noción de que la Volatilidad Implícita (IV) tiende a ser más alta que la Volatilidad Realizada (HV) ya que los participantes del mercado tienden a sobrestimar la probabilidad de una caída significativa del mercado.
Esta sobreestimación puede explicar un aumento en la demanda de opciones como protección contra una cartera de acciones. Básicamente, esta mayor percepción de riesgo puede conducir a una mayor disposición a pagar por estas opciones para cubrir una cartera.
En otras palabras, los inversores están dispuestos a pagar una prima por las opciones para tener protección contra caídas significativas del mercado, incluso si estadísticamente la probabilidad de estas caídas es menor o insignificante.
Por lo tanto, la tendencia de la Volatilidad Implícita es de ser mayor que la Volatilidad Realizada, por lo cual el V-R-P es positivo.
Volatilidad Realizada/Histórica
La Volatilidad Histórica (HV) es la medida estadística de la dispersión de los rendimientos de un índice durante un período de tiempo determinado.
La Volatilidad Histórica es un concepto bien conocido en finanzas, pero existe confusión sobre cómo se calcula exactamente. Varias fuentes pueden usar fórmulas de Volatilidad Histórica ligeramente diferentes.
Para calcular la Volatilidad Histórica, utilicé el enfoque más común: desviación estándar anualizada de rendimientos logarítmicos, basada en los precios de cierre diarios.
Volatilidad Implícita
La Volatilidad Implícita (IV) es la previsión del mercado de un posible movimiento en el precio del índice y se expresa anualizada, utilizando porcentajes y desviaciones estándar en un horizonte de tiempo específico (generalmente 30 días).
IV se utiliza para cotizar contratos de opciones donde la alta Volatilidad Implícita da como resultado opciones con primas más altas y viceversa. Además, la oferta y la demanda de opciones y el valor temporal son factores determinantes importantes para calcular la Volatilidad Implícita.
La Volatilidad Implícita generalmente aumenta en los mercados bajistas y disminuye cuando el mercado es alcista.
Para determinar la Volatilidad Implícita de S&P500 y Nasdaq-100 utilicé sus índices de volatilidad: VIX y VXN (30 días IV) proporcionados por CBOE.
Precaución
Tenga en cuenta que debido a que CBOE no proporciona datos en tiempo real en Tradingview, mi cálculo de V-R-P también se retrasa, y por este motivo no se recomienda usar en los primeros 15 minutos desde la apertura.
Este indicador está calibrado para un marco de tiempo diario.

VIX Reversal Scalper by Trend Friend - Stocks OnlyVIX REVERSAL SCALPER BY TREND FRIEND - STOCKS ONLY
This indicator is built for scalping, but can be used for swing trades by adjusting the signal settings to a higher number.
This indicator is meant for stocks with a lot of price action and volatility, so for best results, use it on charts that move similar to the S&P 500 or other similar charts.
This indicator uses real time data from the stock market overall, so it should only be used on stocks and will only give a few signals during after hours. It does work ok for crypto, but will not give signals when the US stock market is closed.
**HOW TO USE**
When the VIX Volatility Index trend changes direction, it will give a bull or bear signal on the chart depending on which way the VIX is now trending. Follow these when price is near support/resistance or fibonacci levels.
For more signals with earlier entries, go into settings and reduce the number. 10-100 is best for scalping. For less signals with later entries, change the number to a higher value. Use 100-500 for swing trades. Can go higher for long swing trades.
***MARKETS***
This indicator should only be used on the US stock markets as signals are given based on the VIX volatility index which measures volatility of the US Stock Markets.
***TIMEFRAMES***
This indicator works on all time frames.
**NOTE**
Repainting does happen but it is seldom. If I get enough requests to remove repainting I will, but since it is built for early entries, preventing it from repainting will make the signals show up later than normal.
Due to various factors, this indicator might not give exit signals every time it should, so be sure to watch the price action for entries/exits and don't rely solely on this indicator.
**INVERSE CHARTS**
If you are using this on an inverse ETF and the signals are showing backwards, please comment with what chart it is and I will configure the indicator to give the correct signals. I have included over 50 inverse ETFs into the code to show the correct signals on inverse charts, but I'm sure there are some that I have missed so feel free to let me know and I will update the script with the requested tickers.
***TIPS***
Try using numerous indicators of ours on your chart so you can instantly see the bullish or bearish trend of multiple indicators in real time without having to analyze the data. Some of our favorites are our Auto Fibonacci, Directional Movement Index, Volume Profile, Auto Support And Resistance and Money Flow Index in combination with this Vix Reversal Scalper. They all have real time Bullish and Bearish labels as well so you can immediately understand each indicator's trend.

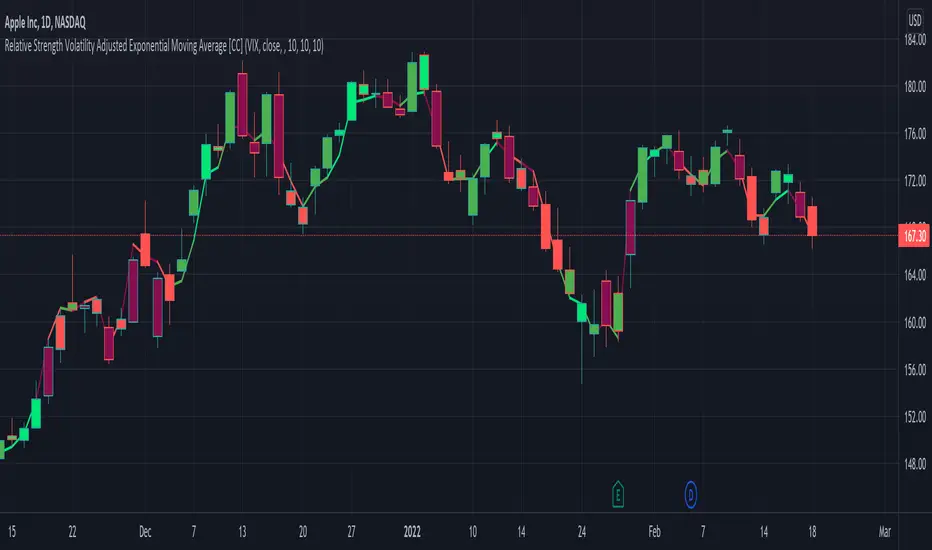
Relative Strength Volatility Adjusted Ema [CC]The Relative Strength Volatility Adjusted Exponential Moving Average was created by Vitali Apirine (Stocks and Commodities Mar 2022) and this is his final indicator of his recent Relative Strength series. I published both of the previous indicators, Relative Strength Volume Adjusted Exponential Moving Average and Relative Strength Exponential Moving Average
This indicator is particularly unique because it uses the Volatility Index (VIX) symbol as the default to determine volatility and uses this in place of the current stock's price into a typical relative strength calculation. As you can see in the chart, it follows the price much closer than the other two indicators and so of course this means that this indicator is best for choppy markets and the other two are better for trending markets. I would of course recommend to experiment with this one and see what works best for you.
I have included strong buy and sell signals in addition to normal ones so strong signals are darker in color and normal signals are lighter in color. Buy when the line turns green and sell when it turns red.
Let me know if there are any other indicators or scripts you would like to see me publish!
Volatility ScreenerA screener to find easily volatile coins. The method is based on the standard deviation to the price average ratio.
Choose your target coins (coin1 to coin 15) and selected the length of observation.
By choose the minimum volatility level you can distinguish the coins with high volatility.
Change the timeframe to your desired.

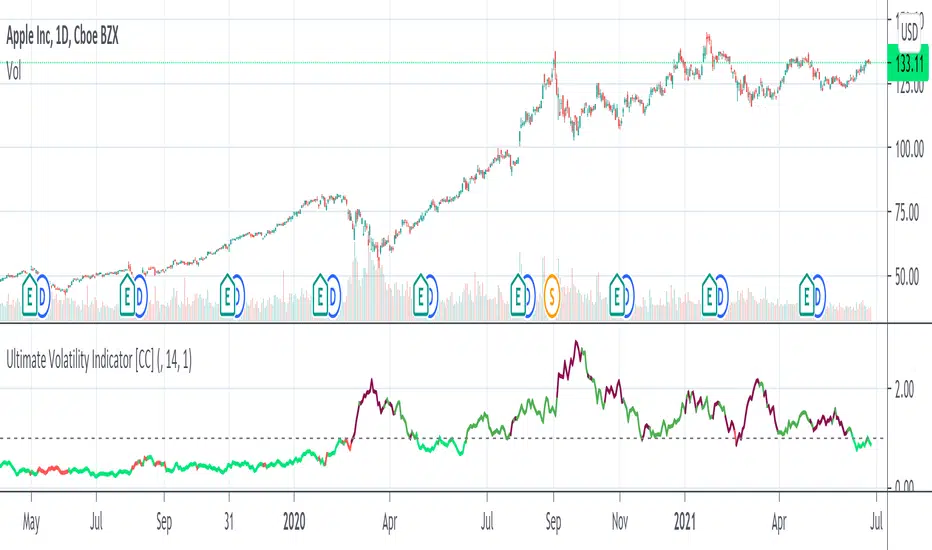
Ultimate Volatility Indicator [CC]The Ultimate Volatility Indicator was created by Richard Poster (Stocks and Commodities July 2021 pg 21) and this is a very simple but effective indicator. The idea behind volatility indicators is that when the indicator rises above a certain threshold then volatility is high enough and you can make a good amount of money riding the trend in the current direction and then exit when volatility drops below the threshold or until the underlying trend changes.
I have included a threshold that you can change from the default but I would recommend trying out different values to see what works best for you. This indicator will let you know as soon as volatility increases and reacts very quickly. I have included strong buy and sell signals in addition to normal ones so darker colors are strong buy and sell signals and lighter colors are normal signals. Buy when the line turns green and sell when it turns red.
Please let me know if you would like to see me publish any other indicators!
Cross Asset VolatilityThis script brings together a number of volatility indexes from the CBOE in one space making it easier to use rather than adding a number of different securities to one chart. One could create a template with these securities attached, but sometimes, you don't want to switch charts, for whatever reason, and adding an indicator for is quick and simple.
One note is that due some securities exhibit much larger volatility than others (i.e. oil vs bonds) and it can be difficult to see clearly those securities whose volatilities are low, and hence we have added the ability to calculate the values as a Log value to make the indicator more readable. Another way to do this is to change the Y-axis on the chart to Logarithmic while leaving the indicator at its default settings (i.e. the checkbox for using Log calculations remains unchecked).
