Blockcircle Price Gaps (PG)I got tired of price gap indicators that dump every zone on the chart and leave you to figure out which ones actually matter. I have tried every single one imaginable. Therefore, I built this one to score each gap automatically based on how close it is, how it formed, and whether it aligns with the trend. Instead of cryptic numbers, it just tells you: Strong, Moderate, or Weak, plus how far away it is. You see what matters, skip what doesn't. Hopefully, you find it helpful!
If you have other ideas to improve it even further, please let me know, and I can integrate them.
WHAT MAKES IT ORIGINAL AND DIFFERENT
Standard gap indicators display every detected imbalance with identical visual treatment, leaving traders to manually assess which zones matter. This creates cluttered charts and analysis paralysis.
This BLOCKCIRCLE PRICE GAPS (PG) indicator solves that problem with a Relevance Engine that automatically scores each gap from 0 to 100 and translates scores into plain language: Strong, Moderate, or Weak. Each zone displays its strength rating and distance from the current price, so you instantly know which gaps deserve attention and how far the price must travel to reach them.
The scoring combines four factors that research shows correlate with zone effectiveness:
Proximity: Gaps closer to the current price score higher because nearby zones influence immediate price action more than distant ones.
Formation Volume: Gaps created during above-average volume suggest institutional activity rather than random price movement.
Impulse Strength: Gaps formed by strong moves (measured against ATR) indicate genuine supply/demand imbalance rather than noise.
Trend Alignment: Support gaps in uptrends and resistance gaps in downtrends receive bonus points for trading with momentum.
Visual intensity reflects strength automatically. Strong zones appear darker and more prominent. Weak zones fade into the background. You see what matters without decoding numbers.
HOW IT WORKS
Price Gaps form when aggressive buying or selling creates an imbalance, leaving unfilled space between candles. These zones often act as support (bullish gaps below price) or resistance (bearish gaps above price) when the price returns to them.
Detection uses the standard three-candle method: a bullish gap exists when the current low exceeds the high from two bars prior. A bearish gap exists when the current high falls below the low from two bars prior.
What makes this implementation different is continuous relevance tracking . Each bar, every gap receives an updated score based on current conditions . As the price moves away, the proximity scores decrease. As gaps age, time decay gradually reduces their overall relevance. When capacity limits are reached, the lowest-scoring gap is removed first, ensuring your chart always shows the most actionable zones.
Labels show practical information:
Strength rating (Strong, Moderate, or Weak)
Zone type (Support or Resistance)
Distance from current price with direction (+12% means above, -8% means below)
FEATURES
Relevance scoring with automatic strength classification
Plain-language labels showing strength and distance
Color intensity that reflects zone importance
Retest detection when price returns to unfilled gaps
Proximity filtering to hide distant zones
Age filtering to remove stale gaps
Size filtering for minimum and maximum gap thresholds
Relevance-based capacity management
Information panel with zone counts and trend context
Multiple label style options
HOW THE COMPONENTS WORK TOGETHER
The system operates as a filtering pipeline:
Size filters remove gaps that are too small (market noise) or too large (extreme events unlikely to fill).
The Relevance Engine scores qualifying gaps based on proximity, volume, impulse, and trend.
Gaps below the minimum score threshold are hidden.
Proximity and age filters remove distant or stale gaps.
When at capacity, the lowest-scoring gap is removed to make room for new detections.
This layered approach ensures only the most relevant gaps appear on your chart.
CONFIGURABLE SETTINGS
Display Settings control how many zones appear and how they are displayed.
Label Style lets you choose what information displays: Strength plus Distance (default), Strength Only, Distance Only, Score Only, or None.
Relevance Engine settings include the master toggle and minimum score threshold. The Scoring Weights section allows advanced users to adjust how much each factor contributes.
Filters control size thresholds, maximum distance from price, and maximum age in bars.
Retest Alerts notify you when the price returns to an unfilled gap with three sensitivity options.
Zone Behavior controls whether filled gaps are removed and what counts as a filled gap.
HOW TO USE
The default settings work well for most timeframes and markets. Strong zones (shown in brighter colors with yellow text) have multiple factors aligned and deserve the most attention. Moderate zones are worth watching. Weak zones provide context but may not produce reliable reactions.
For active trading, focus on Strong and Moderate zones within 10% of the current price. These are the most likely to influence near-term price action.
For swing trading, expand the Maximum Distance setting to see zones further from the price that may become relevant as trends develop.
When the Retest alert fires, the price is returning to an unfilled gap. Evaluate the zone strength, look for price reaction at the zone boundary, and consider whether the move aligns with the broader trend before trading.
The information panel shows:
Support: Count of bullish gaps (potential buying zones)
Resistance: Count of bearish gaps (potential selling zones)
Unfilled: Zones not yet touched by price
Avg Strength: Overall quality of visible zones
Trend: Current direction based on EMA alignment
LIMITATIONS
Relevance scoring is probabilistic, not predictive. A Strong gap is more likely to produce a reaction based on historical patterns, but any zone can fail.
The trend component uses EMA crossovers (20/50/200), which may lag in choppy markets.
Distance calculations update each bar. During volatile moves, labels may briefly show different values as price swings.
DEFAULTS
These are the defaults, but you would adjust and calibrate it to a specific asset, as needed:
Maximum Zones: 12
Label Style: Strength + Distance
Minimum Score: 20
Maximum Distance: 25%
Maximum Age: 300 bars
If you have any questions at all, please ask away!
Volumespreadanalysis

VWAP Confluence Pro█ OVERVIEW
VWAP Confluence Pro is a high-precision trading indicator that combines VWAP with multiple confirmation filters to generate reliable buy and sell signals. Unlike basic VWAP crossover strategies that produce excessive noise, this indicator requires alignment across six independent conditions before triggering a signal, dramatically reducing false entries while capturing high-probability setups.
█ FEATURES
Multi-Layer Confirmation System
The indicator employs a strict confluence approach requiring all of the following conditions to align:
- VWAP Cross: Price must cross above (buy) or below (sell) the VWAP line
- VWAP Trend: The VWAP itself must be rising for buys or falling for sells, confirming directional bias
- Price Trend: A 20-period moving average filter ensures trades align with the prevailing trend
- Volume Confirmation: Signals only trigger when volume exceeds 1.5x the 20-bar average, indicating institutional participation
- RSI Filter: Buys require RSI between 50-60 (bullish momentum without overbought conditions), sells require 40-50 (bearish momentum without oversold conditions)
- MACD Momentum: MACD must confirm directional bias with the MACD line above the signal line for buys, below for sells
Signal Cooldown Period
A configurable cooldown mechanism (default 10 bars) prevents signal clustering and overtrading by ensuring adequate spacing between alerts. This feature is critical for maintaining discipline and avoiding choppy market conditions.
Visual Elements
- Purple VWAP Line: The cornerstone of the strategy, plotted with high visibility
- Green Up Arrows: Buy signals appear below price candles when all conditions align
- Red Down Arrows: Sell signals appear above price candles when all conditions align
- Blue Trend MA: A semi-transparent moving average provides visual trend context
- Background Shading: Subtle green/red backgrounds indicate when multiple confluence factors are aligned, even without a cross
█ HOW TO USE
Timeframe Selection
This indicator is optimized for intraday trading on 1-minute to 15-minute charts, where VWAP is most effective. It can also be used on hourly charts for swing trade entries or daily charts with appropriate parameter adjustments.
Parameter Optimization
All key parameters are customizable through the indicator settings:
- VWAP Deviation %: Controls sensitivity (default 0.8%). Lower values = stricter signals
- Volume Multiplier: Defines volume threshold (default 1.5x). Higher values = stronger volume confirmation required
- Trend Filter Length: Moving average period (default 20). Adjust based on your timeframe
- Cooldown Period: Minimum bars between signals (default 10). Increase for slower markets
- RSI/MACD Settings: Standard values provided, adjust for specific instruments if needed
Trading Strategy
1 — Wait for a signal arrow to appear (green for buy, red for sell)
2 — Confirm the background shading supports the signal direction
3 — Enter on the close of the signal candle or the open of the next candle
4 — Set stop loss below/above the recent swing low/high or the VWAP line
5 — Take profit at logical resistance/support levels or when opposing confluence develops
Best Practices
- Only take long trades when price is above a rising VWAP
- Only take short trades when price is below a falling VWAP
- Avoid trading during low volume periods (first/last 15 minutes of sessions)
- Use the background shading to gauge overall market bias between signals
- Consider increasing the cooldown period in choppy or range-bound conditions
█ LIMITATIONS
- This indicator is designed for trending markets and will produce fewer signals during consolidation periods
- The strict confluence requirements mean you may miss some valid moves in exchange for higher signal quality
- VWAP resets at the start of each session, making it less reliable on 24-hour markets without session breaks (use anchored VWAP for crypto/forex)
- Requires real-time volume data to function properly, less effective on thinly traded instruments
- Not suitable for scalping strategies requiring rapid entries, as the cooldown mechanism intentionally limits signal frequency
█ NOTES
Signal Quality Over Quantity
This indicator prioritizes accuracy over frequency. You may only see 1-3 signals per session on lower timeframes, but each signal represents a setup where trend, momentum, and volume are all aligned. This approach is designed to keep you out of low-probability trades and focused on the best opportunities.
Customization Encouraged
The default parameters provide a solid foundation, but different instruments and timeframes may benefit from optimization. Test the indicator across various settings to find what works best for your specific trading style and markets.
═════════════════════════════════════════════════════════════════════════
This indicator synthesizes best practices from institutional VWAP trading with momentum confirmation from RSI and MACD. By requiring multiple independent factors to align, it filters out the noise common in single-indicator systems and focuses on setups where probability favors directional moves.

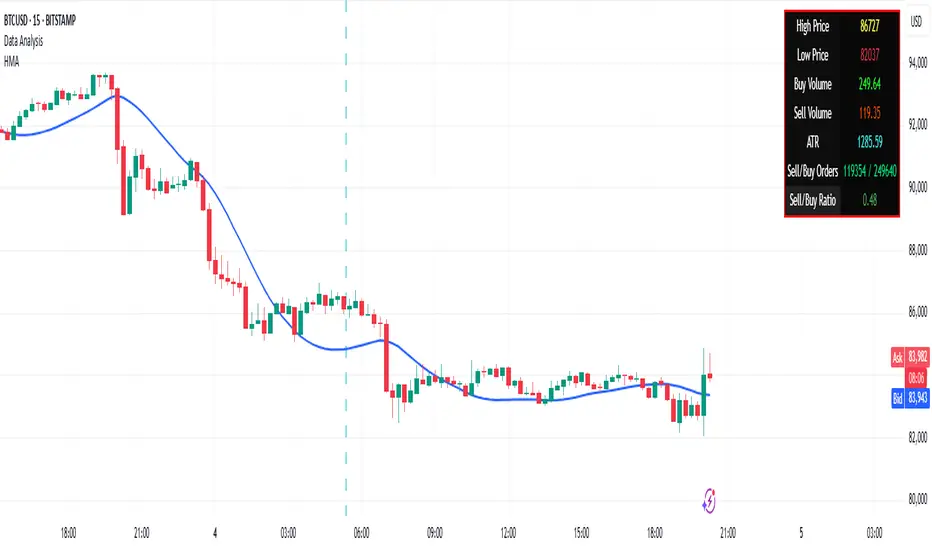
Volume Ratio [MIT]Core Logic:
This indicator splits each bar's volume into "Buy Volume" and "Sell Volume" based on the relationship between close and open price, then calculates the rolling ratio of cumulative buy volume to sell volume over the past n bars, helping traders gauge short-term buying vs. selling pressure.
Volume Split Rules:
Bull bar (close > open): All volume assigned to Buy
Bear bar (close < open): All volume assigned to Sell
Flat bar (close == open): Handled by the "Flat bar volume" setting:
Split 50/50 (default): 50% Buy + 50% Sell
Ignore: Volume discarded (0 Buy, 0 Sell)
All to Buy: All volume to Buy
All to Sell: All volume to Sell
Calculation:
buySum = rolling sum of buy volume over last n bars
sellSum = rolling sum of sell volume over last n bars
Ratio = buySum / sellSum (na when sellSum = 0)
Ratio > 1: Buying pressure dominates (red line)
Ratio < 1: Selling pressure dominates (green line)
Visual Elements:
Green line: Rolling Buy Volume (n bars) – optional
Red line: Rolling Sell Volume (n bars) – optional
Colored line: Buy/Sell Ratio (red when >1, green when <1)
Horizontal line at 1.0: Neutral balance level
Typical Trading Use Cases:
Trend Confirmation: Ratio persistently > 1.2–1.5 while price rises → strong bullish confirmation
Divergence: Price makes higher high but ratio declines → potential top divergence
Breakout Filter: Breakout with rapidly rising ratio → higher probability breakout
Range Market Avoidance: Ratio oscillating between 0.8–1.2 → avoid choppy entries
Crypto Day/Swing Trading: Commonly used on 5m–1h charts, combined with price action or order flow
核心逻辑:
该指标基于K线的收盘价与开盘价的关系,将每根K线的成交量(volume)拆分为“买入量”(Buy Volume)和“卖出量”(Sell Volume),然后计算过去n根K线的累计买入量与卖出量的比率(Buy/Sell Ratio),用来判断短期内买卖力量的相对强弱。
成交量拆分规则:
阳线(close > open):全部成交量计入买入量
阴线(close < open):全部成交量计入卖出量
平线(close == open):根据“Flat bar volume”参数处理:
Split 50/50(默认):平分50%买入 + 50%卖出
Ignore:忽略该K线(都不计)
All to Buy:全部算买入
All to Sell:全部算卖出
计算方式:
滚动窗口n根K线内的累计买入量(buySum)和卖出量(sellSum)
比率 = buySum / sellSum(当sellSum=0时显示na)
比率 > 1:买入力量占优(红色)
比率 < 1:卖出力量占优(绿色)
图表显示:
绿色柱线:过去n根的累计买入量(可选显示)
红色柱线:过去n根的累计卖出量(可选显示)
彩色折线:买入/卖出比率(>1红色,<1绿色)
水平线1.0:平衡线(比率=1)
典型使用场景:
趋势确认:比率持续 > 1.2~1.5 且价格上涨 → 强势多头确认
背离信号:价格创新高但比率持续下降 → 潜在顶部背离
放量突破:突破关键位时比率同步快速拉升 → 突破有效性更高
震荡市过滤:比率在0.8~1.2区间反复震荡 → 避免频繁交易
币圈短线:常用于5分钟~1小时图,配合价格结构或订单流使用

VSA Effort Result v1.0VSA Effort vs Result by StupidRich
Detects volume-spread divergence:
- "Er": High volume, narrow spread (absorption)
- "eR": Low volume, wide spread (momentum)
Features:
• Clean text labels (customizable size)
• Wide vertical lines matching candle range
• Adjustable thresholds & volume SMA
• Works on all timeframes/assets
Perfect for spotting institutional absorption at key levels.
if u wanna buy me a coffee, just dm @stupidrichboy on Telegram
hope it help

Volume vs Range Imbalance DetectorDescription :-
Concept :-
This indicator is designed to identify "Effort vs. Result" anomalies in the market using Volume Spread Analysis (VSA) concepts. It highlights specific candles where high trading activity (Volume) is occurring, but the price movement (Range) is restricted. This behavior often signals the presence of heavy absorption by buyers or sellers ("Smart Money" activity) before a potential reversal or continuation.
How It Works :-
The script combines two distinct methods of volume analysis into a single view
1. Structural Imbalance (Lime & Red Signals)
This logic detects major market anomalies by comparing the current candle against a 50-period average context.
The Logic: A signal is generated if the Volume is significantly higher than the average (default 1.618x the 50 SMA) AND the Price Range is significantly smaller than the average (default 1.272x the 50 ATR).
Lime Candle/Dot (Bullish Absorption): Massive volume with small range, closing in the upper 50% of the bar. This suggests sellers are dumping, but buyers are absorbing all orders, preventing the price from dropping.
Red Candle/Dot (Bearish Blockade): Massive volume with small range, closing in the lower 50% of the bar. This suggests buyers are pushing, but sellers are absorbing the demand, preventing the price from rising.
2. Hidden Activity (Orange Signals)
This logic is more sensitive and compares the current candle only to the previous candle.
The Logic: A signal is generated if the current Volume is higher than the previous bar's volume, but the current Range is smaller than the previous bar's range.
Orange Candle/Dot: This indicates "Churn." Effort is increasing, but the result (movement) is decreasing. It is often an early warning sign of congestion or a pending breakout.
Visual Guide
Lime Dot (Below Bar): Strong Buying Pressure (Bullish Imbalance).
Red Dot (Above Bar): Strong Selling Pressure (Bearish Imbalance).
Orange Dot (Above Bar): Hidden Activity / Churn (Warning).
Settings
Context Length: The lookback period for the moving averages (Default: 50).
Volume/Range Multipliers: Determine how strict the "Imbalance" signals are. Higher numbers result in fewer, more significant signals.
Show Hidden Activity: Toggle the orange signals on or off.
Disclaimer
This tool is for educational purposes only. Volume analysis is subjective and should be used in conjunction with other form

DeltaBurst Locator ## DeltaBurst Locator
DeltaBurst Locator is a sponsorship detector that divides OBV impulse by price thrust, normalizes the ratio, and cross-checks it against a higher timeframe confirmation stream. The oscillator turns the abstract "is this move real?" question into a precise number, exposing accumulation, distribution, and exhaustion across futures and stocks.
HOW IT WORKS
OBV Impulse vs. Price Change – Smoothed deltas of On-Balance Volume and price are ratioed, then normalized using a hyperbolic tangent function to prevent single prints from dominating.
Signal vs. Confirmation – A short EMA produces the execution signal while a higher-timeframe request.security() feed validates whether broader flows agree.
Spectrum Classification – Expansion/compression metrics grade whether current aggression is intense or fading, while ±0.65 bands define exhaust/vacuum zones.
Slope Divergences – Linear regression slopes on both price and the ratio expose bullish/bearish sponsorship mismatches before candles reverse.
HOW TO USE IT
Breakout Validation : Only chase breakouts when both local and higher-timeframe ratios are on the same side of zero; mixed signals suggest liquidity is fading.
Absorption Trades : When the histogram spikes beyond ±0.65 but the EMA lags, expect absorption; combine with price structure for pinpoint reversals.
News/Event Monitoring : During earnings or macro releases, watch for ratio collapses with price still rising—this flags forced moves driven by hedging rather than real demand.
VISUAL FEATURES
Color logic: Positive sponsorship fills teal, negative fills crimson against the zero line, making intent obvious at a glance.
Optional markers: Burst triangles and divergence dots can be enabled when you need explicit annotations or left off for a minimalist panel.
Compression heatmap: Background shading communicates whether the market is coiling (high compression) or erupting (low compression).
Dashboard: Displays the live ratio, higher-timeframe ratio, and agreement state to speed up scanning across tickers.
PARAMETERS
Fast Pulse Length (default: 5): Controls the smoothing window for price change detection.
Slow Equilibrium Length (default: 34): Window for expansion/compression calculation.
OBV Smooth (default: 8): Smoothing period for OBV impulse calculation.
Ratio Ceiling (default: 3.0): Controls how aggressively values saturate; raise for high-volatility tickers.
Signal EMA (default: 4): EMA period for the signal line.
Confirmation Timeframe (default: 240): Pick a higher anchor (e.g., 4H) to validate intraday moves.
Divergence Window (default: 21): Window for slope-based divergence detection.
Show Burst Markers (default: disabled): Toggle burst triangles on demand.
Show Divergence Markers (default: disabled): Toggle divergence dots on demand.
Show Delta Dashboard (default: enabled): Hide when screen space is limited; leave on for desk broadcasts.
ALERTS
The indicator includes four alert conditions:
DeltaBurst Bull: Spotted a bullish liquidity burst
DeltaBurst Bear: Spotted a bearish liquidity burst
DeltaBurst Bull Div: Detected bullish sponsorship divergence
DeltaBurst Bear Div: Detected bearish sponsorship divergence
Hope you enjoy!

Volume Pressure OscillatorThe Volume Pressure Oscillator (VPO) is a momentum-based indicator that measures the directional pressure of cumulative volume delta (CVD) combined with price efficiency. It oscillates between 0 and 100, with readings above 50 indicating net buying pressure and readings below 50 indicating net selling pressure.
The indicator is designed to identify the strength and sustainability of volume-driven trends while remaining responsive during consolidation periods.
How the Indicator Works
The VPO analyzes volume flow by examining price action at lower timeframes to build a Cumulative Volume Delta (CVD). For each chart bar, the indicator looks at intrabar price movements to classify volume as either buying volume or selling volume. These classifications are accumulated into a running total that tracks net directional volume.
The indicator then measures the momentum of this CVD over both short-term and longer-term periods, providing responsiveness to recent changes while maintaining awareness of the broader trend. These momentum readings are normalized using percentile ranking, which creates a stable 0-100 scale that works consistently across different instruments and market conditions.
A key feature is the extreme zone persistence mechanism. When the indicator enters extreme zones (above 80 or below 20), it maintains elevated readings as long as volume pressure continues in the same direction. This allows the VPO to stay in extreme zones during strong trends rather than quickly reverting to neutral, making it useful for identifying sustained volume pressure rather than just temporary spikes.
What Makes This Indicator Different
While many indicators measure volume or volume delta, the VPO specifically measures how aggressively CVD is currently changing and whether that pressure is being sustained. It's the difference between knowing "more volume has accumulated on the buy side" versus "buying pressure is intensifying right now and shows signs of continuation."
1. Focus on CVD Momentum, Not CVD Levels
Most CVD indicators display the cumulative volume delta as a line that trends up or down indefinitely. The VPO is fundamentally different - it measures the slope of CVD rather than the absolute level. This transforms CVD from an unbounded cumulative metric into a bounded 0-100 oscillator that shows the intensity and direction of current volume pressure, not just the historical accumulation.
2. Designed to Stay in Extremes During Trends
Unlike traditional oscillators that treat extreme readings (above 80 or below 20) as overbought/oversold reversal signals, the VPO is engineered to oscillate within extreme zones during strong trends. When sustained buying or selling pressure exists, the indicator remains elevated (e.g., 80-95 or 5-20) rather than quickly reverting to neutral. This makes it useful for trend continuation identification rather than exclusively for reversal trading.
3. Percentile-Based Normalization
The VPO uses percentile ranking over a lookback window, which provides consistent behavior across different instruments, timeframes, and volatility regimes without constant recalibration.
4. Dual-Timeframe Momentum Synthesis
The indicator simultaneously considers short-term CVD momentum (responsive to recent changes) and longer-term CVD momentum (tracking trend direction), weighted and combined with a slow-moving trend bias. This multi-timeframe approach helps it stay responsive in ranging markets while maintaining context during trends.
How to Use the Indicator
Understanding the Zones:
80-100 (Strong Buying Pressure): CVD momentum is strongly positive. In trending markets, the indicator oscillates within this zone rather than immediately reverting to neutral. This suggests sustained accumulation and trend continuation probability.
60-80 (Moderate Buying): Positive volume pressure but not extreme. Suitable for identifying pullback entry opportunities within uptrends.
40-60 (Neutral Zone): Volume pressure is balanced or unclear. No strong directional edge from volume. Often seen during consolidation or trend transitions.
20-40 (Moderate Selling): Negative volume pressure developing. May indicate distribution or downtrend continuation setups.
0-20 (Strong Selling Pressure): CVD momentum is strongly negative. During downtrends, sustained readings in this zone suggest continued distribution and downside follow-through probability.
Practical Applications:
Trend Confirmation: When price makes new highs/lows, check if VPO confirms with similarly elevated readings. Divergences (price making new highs while VPO fails to reach prior highs) may indicate weakening momentum.
Range Trading: During consolidation, the VPO typically oscillates between 30-70. Readings toward the low end of the range (30-40) may present accumulation opportunities, while readings at the high end (60-70) may indicate distribution zones.
Extreme Persistence: If VPO reaches 90+ or drops below 10, this indicates exceptional volume pressure. Rather than fading these extremes immediately, monitor whether the indicator stays elevated. Sustained extreme readings suggest strong trend continuation potential.
Context with Price Action: The VPO is most effective when combined with price action or other orderflow indicators. Use the indicator to gauge whether volume is confirming or contradicting.
What the Indicator Does NOT Do:
It does not provide specific entry or exit signals
It does not predict future price direction
It does not guarantee profitable trades
It should not be used as a standalone trading system
Settings Explanation
Momentum Period (Default: 14)
This parameter controls the lookback period for CVD rate-of-change calculations.
Lower values (5-10): Make the indicator more responsive to recent volume changes. Useful for shorter-term trading and more active oscillation. May produce more whipsaws in choppy markets.
Default value (14): Provides balanced responsiveness while filtering out most noise. Suitable for swing trading and daily timeframe analysis.
Higher values (20-50): Create smoother readings and focus on longer-term volume trends. Better for position trading and reducing false signals, but with slower reaction to genuine changes in volume pressure.
Important Notes:
This indicator requires intrabar data to function properly. On some instruments or timeframes where lower timeframe data is not available, the indicator may not display.
The indicator uses request.security_lower_tf() which has a limit of intrabars. On higher timeframes, this provides extensive history, but on very low timeframes (<1-minute charts), the indicator may only cover limited historical bars.
Volume data quality varies by exchange and instrument. The indicator's effectiveness depends on accurate volume reporting from the data feed.

Dynamic Volume Trace Profile [ChartPrime]⯁ OVERVIEW
Dynamic Volume Trace Profile is a reimagined take on volume profile analysis. Instead of plotting a static horizontal histogram on the side of your chart, this indicator projects dynamic volume trace lines directly onto the price action. Each bin is color-graded according to its relative strength, creating a living “volume skeleton” of the market. The orange trace highlights the current Point of Control (POC)—the price level with maximum historical traded volume within the lookback window. On the right side, the tool builds a mini profile, showing absolute volume per bin alongside its percentage share, where the POC always represents 100% strength .
⯁ KEY FEATURES
Dynamic On-Chart Bins:
The range between highest high and lowest low is split into 25 bins. Each bin is drawn as a horizontal trace line across the lookback chart period.
Gradient Color Encoding:
Trace lines fade from transparent to teal depending on relative volume size. The more intense the teal, the stronger the historical traded activity at that level.
Automatic POC Highlight:
The bin with the highest aggregated volume is flagged with an orange line . This POC adapts bar-by-bar as volume distribution shifts.
Right-Side Volume Profile:
At the chart’s right edge, the script prints a box-style profile. Each bin shows:
• Total volume (absolute units).
• Percentage of max volume, in parentheses (POC bin = 100%).
This gives both raw and normalized context at a glance.
Adjustable Lookback Window:
The lookback defines how many bars feed the profile. Increase for stable HTF zones or decrease for responsive intraday distributions.
POC Toggle & Styling:
Optionally toggle POC highlighting on/off, adjust colors, and set line thickness for better integration with your chart theme.
⯁ HOW IT WORKS (UNDER THE HOOD)
Step Sizing:
over last 100 bars is divided by to calculate bin height.
Volume Aggregation:
For each bar in the , the script checks which bin the close falls into, then adds that bar’s volume to the bin’s counter.
Gradient Mapping:
Bin volume is normalized against the max volume across all bins. That value is mapped onto a gradient from transparent → teal.
POC Logic:
The bin with highest volume is colored orange both on the dynamic trace and in the right-side profile.
Right-Hand Profile:
Boxes are drawn for each bin proportional to volume / maxVolume × 50 units, with text labels showing both absolute volume and normalized %.
⯁ USAGE
Use the orange trace as the dominant “magnet” level—price often gravitates to the POC.
Watch for clusters of strong teal traces as areas of high acceptance; thin or faint zones mark low-liquidity gaps prone to fast moves.
On intraday charts, tighten lookback to reveal session-based distributions . For swing or position trading, expand lookback to surface more durable volume shelves.
Compare the right-side profile % to judge how “top-heavy” or “bottom-heavy” the current distribution is.
Use bright, intense color traces as context for confluence with structure, OBs, or liquidity hunts.
⯁ CONCLUSION
Dynamic Volume Trace Profile takes the traditional volume profile and fuses it into the body of price itself. Instead of a fixed sidebar, you see gradient traces layered directly on the chart, giving real-time context of where volume concentrated and where price may be drawn. With built-in POC highlighting, normalized % readouts, and an adaptive right-side profile, it offers both precision levels and market structure awareness in a cleaner, more intuitive form.

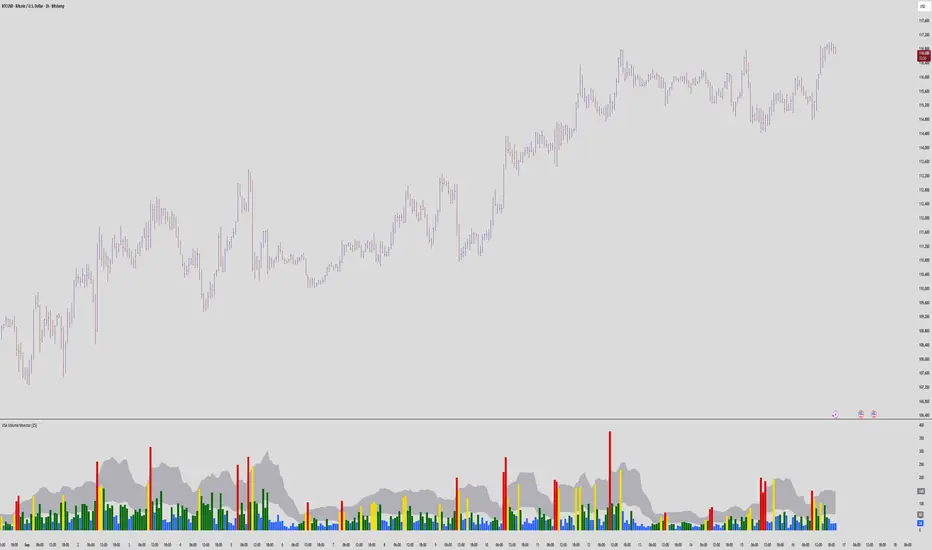
VSA Volume MonitorDescription
This script provides a clear and adaptable visual representation of volume activity, helping traders understand how current participation compares to recent norms.
It calculates a moving average of volume over a user-defined smoothing window and uses that baseline to classify each bar’s volume into several intensity levels.
Bars are color-coded to reflect these levels:
• Blue for below-average activity
• Green for moderate activity
• Yellow for above-average surges
• Red for exceptionally high or climactic volume
In addition to color-coded bars, the script plots two reference bands that represent the typical (baseline) and elevated (climactic) volume zones.
These bands form a shaded cloud that helps visually separate normal market participation from periods of unusual crowd activity or volatility.
The purpose of this indicator is purely visual and informational — it does not generate buy or sell signals, and it does not predict future price movement.
Instead, it gives traders an at-a-glance view of how market interest is shifting, so they can combine that context with their own analysis or strategy.
This tool is lightweight, easy to read, and designed for use alongside other forms of technical analysis, making it suitable for traders who want to build their own framework for understanding volume behavior.
Volumatic Fair Value Gaps [BigBeluga]🔵 OVERVIEW
The Volumatic Fair Value Gaps indicator detects and plots size-filtered Fair Value Gaps (FVGs) and immediately analyzes the bullish vs. bearish volume composition inside each gap. When an FVG forms, the tool samples volume from a 10× lower timeframe , splits it into Buy and Sell components, and overlays two compact bars whose percentages always sum to 100%. Each gap also shows its total traded volume . A live dashboard (top-right) summarizes how many bullish and bearish FVGs are currently active and their cumulative volumes—offering a quick read on directional participation and trend pressure.
🔵 CONCEPTS
FVGs (Fair Value Gaps) : Imbalance zones between three consecutive candles where price “skips” trading. The script plots bullish and bearish gaps and extends them until mitigated.
Size Filtering : Only significant gaps (by relative size percentile) are drawn, reducing noise and emphasizing meaningful imbalances.
// Gap Filters
float diff = close > open ? (low - high ) / low * 100 : (low - high) / high *100
float sizeFVG = diff / ta.percentile_nearest_rank(diff, 1000, 100) * 100
bool filterFVG = sizeFVG > 15
Volume Decomposition : For each FVG, the indicator inspects a 10× lower timeframe and aggregates volume of bullish vs. bearish candles inside the gap’s span.
100% Split Bars : Two inline bars per FVG display the % Bull and % Bear shares; their total is always 100%.
Total Gap Volume : A numeric label at the right edge of the FVG shows the total traded volume associated with that gap.
Mitigation Logic : Gaps are removed when price closes through (or touches via high/low—user-selectable) the opposite boundary.
Dashboard Summary : Counts and sums the active bullish/bearish FVGs and their total volumes to gauge directional dominance.
🔵 FEATURES
Bullish & Bearish FVG plotting with independent color controls and visibility toggles.
Adaptive size filter (percentile-based) to keep only impactful gaps.
Lower-TF volume sampling at 10× faster resolution for more granular Buy/Sell breakdown.
Per-FVG volume bars : two horizontal bars showing Bull % and Bear % (sum = 100%).
Per-FVG total volume label displayed at the right end of the gap’s body.
Mitigation source option : choose close or high/low for removing/invalidating gaps.
Overlap control : older overlapped gaps are cleaned to avoid clutter.
Auto-extension : active gaps extend right until mitigated.
Dashboard : shows count of bullish/bearish gaps on chart and cumulative volume totals for each side.
Performance safeguards : caps the number of active FVG boxes to maintain responsiveness.
🔵 HOW TO USE
Turn on/off FVG types : Enable Bullish FVG and/or Bearish FVG depending on your focus.
Tune the filter : The script already filters by relative size; if you need fewer (stronger) signals, increase the percentile threshold in code or reduce the number of displayed boxes.
Choose mitigation source :
close — stricter; gap is removed when a closing price crosses the boundary.
high/low — more sensitive; a wick through the boundary mitigates the gap.
Read the per-FVG bars :
A higher Bull % inside a bullish gap suggests constructive demand backing the imbalance.
A higher Bear % inside a bearish gap suggests supply is enforcing the imbalance.
Use total gap volume : Larger totals imply more meaningful interest at that imbalance; confluence with structure/HTF levels increases relevance.
Watch the dashboard : If bullish counts and cumulative volume exceed bearish, market pressure is likely skewed upward (and vice versa). Combine with trend tools or market structure for entries/exits.
Optional: hide volume bars : Disable Volume Bars when you want a cleaner FVG map while keeping total volume labels and the dashboard.
🔵 CONCLUSION
Volumatic Fair Value Gaps blends precise FVG detection with lower-timeframe volume analytics to show not only where imbalances exist but also who powers them. The per-gap Bull/Bear % bars, total volume labels, and the cumulative dashboard together provide a fast, high-signal read on directional participation. Use the tool to prioritize higher-quality gaps, align with trend bias, and time mitigations or continuations with greater confidence.

Volume Pressure Analysis - Live DataVolume Pressure Gauge and Volume Percentage Indicator – Pine Script Guide
This indicator provides a simplified, real-time visualization of both volume pressure (buy vs. sell activity) and today’s trading volume in comparison to historical averages. It is designed to help traders assess whether buyers or sellers dominate the current session and whether today’s volume is significant relative to recent behaviour.
________________________________________
Key Functional Segments
1. Inputs and Configuration
Users can configure the length of the Simple Moving Average (SMA) used to calculate average volume, set the position of the gauge table on the chart, and toggle the visibility of the volume pressure display. This allows flexibility in integrating the tool with various trading styles and chart layouts.
2. Volume Data Calculations
The indicator calculates three key volume metrics:
• volToday: The current day’s volume.
• volAvg: The average volume over the user-defined SMA period (default is 20 bars).
• volPct: The current volume as a percentage of the average.
This enables traders to quickly recognize whether current trading activity is above or below normal, which can be a precursor to potential trend strength or weakness.
3. Volume Pressure Calculation
The script estimates buying and selling pressure based on price movement and volume. It distributes volume into upward (buy) and downward (sell) segments and expresses them as percentages of the total volume. This gives an immediate sense of whether bulls or bears are more active in the current session.
4. Visual Representation (Progress Bars)
The indicator renders a simplified visual gauge using horizontal bar segments (pseudo-bars) to reflect the proportion of buy and sell pressure. The length of each bar correlates with the strength of pressure from buyers or sellers, helping users assess dominance without analyzing candlestick behavior in depth.
5. Table Display
A compact table is drawn on the chart showing:
• Buy pressure percentage and corresponding bar.
• Sell pressure percentage and corresponding bar.
• Volume percentage compared to the recent average.
This format makes it easy to evaluate volume dynamics at a glance, without cluttering the price chart or relying on separate overlays.
________________________________________
How Traders Benefit from This Indicator
• Momentum Shift Detection: Early signs of trend reversal can be observed when volume pressure flips direction.
• Breakout Validation: High volume combined with dominant pressure supports the credibility of breakout moves.
• False Move Avoidance: If price moves on low volume or mixed pressure, traders can avoid low-probability entries.
• Market Context Awareness: Users can assess whether a day is behaving normally in terms of participation or is unusually quiet or aggressive.
________________________________________
Basic Usage Guide
1. Add the script to your TradingView chart and set your preferred SMA length for volume comparison.
2. Customize the table’s position using the X and Y settings for clarity and alignment.
3. Interpret the outputs:
o A higher red bar indicates dominant sell pressure.
o A higher green bar indicates dominant buy pressure.
o Volume % above 100% suggests above-average activity, while values below 100% may imply low conviction.
4. Apply to trading decisions:
o High buy pressure and high volume may indicate a strong long opportunity.
o High sell pressure and high volume may support short setups.
o Low volume or conflicting signals may call for caution.
5. Combine with other tools such as trend indicators, support/resistance zones, or price action patterns for more reliable trade setups.
________________________________________
Practical Example
• Sell Pressure: 70% → Suggests strong seller control; potential for short setups.
• Buy Pressure: 30% → Weak buying interest; long trades may carry risk.
• Volume Percentage: 120% → Indicates a surge in participation; movement may have greater validity.
________________________________________
Tips for New Traders
• Use this indicator as a confirmation tool rather than a standalone strategy.
• Begin on higher timeframes (4-hour or daily) to develop familiarity.
• Compare multiple examples to identify reliable patterns over time.
• Always incorporate proper risk management, including stop losses.
________________________________________
Disclaimer from aiTrendview
This indicator is intended solely for educational and informational use. It does not constitute investment advice, trade signals, or financial recommendations. aiTrendview and its affiliates are not liable for any trading losses incurred through use of this tool. All trading involves risk. Past performance of any indicator does not guarantee future results. Users should conduct independent research and consult with a certified financial advisor before making any trading decisions.

Exchanges Combined Volume📊 Exchanges Combined Volume
(Aggregated Multi-Exchange Volume: Binance, OKX, Bybit, etc.) by BIGTAKER*
🔍 Purpose
The Exchanges Combined Volume indicator aggregates real-time trading volumes from multiple global exchanges for a specific asset (e.g., a cryptocurrency).
Instead of relying on a single market, it provides a broader view of market activity, helping users detect abnormal volume behavior and increased participation across the entire market.
⚙️ Supported Exchanges
* USDT Markets
`Binance`, `OKX`, `Bybit`, `Bitget`, `Gate.io`
* USD Markets
`Coinbase`, `Bitfinex`, `Bitstamp`
* Default
Includes the current chart symbol’s native volume by default.
🧮 Core Calculation Logic
1. 📛 Symbol Normalization (cleanSymbol)
Prefixes such as `1000`, `10000`, `100000`, or `1M` (common in leveraged tickers) are automatically removed to extract the base token.
> Example:
> `1000PEPEUSDT` → `PEPEUSDT`
2. 📈 Volume Requests from External Exchanges
Volume is retrieved using the `` format (e.g., `'BINANCE:PEPEUSDT'`, `'COINBASE:BTCUSD'`).
Invalid or delisted pairs are safely ignored using `ignore_invalid_symbol=true`.
3. 📊 Total Volume Calculation
totalVolume = usdtVolume + usdVolume + currentSymbolVolume
The indicator sums the volume from all target exchanges plus the volume from the current chart symbol.
4. 📏 Comparison to Average Volume
* Period: `length = 60` (Simple Moving Average over 60 candles)
* A candle is considered **high-intensity** if:
5. 🎨 Visual Styling
| Condition | Color | Meaning |
| -------------------------- | --------------------- | ----------------------- |
| High-volume Bullish Candle | Light Green (#30db78) | Strong Buying Activity |
| High-volume Bearish Candle | Bright Red (#ff0000) | Strong Selling Activity |
| Normal Bullish Candle | Dark Green (#3c7058) | Regular Buying Volume |
| Normal Bearish Candle | Dark Red (#682e2c) | Regular Selling Volume |
📌 Use Cases
* Detect synchronized volume surges across major global exchanges.
* Identify pre-pump accumulation phases on altcoins.
* Combine with premium gap indicators (e.g., Kimchi Premium) to identify leading market sentiment.
* Confirm breakout momentum with multi-exchange volume validation.
📘 Notes & Warnings
* Listing differences across exchanges may result in **zero volume** on some platforms.
* Prefixes like `1000`, `1M`, etc., are automatically removed to **improve symbol matching accuracy**.
* As volume units are not standardized, this indicator is best suited for **absolute value analysis**, not ratio-based comparisons.

VSA-Stopping VolumeVSA Stopping Volume Indicator
Stopping Volume occurs when candles show decreasing body sizes (narrow spreads) while volume steadily increases.
Example chart:
As you see:
3 consecutive candles in same direction (all green OR all red)
Body sizes (spreads) decreasing progressively: Candle 1 > Candle 2 > Candle 3
Volume increasing progressively: Volume 1 < Volume 2 < Volume 3
This pattern indicates price absorption - increased buying/selling pressure but declining price movement, often signaling exhaustion and potential reversal.
Indicator Features
This indicator detects Stopping Volume candlestick clusters with two signal types:
🔹 BUY/SELL Signals: Generated when pattern occurs at support/resistance zones
🔹 Directional Alerts (▲-green, ▼-red): Generated when pattern occurs outside key levels
Trading Guidelines:
⚠️ Auto-drawn S/R zones are reference only - manual level plotting recommended for accuracy
📊 Best for scalping: M5, M10, M15 timeframes
🛡️ Stop Loss: Place beyond the S/R zone you're trading
🎯 Take Profit: Based on your risk management
Key Concept: Volume expansion + price contraction = potential reversal, especially at SnR levels.
Perfect for scalpers looking to catch reversals at critical zones!

VOL & AVG OverlayCustom Session Volume Versus Average Volume
Description:
This indicator will create an overlay on your chart that will show you the following information:
Custom Session Volume
Average For Selected Session
Percentage Comparison
Options:
Set Custom Time Frame For Calculations
Set Custom Time Frame For Average Comparison
Set Custom Time Zone
Enable / Disable Each Value
Change Text Color
Change Background Color
Change Table location
Example:
Set indicator to 30 period average. Set custom time frame to 9:30am to 10:30am Eastern/New York.
When the time frame for the calculation is closed , the indicator will provide a comparison of the current days volume compared to the average of 30 previous days for that same time frame and display it as a percentage in the table.
In this example you could compare how the first hour of the trading day compares to the previous 30 day's average, aiding in evaluating the potential volume for the remainder of the day.
Notes:
Times must be entered in 24 hour format. (1pm = 13:00 etc.)
This indicator is for Intra-day time frames, not > Day.
If you prefer data in this format as opposed to a plotted line, check out my other indicator: ADR & ATR Overlay

Volume Order Blocks [BigBeluga]Volume Order Blocks is a powerful indicator that identifies significant order blocks based on price structure, helping traders spot key supply and demand zones. The tool leverages EMA crossovers to determine the formation of bullish and bearish order blocks while visualizing their associated volume and relative strength.
🔵 Key Features:
Order Block Detection via EMA Crossovers:
Plots bullish order blocks at recent lows when the short EMA crosses above the long EMA.
Plots bearish order blocks at recent highs when the short EMA crosses below the long EMA.
Uses customizable sensitivity through the “Sensitivity Detection” setting to fine-tune block formation.
Volume Collection and Visualization:
Calculates the total volume between the EMA crossover bar and the corresponding high (bearish OB) or low (bullish OB).
Displays the absolute volume amount next to each order block for clear volume insights.
Percentage Volume Distribution:
Shows the percentage distribution of volume among bullish or bearish order blocks.
100% represents the cumulative volume of all OBs in the same category (bullish or bearish).
Order Block Removal Conditions:
Bullish order blocks are removed when the price closes below the bottom of the block.
Bearish order blocks are removed when the price closes above the top of the block.
Helps maintain chart clarity by only displaying relevant and active levels.
Midline Feature:
Dashed midline inside each order block indicates the midpoint between the upper and lower boundaries.
Traders can toggle the midline on or off through the settings.
Shadow Trend:
Shadow Trend dynamically visualizes trend strength and direction by adapting its color intensity based on price movement.
🔵 Usage:
Supply & Demand Zones: Use bullish and bearish order blocks to identify key market reversal or continuation points.
Volume Strength Analysis: Compare volume percentages to gauge which order blocks hold stronger market significance.
Breakout Confirmation: Monitor block removal conditions for potential breakout signals beyond support or resistance zones.
Trend Reversals: Combine EMA crossovers with order block formation for early trend reversal detection.
Risk Management: Use OB boundaries as potential stop-loss or entry points.
Volume Order Blocks is an essential tool for traders seeking to incorporate volume-based supply and demand analysis into their trading strategy. By combining price action, volume data, and EMA crossovers, it offers a comprehensive view of market structure and potential turning points.

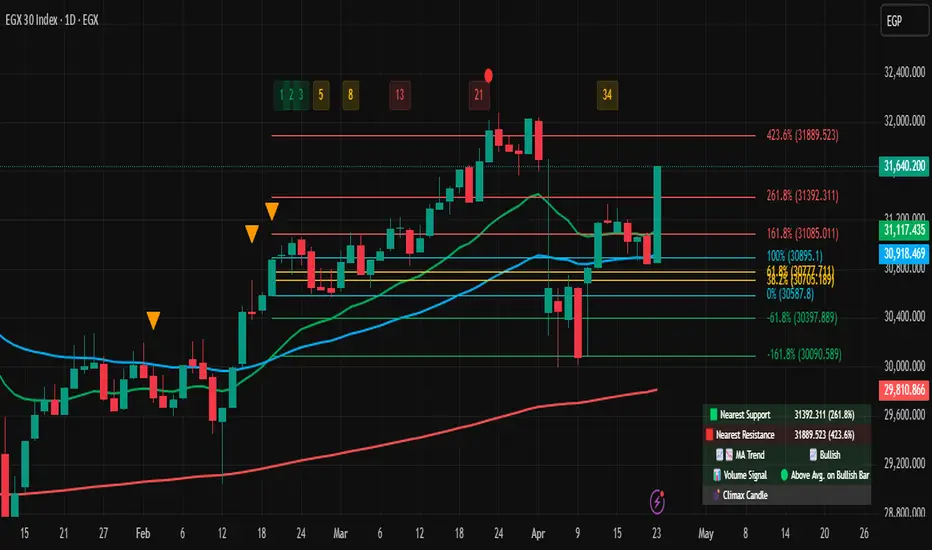
Range Breakout Signals [AlgoAlpha]OVERVIEW
This script detects range-bound market conditions and breakout signals using a combination of volatility compression and volume imbalance analysis. It identifies zones where price consolidates within a defined range and highlights potential breakout points with visual markers. Traders can use this to spot market transitions from ranging to trending phases, aiding in decision-making for breakout strategies.
CONCEPTS
The script measures volatility by comparing the ratio of the simple moving average (SMA) of price movements to their median value. When volatility drops below a threshold, the script assumes a range-bound market. It then tracks the cumulative volume of buying and selling pressure to assess breakout strength. The approach is based on the idea that market consolidation often precedes strong moves, and volume distribution can provide clues on the breakout direction.
FEATURES
Range Detection : Uses a volatility filter to identify low-volatility zones and marks them on the chart with shaded boxes.
Volume Imbalance Analysis : Evaluates cumulative up and down volume over a confirmation period to assess directional bias.
Breakout Signals : When price exits a detected range, the script plots breakout markers. A ▲ symbol indicates a bullish breakout, and a ▼ symbol indicates a bearish breakout. Additional "+" markers indicate strong volume imbalance favoring the breakout direction.
Adaptive Timeframe Volume Analysis : The script dynamically adjusts its volume calculation based on the chart’s timeframe, ensuring reliable signal generation across different trading conditions.
Alerts : Notifies traders when a new range is detected or when a breakout occurs, allowing for automated monitoring.
USAGE
Traders can use this script to identify potential trade setups by entering positions when price breaks out of a detected range. For breakout confirmation, traders can look at volume imbalance cues—bullish breakouts with strong buying volume may indicate sustained moves, while weak volume breakouts may lead to false signals. This script is particularly useful for breakout traders, range traders seeking to fade breakouts, and those looking to automate trade alerts in volatile markets.

VSA Volume + Fibonacci (Volunacci)Overview
This indicator combines Volume Spread Analysis (VSA) with Fibonacci levels to identify key price zones based on volume behavior. It helps traders determine potential support and resistance levels influenced by volume strength.
How It Works
Volume Calculation
The indicator calculates volume levels based on the selected timeframe.
It identifies high volume spikes and low volume dips, which are critical for detecting supply and demand shifts.
It uses a simple moving average (SMA) of volume to smooth fluctuations.
Fibonacci Levels Integration
When a high-volume event is detected, the indicator records the highest high and lowest low of that candle.
It then plots Fibonacci retracement and extension levels to highlight potential price reaction zones.
Negative Fibonacci levels are included to identify possible deep retracements.
Visual Features
The indicator adapts to both light and dark themes for better visibility.
Fibonacci lines are color-coded based on key retracement and extension levels.
A table displaying key Fibonacci levels and their corresponding prices is provided for quick reference.
Why Is This Indicator Useful?
It helps traders spot accumulation and distribution phases by analyzing volume at key price points.
The combination of VSA and Fibonacci allows traders to confirm trend strength and identify potential reversal points.
Works well for trend-following strategies, scalping, and breakout trading.
How to Use This Indicator?
Use it to confirm breakouts or reversals at Fibonacci levels when volume supports the move.
Watch for high-volume spikes near key Fibonacci zones—these can signal strong trend continuation or reversal.
Use the displayed Fibonacci table to quickly assess price reaction levels.
Credits
This script was inspired by the Hidden Gap’s VSA Volume indicator by HPotter and has been enhanced by integrating Fibonacci-based analysis.
Liquidity Depth [AlgoAlpha]OVERVIEW
This script visualizes market liquidity by identifying key price levels where significant volume has transacted. It highlights zones of high buying and selling interest, helping traders understand where liquidity is accumulating and how price may respond to these areas. By dynamically tracking volume at highs and lows, the script builds a real-time liquidity profile, making it a powerful tool for identifying potential support and resistance levels.
CONCEPTS
Liquidity depth analysis helps traders determine how price interacts with supply and demand at different levels. The script processes historical volume data to distinguish between high-liquidity and low-liquidity zones. It assigns transparency levels to plotted lines , ensuring that more relevant liquidity areas stand out visually. The script adds a profile to show the depth of liquidity (derived from historical volume data) for levels above and below the current price
FEATURES
Liquidity Levels: Tracks liquidity levels based on volume concentration at price high and lows.
Volume-Based Transparency: More significant liquidity levels are displayed with higher visibility, showing their significance.
Interpolation: interpolates the bullish and bearish liquidity depth at a user defined range away from the price, helping in comparing the liquidity amounts between bullish and bearish.
Depth Profile: Allows traders to visualize depth of liquidity in a more quantitative and clearer way than the liquidity levels/list]
USAGE
This indicator is best used to track liquidity levels and potential price reaction areas. Traders can adjust the Liquidity Lookback setting to analyze past liquidity levels over different historical periods. The Profile Resolution setting controls the granularity of liquidity depth visualization, with higher values providing more detail. The script can be applied across different timeframes, from intraday scalping to swing trading analysis. The plotted liquidity zones provide traders with insights into where price may encounter strong support, resistance, or potential liquidity-driven reversals.

Intrabar Volume Distribution [BigBeluga]Intrabar Volume Distribution is an advanced volume and order flow indicator that visualizes the buy and sell volume distribution within each candlestick.
🔔 Before Use:
Turn off the background color of your candles for clear visibility.
Overlay the indicator on the top layout to ensure accurate alignment with the price chart.
🔵 Key Features:
Inside Bar Volume Visualization:
Each candlestick is divided into two columns:
Left column displays the sell % volume amount.
Right column displays the buy % volume amount.
Provides a clear representation of buyer-seller activity within individual bars.
Percentage Volume Labels:
Labels above each bar show the percentage share of sell and buy volume relative to the total (100%).
Quickly assess market sentiment and volume imbalances.
Point of Control (POC) Levels:
Orange dashed lines mark the POC inside each bar, indicating the price level with the highest traded volume.
Helps identify key liquidity zones within individual candlesticks.
Multi-Timeframe Volume Analysis:
The indicator automatically uses a timeframe 20-30 times lower than the current one to gather detailed volume data.
For each higher timeframe candle, it collects 20-30 bars of lower timeframe data for precise volume mapping.
Each bar is divided into 100 volume bins to capture detailed volume distribution across the price range.
Bins are filled based on the aggregated volume from the lower timeframe data.
Lookback Period:
Allows traders to select how many bars to display with delta and volume information.
The beginning of the selected lookback period is marked with a gray line and label for quick reference.
Indicator displays up to 80 bars back
🔵 Usage:
Order Flow Analysis: Monitor buy/sell volume distribution to spot potential reversals or continuations.
Liquidity Identification: Use POC levels to locate areas of strong market interest and potential support/resistance.
Volume Imbalance Detection: Pay attention to percentage labels for quick recognition of buyer or seller dominance.
Scalping & Intraday Trading: Ideal for traders seeking real-time insight into order flow and volume behavior.
Historical Analysis: Adjust the lookback period to analyze past price action and volume activity.
Intrabar Volume Distribution is a powerful tool for traders aiming to gain deeper insight into market sentiment through detailed volume analysis, allowing for more informed trading decisions based on real-time order flow dynamics.

Volume Data Customized TimeframeThe "Volume Data Customized Timeframe" (VolData CTF) indicator provides traders with an enhanced volume analysis tool that aggregates buy and sell volume over a user-defined timeframe. It enables a comparative assessment of bullish and bearish volume trends, offering deeper insights into market sentiment. The indicator features a customizable display table with user-selectable themes and positioning, providing essential volume metrics for improved trading decisions.
1. Introduction:
The "Volume Data Customized Timeframe" indicator is designed to help traders analyze volume trends across different timeframes. It allows users to customize the period for volume calculations, view the ratio of selling to buying volume, and present the data in a user-friendly table format.
2. Features:
Selectable timeframe for volume analysis (default: chart timeframe)
Calculation of bullish (buy) and bearish (sell) volume
Customizable table size, theme, and positioning
Displays key volume metrics:
Total Buy Volume
Total Sell Volume
Sell/Buy Volume Ratio
Analysis period in minutes, days, weeks, or months
3. Indicator Inputs:
Average Volume Lookback (n): Number of bars used to calculate volume statistics.
Select Timeframe: Custom timeframe for volume calculations (leave empty to use the chart's timeframe).
Table Size: Choose from Small, Medium, or Big to adjust text size.
Table Theme: Choose between Light and Dark themes.
Table Position: Place the table in any corner of the chart (top-left, top-right, bottom-left, bottom-right).
4. How It Works:
The indicator retrieves volume data for the selected timeframe.
It aggregates bullish and bearish volume based on the lookback period.
The sell-to-buy volume ratio is calculated and color-coded (green for bullish dominance, red for bearish dominance).
The volume statistics are displayed in a customizable table for easy reference.
5. Interpretation:
Δ BUY VOL: Represents the total volume of bullish (up-closing) bars within the lookback period.
Δ SELL VOL: Represents the total volume of bearish (down-closing) bars within the lookback period.
Δ SELL/Δ BUY: The ratio of bearish to bullish volume; values above 1 indicate more selling pressure, while values below 1 indicate buying dominance.
Period (M/D/W/M): Displays the selected timeframe for volume aggregation.
Price and Volume Divergence Analyzer
How to Use the Indicator
Main Purpose:
Identify divergences between price movement, the volume line, and the weighted volume line to predict potential reversals.
Volume Line Explanation:
At zero: Equal buying and selling volume.
At 1: Double the buying volume vs. selling.
At -1: Double the selling volume vs. buying.
Divergence:
Price rising, volume line falling: Sellers offloading to buyers—likely reversal downward.
Price falling, volume line rising: Buyers stepping in—likely reversal upward.
Higher/Lower Volume Movement Line:
At zero: Equal volume required for price movement.
At 1: High efficiency—half the volume needed to move price.
At -1: Low efficiency—double the volume needed to move price.
Above volume line: Movement aligns with efficient volume.
Below volume line: Inefficient price movement.
Candle Fill Colors:
Shaded based on whether the current close is higher or lower than the previous close.
Settings Overview
EMA Settings:
Timeframe Selection:
Use a lower timeframe than your chart for accuracy. Avoid selecting a timeframe higher than your chart.
EMA Length Option:
Default: Sets lengths automatically (EMA = 14, EMA of EMA = 3).
User Input: Allows custom EMA length.
Calculation Type:
EMA: Standard exponential moving average.
EMA of EMA: Applies EMA three times for smoother values.
Volume Line Settings:
Line Width: Adjust thickness.
Colors:
More Buying: Green (default).
More Selling: Red (default).
Higher/Lower Volume Movement Line:
Line Width: Adjust thickness.
Colors:
Higher Volume Movement: Indicates higher volume required.
Lower Volume Movement: Indicates lower volume required.
Up/Down Candle Fill:
Colors:
Up Candle: Green (default).
Down Candle: Red (default).
Transparency: Adjust percentage for visibility.
Balance Line Settings:
Line Width and Color: Equilibrium line showing equal buying/selling volume at zero.
Advanced Volume-Driven Breakout SignalsThe "Advanced Volume-Driven Breakout Signals" indicator is a cutting-edge tool designed to help traders identify high-potential trading opportunities through sophisticated volume analysis techniques. This indicator integrates volume flow analysis, moving averages, and Relative Volume (RVOL) to provide a comprehensive view of market conditions, going beyond traditional Volume Spread Analysis (VSA) methods.
Key Features:
Volume Flow Analysis: Distinguishes bullish and bearish volume flows with distinct colors, making it easier to visualize market sentiment and potential breakout points.
Volume Flow Moving Averages: Calculates moving averages for volume using various methods (SMA, EMA, WMA, HMA, VWMA), accommodating different trading strategies. This includes settings for adjusting the type of moving average and its period, as well as thresholds for high, medium, and low volume levels.
Volume Spikes Detection: Identifies significant volume spikes based on user-defined multipliers and moving averages, highlighting unusual trading activity.
Volume MA Cloud Settings: Computes general moving averages of volume to track trends and detect deviations. This feature includes options to select different moving average types and adjust thresholds for detecting high volume activity.
Relative Volume (RVOL): Measures current volume relative to historical averages, triggering signals when RVOL exceeds predefined thresholds, indicating notable changes in trading activity.
Entry Conditions: Provides clear long and short entry signals based on combined volume flow conditions and RVOL, offering actionable trading opportunities.
Volume Visualization:
— Bullish Volume Flow: Light and dark green bars indicate bullish volume flow.
— Bearish Volume Flow: Light and dark red bars denote bearish volume flow.
— High Volume Bars: Highlighted in yellow, and extreme volume bars in orange for additional context. These bars are plotted for visual aid and do not directly influence trade signals, focusing instead on the quality and strength of the volume flow.
Alerts: Allows users to create alert notifications for long and short entry signals when the criteria are met, enabling traders to respond promptly to trading opportunities.
Usage:
Overlay: Apply the indicator directly to your price chart to visualise real-time signals and volume conditions.
Customisable: Adjust settings for moving averages, RVOL, and other parameters to match your trading strategy and preferences.
Comparison to VSA Scripts: The "Advanced Volume-Driven Breakout Signals" indicator extends beyond traditional VSA scripts by incorporating a wider range of analytical features. While VSA primarily focuses on volume spread patterns and price action, this indicator offers enhanced functionality with advanced RVOL metrics, customizable moving averages, and detailed volume spike detection, making it a more versatile tool for identifying breakout opportunities and managing trades. It is particularly effective when used alongside key levels and order blocks.
Acknowledgements: Special thanks to @oh92 and @goofoffgoose for their invaluable scripts, which served as inspiration in the development of this advanced trading indicator.
Notes: The script is continually evolving, with ongoing refinements aimed at enhancing accuracy and performance.

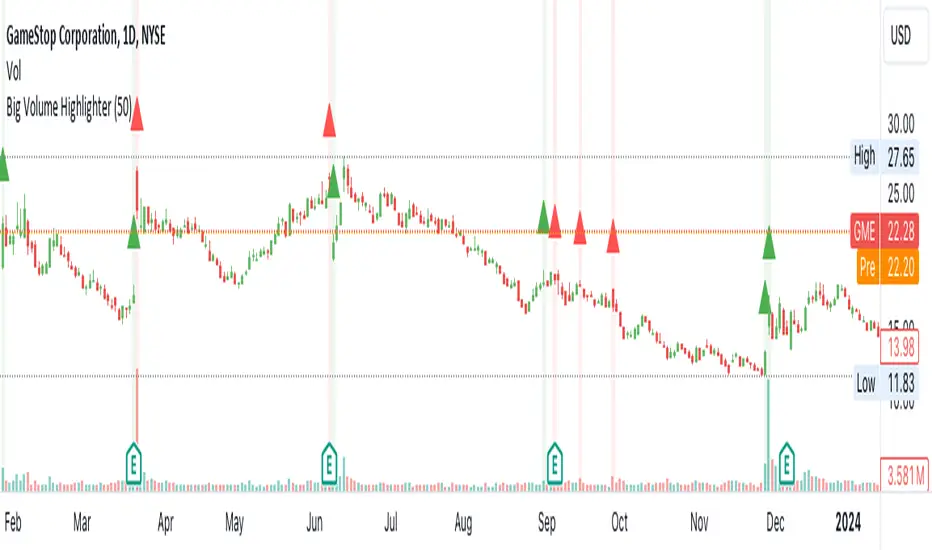
Big Volumes HighlighterBig Volumes Highlighter
Overview:
The "Big Volume Highlighter" is a powerful tool designed to help traders quickly identify candles with the highest trading volume over a specified period. This indicator not only highlights the most significant volume candles but also color-codes them based on the candle's direction—green for bullish (close > open) and red for bearish (close < open). Whether you're analyzing volume spikes or looking for key moments in price action, this indicator provides clear visual cues to enhance your trading decisions.
Features:
Customizable Lookback Period: Define the number of candles to consider when determining the highest volume.
Automatic Color Coding: Candles with the highest volume are highlighted in green if bullish and red if bearish.
Visual Clarity: The indicator marks the significant volume candles with a triangle above the bar and changes the background color to match, making it easy to spot important volume events at a glance.
Use Cases:
Volume Spike Detection:
Quickly identify when a large volume enters the market, which may indicate significant buying or selling pressure.
Trend Confirmation: Use volume spikes to confirm trends or potential reversals by observing the direction of the high-volume candles.
Market Sentiment Analysis: Understand market sentiment by analyzing the direction of the candles with the biggest volumes.
How to Use:
Add the "Big Volume Highlighter" to your chart.
Adjust the lookback period to suit your analysis.
Observe the highlighted candles for insights into market dynamics.
This script is ideal for traders who want to incorporate volume analysis into their technical strategy, providing a simple yet effective way to monitor significant volume changes in the market.