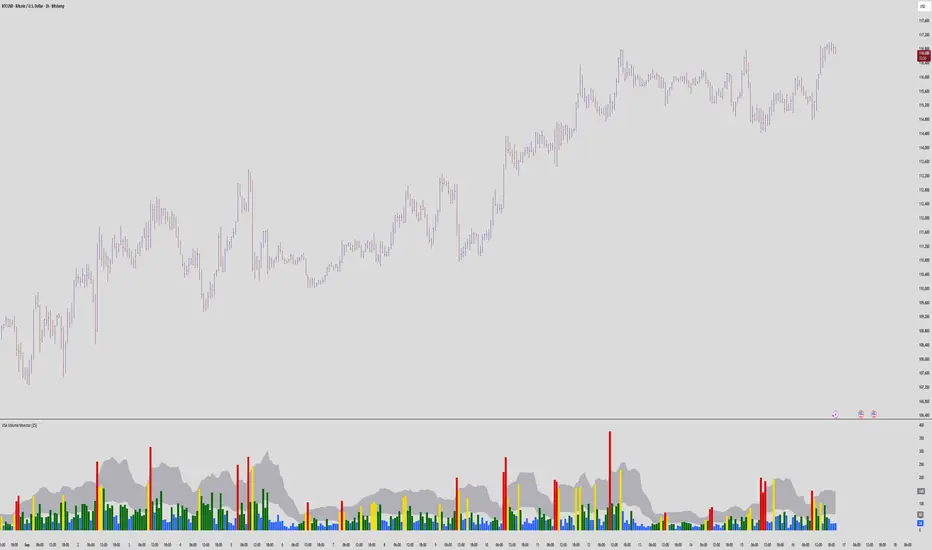
VSA with Absorption Proxy for Holmes and Bookmap StyleVSA + Absorption Proxy – Holmes / Bookmap Style (No Delta Data Required)
This open-source strategy is a simplified, VSA (Volume Spread Analysis) inspired scalper that approximates **absorption** and **rejection** patterns commonly observed in professional order-flow tools (Bookmap, Holmes, Jigsaw, etc.) — using only standard OHLCV data.
Core Concept & Why This Proxy?
In VSA and order-flow trading, **absorption** occurs when aggressive selling is met with strong buying support (high volume + wide spread + reversal up), often signaling exhaustion of sellers and potential reversal/continuation up. **Rejection** is the mirror: aggressive buying met with strong selling (high volume + wide spread + reversal down).
Because true bid/ask delta is not available in standard Pine Script, this script uses a directional volume proxy:
- delta ≈ volume × (close - open) / (high - low)
- Combined with wide spread (vs ATR) + high volume (vs SMA) + delta flip
This creates a reasonable proxy for spotting climactic volume bars where one side gets absorbed/rejected.
Entry & Exit Logic
Long (Absorption Bull):
- High volume bar (volume > SMA(volume,20) × multiplier)
- Wide spread (range > ATR(14) × multiplier)
- Bullish candle (close > open)
- Delta turns positive after being negative previous bar
Short (Rejection Bear): mirror logic (bearish candle + delta turns negative)
Risk Management (fixed %):
- Stop Loss: entry low/high adjusted by riskPct (default 1%)
- Take Profit: risk × rrTarget (default 3.5:1)
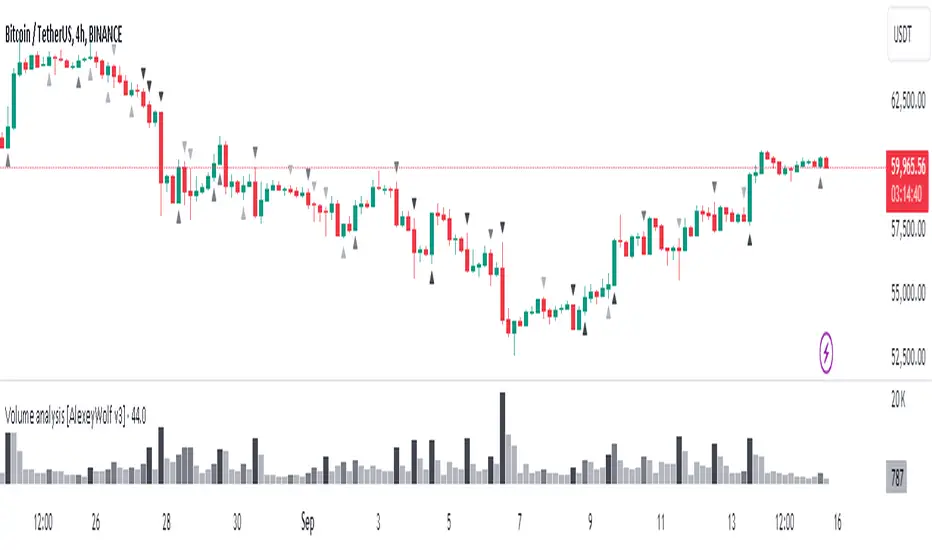
Visuals
- Green background + triangle below bar → Absorption Bull signal
- Red background + triangle above bar → Rejection Bear signal
Important Realism & Backtesting Guidelines
To avoid misleading results, publish/test with:
- Initial Capital: $10,000 – $50,000 (realistic retail/futures account)
- Position sizing: 1–3% equity per trade (adjust via strategy properties)
- Commission: $4–$10 round-turn per contract (futures) or 0.03–0.05% (forex/stocks)
- Slippage: 1–4 ticks (futures) or 0.5–2 pips (forex) — higher during news
- Dataset: ≥12–36 months on chosen timeframe (aim for 400–1000+ trades)
- Risk per trade: 0.5–2% max — never exceed sustainable levels
Expectations:
- Works best on high-volume instruments (NQ, ES, GC, BTC, major forex) during active sessions
- Fewer signals in low-volatility/choppy periods
- Drawdowns common during strong trends — this is a counter-trend / absorption catcher, not trend-following
- News events (FOMC, NFP, earnings) can cause false signals — avoid or widen stops
How to Use
1. Apply to high-liquidity symbols (NQ1!, ES1!, GC1!, BTCUSD, EURUSD, XAUUSD)
2. Timeframes: 3m–15m for scalping, 30m–1h for swing context
3. Trade during high-volume sessions (London/NY overlap for forex, US open for futures)
4. Look for confluence:
- Absorption + nearby support / demand zone → stronger long
- Rejection + nearby resistance / supply zone → stronger short
5. Forward-test on demo extensively — absorption setups are high-conviction but low-frequency
6. Always use proper position sizing — never risk more than 1–2% per trade
Publish Recommendation
- Use a clean chart: only this strategy, no extra indicators/drawings
- Show realistic Strategy Tester results with commission/slippage applied
- Screenshot during active session with visible absorption/rejection signal + background tint
Educational tool — open-source for learning VSA/order-flow concepts. This is a proxy approximation — not true delta/order-flow. Trading involves substantial risk of loss. Test thoroughly and trade responsibly.
Feedback welcome — especially parameter tuning ideas for different instruments!
Pine Script®策略