[RS]ZigZag Percent Reversal - Helper - Draw Patterns - Part 2Helper script to display patterns on chart.
波浪分析
[RS]ZigZag Percent Reversal - Helper - Draw Patterns - Part 1Helper script to display patterns on chart.
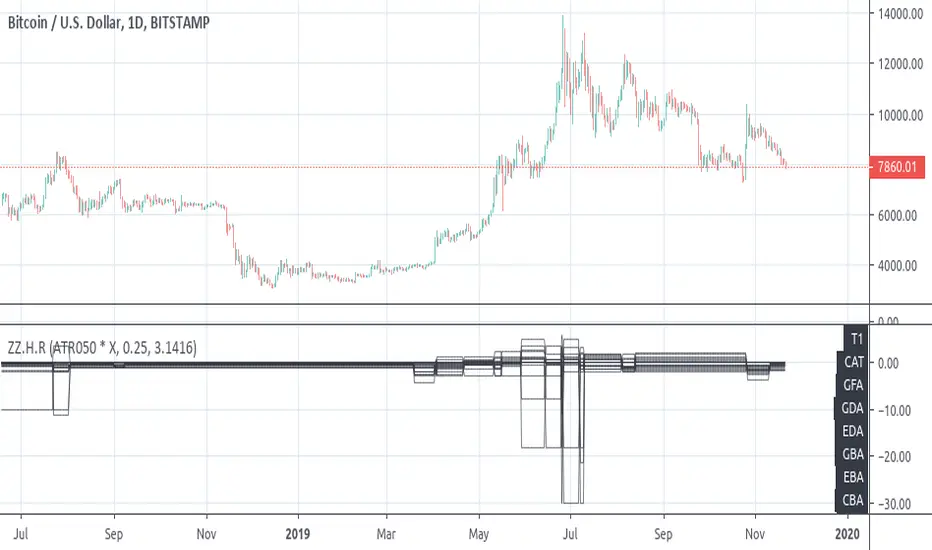
[RS][V4]ZigZag Percent Reversal - Helper - AntiSlopeEXPERIMENTAL:
A helper script to map the Anti derivative slopes.
zigzag newThis is just experimenal zigzag
The zigzag % is adaptation of Ricardo santos old Zigzag %
the pivot are from pine script manual
So it try to cross them together
I think it need much work
but as i idea i put it for anypne who is interested

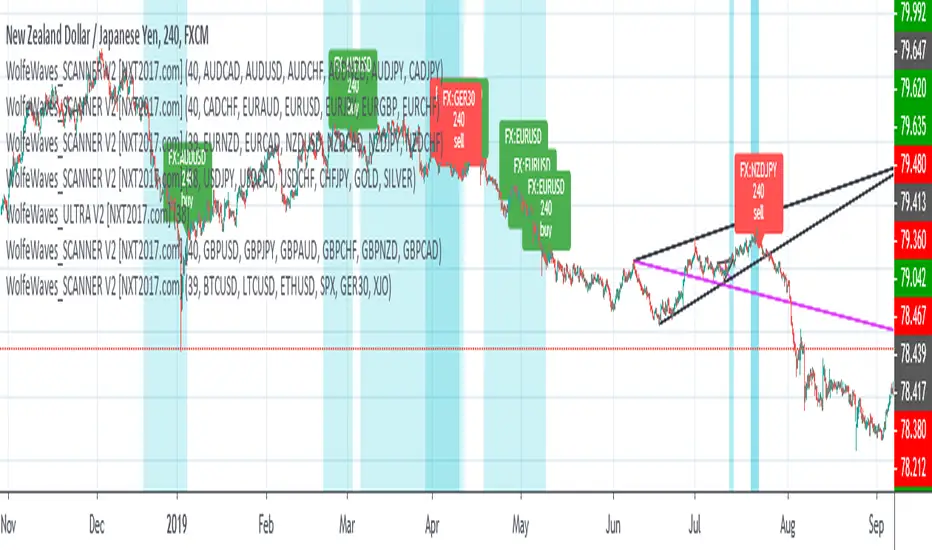
WolfeWaves SCANNER V2 - Market Scanner for Wolfe Wave Pattern
HI BIG PLAYERS AROUND THE WORLD,
this script allow to find Wolfe Wave Pattern in any market at the same time. One indicator can scan 6 markets/symbols - what ever you choose. For more markets you have to take the indicator more then once in your chart (look on my posting chart above).
Parallel the indicator gives signals as soon as Wolfe Waves are near finish pattern on point 5. In the default settings, the signals are displayed with a blue background on the chart. The markets with Wolfe Waves can you then read on the label in your chart.
The timeframe you currently has open is also the timeframe where the market scanner analyze the other markets / symbols in the background.
WolfeWaves SCANNER V2 is offered for sale. More information can be found below in the signature.
However, anyone can test this indicator for once without any registration in a 3 day trial. You can request access with a simple message to me.
Another trial of 7 days is included in the offer on my website - before the first payment will done.
When testing, please check whether your system requirements are sufficient. The many labels require a lot of memory from your computer.
For more great indicators everyone is invited to follow me on TradingView.
Kind regards
NXT2017
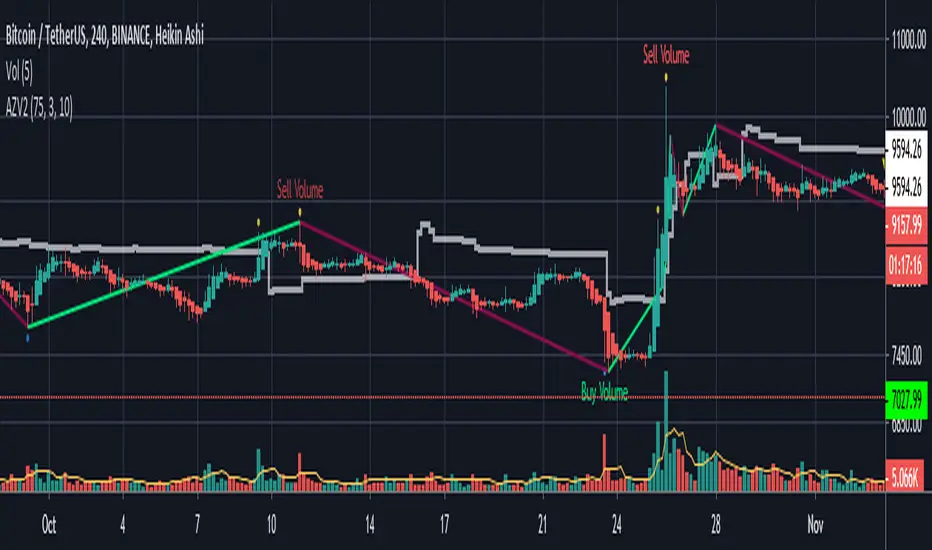
AZV Indicator
AVZ
Market is changing by 4 Factors which are (PVTTI - Price - Volume - Trades - Time
This indicator is a hybrid, with a combination of leading indicators and lagging trending indicators combined into one,and it's using mostly the 3 factors_ PVT which will help you getting good trades .
Volume :-
Leading indicators such as Volume Spikes , Average Volume Spikes (VolMA) ,and a special Spike calculation using RSI as a function with volume as a source .
Price:-
SemiLead indicators such as Aroon Indicator , RSI .
Time and Price Combination :-
Trend Recognition using Harmonic and Zigzag implementation from 'RicardoSantos' .
.
www.investopedia.com
Volatility Recognition : Using a special calculation to get the average called ( ZScore ) with Vwap implementation .
en.wikipedia.org
www.investopedia.com
How to use ?
This indicator is using number of bars of the last wave whatever if it's UP wave or Down wave .
Type number of bars on the specified area of the wave ( Bars Of Wave )
How many NO. Bar s to get accurate levels ?
1- If you are searching for a Support level , you have to count the number of bars of last UP wave from its low to it's high .
2- If you are searching for a Resistant level , you have to count the number of bars of last Down wave from its high to its low .
Buying Signal and Selling Signal ?
The indicator tries to identify levels that Buying Volume enter in the same way for Selling Volume .
Katy trade SystemThis is a script Simple with 4 MA’s and the Bollinger Band.
A sign is issued when the conditions are met.

ZigZag - lucemanb
THIS CODE IS BASED FROM THE MT4 ZIGZAG INDICATOR
THE ZIGZAG SETTINGS FOR THE MAIN ONE ON TRADINGVIEW DO NOT WORK THE SAME AS MT4
I HOPE U LOVE IT
I have had tons of experience on the ZIGZAG indicator and thought this might help someone.
Enjoy this code. Zigzag is a good indicator in many ways and people underestimate it because of its repainting
Check out some work ave done with this script. This is some intense angle trading requested by someone


Trend Direction Helper (ZigZag and S/R and HH/LL labels)Hey everyone
First of all, I'd like to thank Ricardo Santos, Backtest Rookies for the inspiration for this script.
Actually, most of it is coming from them and I only mixed them up (and added my secret sauce ^^). If some of you are not thinking about a trading secret sauce, please get serious for a moment :)
Some of you asked me how I do to set the trend direction. You all understood that if you get an UP label, then the price should go up and vice-versa for down.
But it's not so easy to define the good signals for each asset and each timeframe. I'm going to repeat what I said yesterday because ... well... that's what trading is about
So quoting myself here "The inputs set by default will have to be changed for your asset/timeframe and can't be generic for everything. You have to play with the inputs until the signals will make sense to you
The indicator/strategy with a unique configuration that you'll never check or update according to the market condition DOES NOT exit. "
BUT... a bit of patience and practice and you might do wonders.
The Method
I never realized until now but by connecting the higher highs/lower lows, I was drawing zigzag lines.
The Zig Zag Master is Ricardo Santos . Please give him a follow, he's awesome
For those who don't want to draw on the chart or (my preferred choice) need some inspiration to define your trend directions, this script is for YOU (and your family, your pet, your girlfriend/boyfriend, ...)
I think that each asset/timeframe chart has its own history. What worked in a post could work in the future.
In that regard, if a trend direction worked in the past, that's the parameter that I'll use to trade with it in a demo account and make sure it's relevant. If not then I will adjust
If you're trading with new indicators or a new method right away on your real trading account, you're gonna have a bad time imgflip.com
Lines EVERYWHERE
The script draws the classical horizontal pivots + the zig zag lines + the Higher Highs/Lower Lows label in just 1 script. I'm very excited to share a script (on which I coded 100 lines out of 500) but no one else did it
The horizontal pivots part are coming from Backtest Rookies
For more security, you can add a pullback on a moving average after getting a signal. Pullbacks are necessary to limit any eventual loss or maximize your gains by getting in the trend sooner.
I really give you a solid method and a great script in my opinion. 6 years of experience given away for FREE :p (when Dave will start thinking as a business man instead :O)
Does it repaint ?
Getting this question twice a day. You guys are obsessed with the repainting :)
Short answer, yes because it will calculate the pivots and zig zags whenever new higher highs/lower lows will be formed.
However, the trend direction code is based on the candle close so it shouldn't repaint. If it does, please let me know
See you all on Monday
Love you all
Dave
____________________________________________________________
Be sure to hit the thumbs up. Building those indicators take a lot of time and likes are always rewarding for me :) (tips are accepted too)
- If you want to suggest some indicators that I can develop and share with the community, please use my personal TRELLO board
- I'm an officially approved PineEditor/LUA/MT4 approved mentor on codementor. You can request a coaching with me if you want and I'll teach you how to build kick-ass indicators and strategies
Jump on a 1 to 1 coaching with me
- You can also hire for a custom dev of your indicator/strategy/bot/chrome extension/python
Disclaimer:
Trading involves a high level of financial risk, and may not be appropriate because you may experience losses greater than your deposit. Leverage can be against you.
Do not trade with capital that you can not afford to lose. You must be aware and have a complete understanding of all the risks associated with the market and trading. We can not be held responsible for any loss you incur.
Trading also involves risks of gambling addiction.
Please notice I do not provide financial advice - my indicators, strategies, educational ideas are intended to provide only some source code for anyone interested in improving their trading
The proprietary indicators and strategies developed by Best Trading Indicator, the object of intellectual property rights are and remain the exclusive property of Best Trading Indicator, at the exclusion of images and videos and texts free of rights or provided by the Company or external legal or physical person.
No assignment of intellectual property rights is carried out through these Terms and Conditions.
Any total or partial reproduction, modification or use of these properties for any reason whatsoever is strictly prohibited without the express written authorization of the Company.


Master000 automation trade indicatorIndicator description:
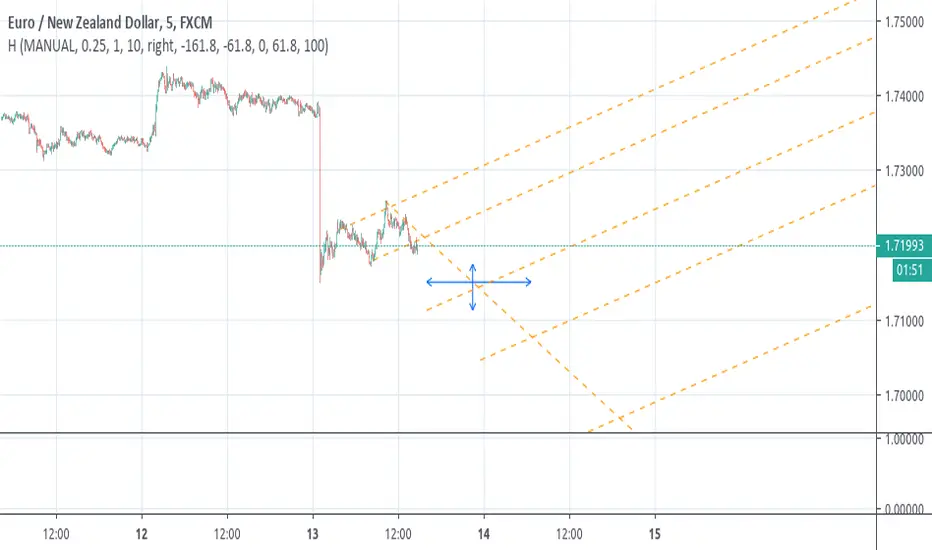
The Master000 indicator is four indicators built into one. They work together to provide trading insights including trend and momentum, reversal points, potential entry points, and projections of future reversal or breakout levels.
Trend power
Shows strength of trend and a change in momentum
Red: The trend has been determined and is short
Lime: The trend has been determined and is long
Aqua: Continuation of the down trend, but showing down trend is in weakness.
Fuchsia: Continuation of the up trend, but showing up trend is in weakness
Yellow: Trend is reversing or trend is missing direction
Zig Zag Trend Lines (Major/Minor )
Major
The trend is graphed based on changes in price. The major trend should be used in deciding which way to enter the trade.
Min or
The minor trend is similar to the major but it is used to determine your entry point. It is easy to spot higher highs or lower lows. Take not when the minor trend fails to set a new high or a new low.
Channels
These dotted lines are provided as a quick guide to determine where the trend is headed. They show if price is getting squeezed and we should look for a break out using a flag or pennant pattern or is there an ever widening channel creating a broadening wedge. Look for hesitation or a reversal near the channel lines.
Entry Signals
Should be taken as a suggestion and not taken everyone. Do your research before entering any trade. There could also be many profitable trades even when an entry signal was not given.
Not good now, just reference for you.
Strategies for using the indicator
Major and minor trendlines: Once major trendline has been set look for a pullback for an entry. Look for a reversal in the major trendline when the minor trendline fails to create a higher high or lower low.
Trend Power: Look for an optimal entry point when the trend power turns teal. This mean the trend is reversing and should be an optimal place for an entry going against the previous trend.
Indicator Explain video at YouTube:
youtu.be
Anyone can apply to use it, you will get two weeks for testing it. [/b
Just click 'like', when I get the message, I will add you as 'invite only' indicator.
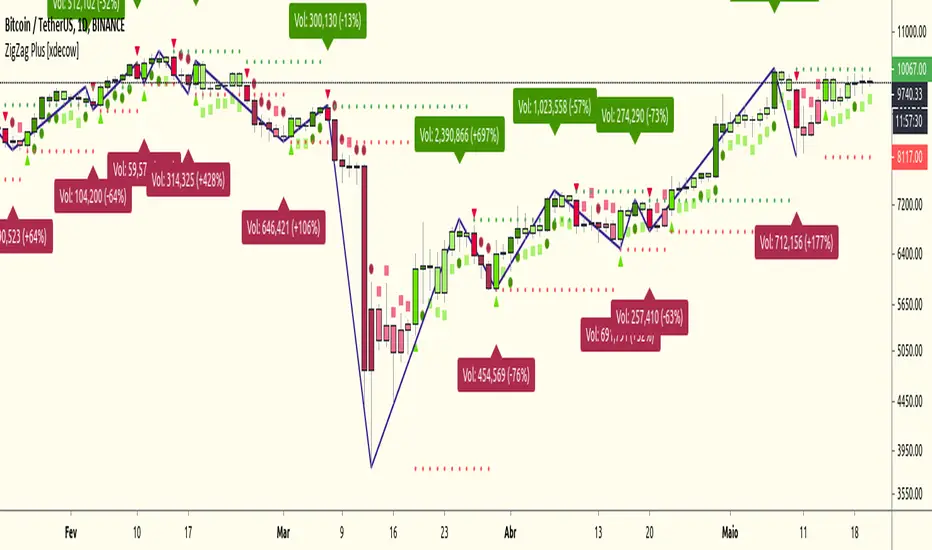
ZigZag Plus [xdecow]A ZigZag Like based on candle close.
A lot of options that can be hide in options.
Triangle/bright - reversal confirmation candle
Circle/dark - higher/lower candle breakout
Square/light - Insidebar
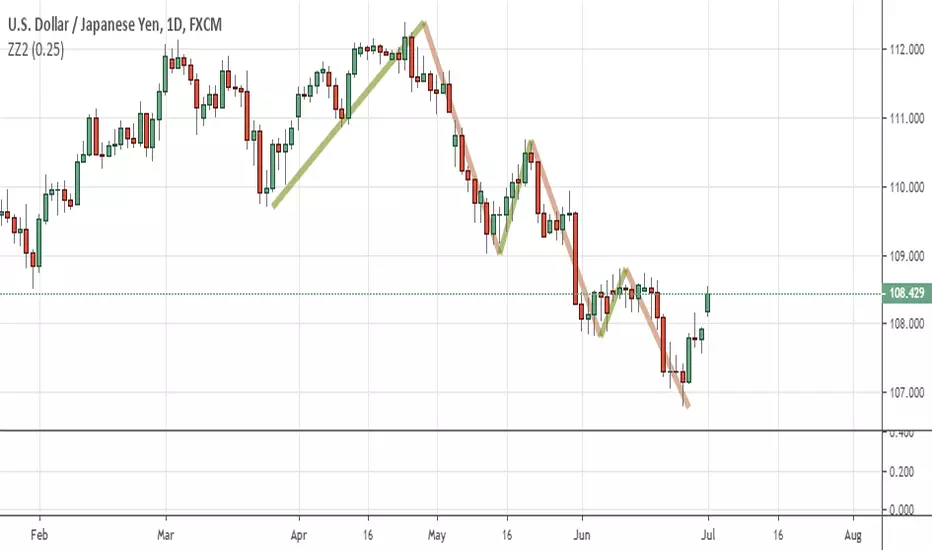
Straightened Price CurveThis is another among zillions of attempts at a moving average of a security. More precisely, two attempts at one go). The zzoid function generates a zigzag-like MA that can adopt different forms. The stepline function creates, sure enough, a stepline.

Voss Predictive Filter█ OVERVIEW
The Voss Predictive Filter (VPF) is a negative group delay (NGD) filter that anticipates cyclical price movement through phase compensation. The VPF isolates band-limited cyclical components via a bandpass filter, then applies negative group delay to shift the signal's phase forward, causing the output to lead the input by a fraction of the cycle period.
Based on Dr. John F. Ehlers' "Voss Predictive Filter" article in Technical Analysis of Stocks & Commodities (TASC) magazine, the VPF displays a predictive oscillator with optional dynamic threshold bands for identifying significant cycle behavior. The indicator is timeframe-agnostic - the mathematics work identically from tick charts to monthly bars, though shorter timeframes require more careful parameter selection due to noise.
█ CONCEPTS
Bandpass Filtering
A bandpass filter isolates price activity within a specific frequency range, removing both high-frequency noise and low-frequency trend drift. The VPF uses a second-order IIR (Infinite Impulse Response) bandpass filter characterized by the center frequency (the Bandpass Period input) and bandwidth. The center frequency determines which cycle period the filter emphasizes, while bandwidth controls the damping coefficient - how tightly the filter focuses around that frequency. Before filtering, the source is debiased via 2-bar momentum to remove DC offset, ensuring the filter operates around a true zero centerline.
Negative Group Delay Filtering
The predictive capability stems from negative group delay (NGD) - a filter characteristic where output appears to "lead" the input. Most causal filters introduce lag (positive group delay), but by combining the bandpass filter output with appropriately weighted past values, the VPF achieves negative group delay characteristics.
This is a universal NGD filter application for band-limited signals: the bandpass filter isolates the cyclical component of interest, then the NGD stage advances the phase within this limited frequency range to create an anticipatory output. This isn't statistical forecasting; it's phase compensation that shifts the signal's timing forward, causing peaks and troughs to appear before they occur in the bandpass output.
Negative Group Delay Stage
The NGD stage combines the current bandpass output with weighted historical values to produce an output that leads the input. By subtracting a weighted average of past deviations from a scaled version of the current filter value, the algorithm advances the signal's phase: peaks and zero-crossings in the voss output appear before the corresponding events in the bandpass filter.
The prediction order (`3 * Prediction Multiplier`) controls how many past values contribute to the phase advance. Higher orders provide smoother output but reduce the leading effect; lower orders maximize anticipation at the cost of stability.
█ INTERPRETATION
Zero-Line Crossovers
Crossings above zero suggest bullish momentum in the filtered cycle; below zero suggests bearish momentum. Crossings from near-zero regions are most reliable, as extreme excursions need time to return to equilibrium.
Threshold Bands
Threshold bands define "significant" deviation. Breaches indicate unusually strong behavior and can serve as:
• Trend confirmation when aligned with price direction
• Overbought/oversold warnings at extremes
• Trade entry filters (requiring threshold breach in the intended direction)
Threshold Mode affects sensitivity: MAD (outlier-resistant), Standard Deviation (volatility-sensitive), Percentile Rank (fixed probability bands).
Alert Conditions
Four built-in alerts trigger on bar close (no repainting): Above +Threshold (strong bullish cycle), Below -Threshold (strong bearish cycle), Above Zero (bullish phase shift), Below Zero (bearish phase shift).
█ SETTINGS & PARAMETER TUNING
Voss Predictive Filter
• Source : Price series to filter.
• Bandpass Period (1-100): Primary tuning parameter determining which cycle length the filter emphasizes. Short periods (8-15) are more responsive but noisier; medium periods (16-30) balance responsiveness and smoothness; long periods (31-100) focus on longer cycles with more smoothing.
• Bandwidth (0.01-0.45): Controls filter selectivity. Narrow bandwidths (0.01-0.15) isolate specific cycle periods precisely; medium (0.16-0.30) tolerate cycle irregularity; wide (0.31-0.45) capture broader cycle ranges. Shorter periods pair well with narrower bandwidths.
• Prediction Multiplier (2-10): Controls how many past values contribute to the phase advance. Higher values provide smoother output but reduce the leading effect; lower values maximize anticipation at the cost of stability.
Display Settings
Control visibility and colors of the Voss output, bandpass filter, and zero reference lines.
Diagnostics - Dynamic Thresholds
Three methods identify significant signal deviation:
• MAD (Median Absolute Deviation) : Robust, outlier-resistant measure using `k * MAD` where `MAD ≈ 0.6745 * stdev`.
• Standard Deviation : Volatility-sensitive, calculated as `k * stdev` of Voss over the lookback period.
• Percentile Rank : Fixed probability bands using the percentile of |Voss| (e.g., 90% means only 10% of values exceed threshold).
Settings:
• Dynamic Threshold : Toggle threshold bands and set colors.
• Threshold Mode : Select MAD, Standard Deviation, or Percentile Rank.
• Period (2-200): Lookback for threshold calculations. Default 50.
• Multiplier (k) : Scaling for MAD/Standard Deviation modes. Default 1.5.
• Percentile (%) (0-100): For Percentile Rank mode only. Default 90%.
█ LIMITATIONS
Inherent Characteristics
• Residual lag : Despite negative group delay design, some lag remains relative to price action.
• Cyclical markets required : Performs best on instruments with clear cyclical components. Strongly trending markets with little cyclicality produce less useful signals.
• Signal interpretation : Absolute Voss values are instrument-specific. Always interpret relative to adaptive threshold bands, not fixed levels.
Market Conditions to Avoid
• Sudden news events/gaps : Major discontinuities disrupt cycle continuity, causing erratic signals. Requires 1-2 full cycle periods to re-stabilize.
• Low volume/illiquid markets : Sporadic trading produces false cycles from liquidity artifacts. Use only on actively traded instruments during liquid hours.
• Regime changes : During cyclical ↔ trending transitions, watch for persistent extremes without mean reversion, increasing price/indicator divergence, or unresolved threshold breaches.
Parameter Selection Pitfalls
• Mismatched period : If Bandpass Period doesn't match actual market cycles, the filter produces weak signals. Use cycle measurement tools (FFT, autocorrelation, Dominant Cycle) to identify appropriate periods first.
• Overoptimization : Perfect historical fits typically fail forward. Choose robust parameters that work across multiple instruments and timeframes.
█ NOTES
Credits
This indicator is based on concepts from Dr. John F. Ehlers' work on predictive filters and bandpass techniques for technical analysis. Dr. Ehlers has published extensively on applying digital signal processing methods to financial markets in Technical Analysis of Stocks & Commodities (TASC) magazine. His articles on bandpass filters and predictive techniques, particularly the Voss Predictive Filter concept, provided the theoretical foundation for this implementation.
For those interested in the underlying mathematics and DSP concepts:
• Ehlers, J.F. (2001). Rocket Science for Traders: Digital Signal Processing Applications . John Wiley & Sons.
• Various TASC articles by John Ehlers on bandpass filters, cycle analysis, and predictive filtering techniques.
• Ehlers, J.F. "Voss Predictive Filter" - Technical Analysis of Stocks & Commodities magazine.
by ♚@e2e4

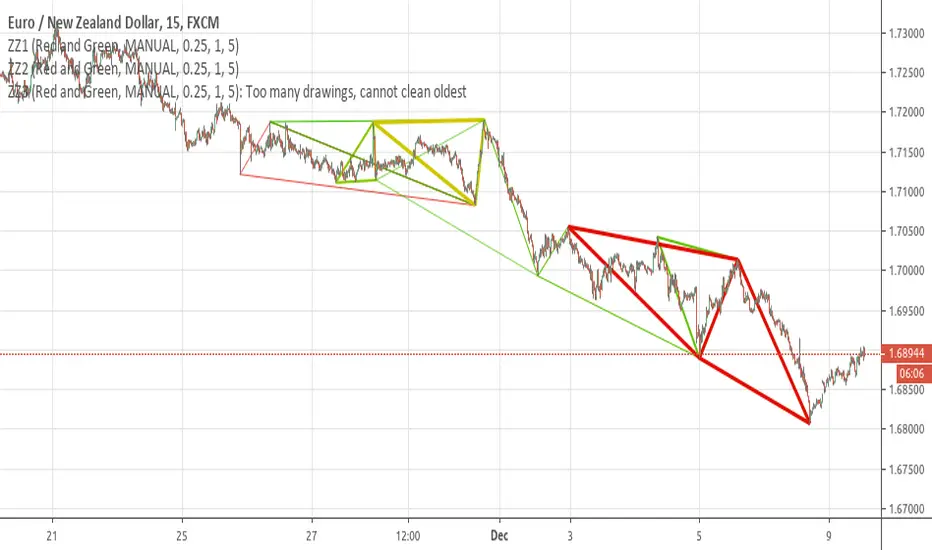
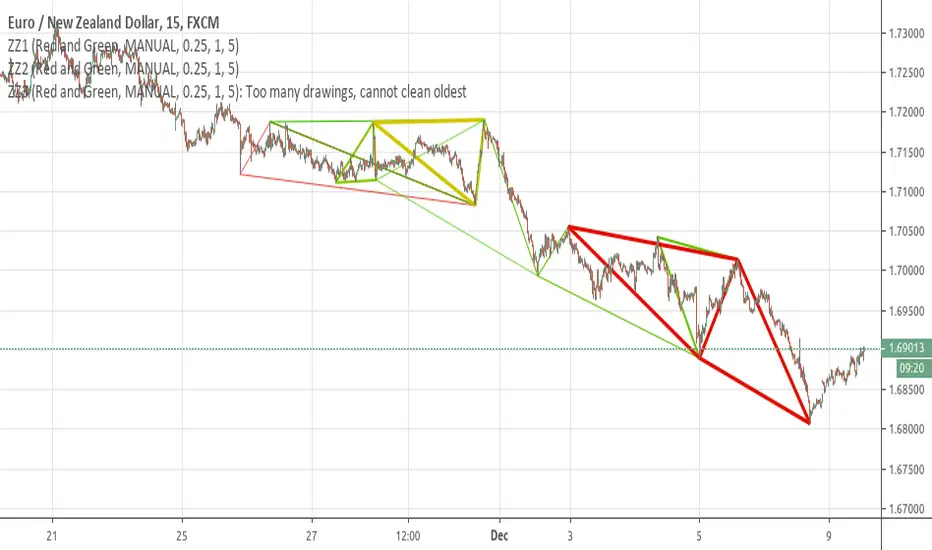
[RS]ZigZag Percent Reversal - Forecast - patterns - labels description:
• Zig Zag indicator plots points on the chart whenever prices reverse
by a percentage greater than a pre-chosen variable.
• Forecasts area based on zigzag statistics.
• Displays labels with detected patterns.
• Displays slope information rate of price, time diferentials and angle(experimental)
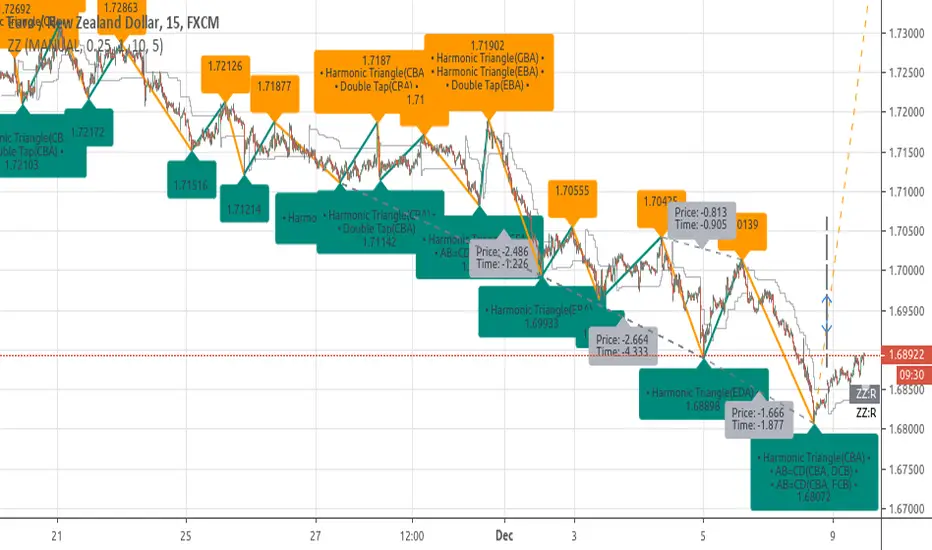
MoT - ZigZag Fibonacci + Ext./Ret. (Extended Ver.)The Indicator plots ZigZags and then overlays Fibonacci Levels (With Extension and Retracement Levels).
W have also programmed the indicator to search for Bullish/Bearish chart patterns in the form of ABC's, ABCD's, 3 Drives , BAT etc etc.
We have also added multiple time frame (MTF) options so the script will search for swing Highs/Lows over a larger period.
Please Note - This Version is with Extended lines of the most current Fib Levels. Which can make the charts look very busy. The other Indicator (No Extensions - Cleaner) is here:

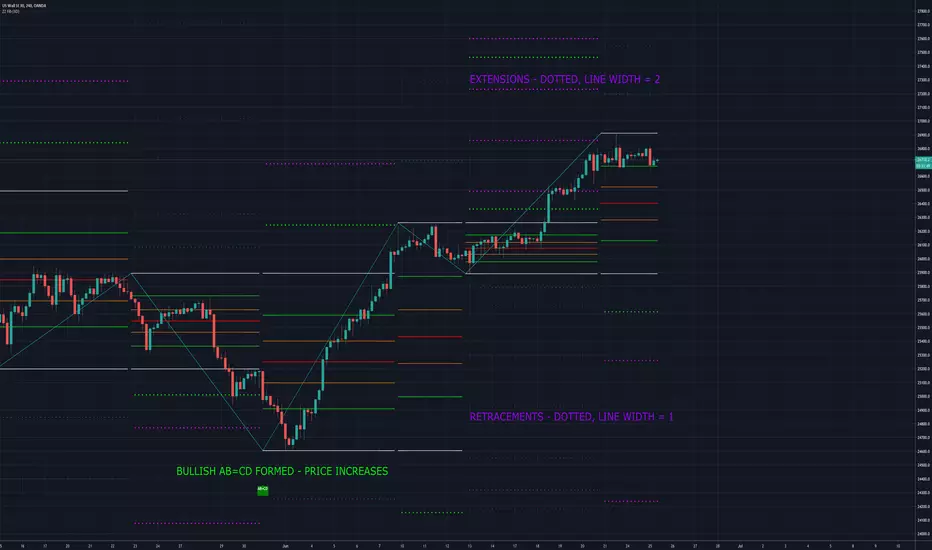
MoT - ZigZag Fibonacci w/Extensions + Chart Pattern RecognitionOne of my favourite indicators we have created over an extremely creative weekend while also watching Bitcoin keep pushing on! The Indicator plots ZigZags and then overlays Fibonacci Levels (With Extensions). I have also programmed the indicator to search for Bullish/Bearish chart patterns in the form of ABC's, ABCD's, 3 Drives, BAT etc etc. This evening we have also added multiple time frame (MTF) options.

[RS]ZigZag Percent Reversal(Multiple) - Forecast Areasnaive level forecasting of multiple zigzag's
based on this principle:
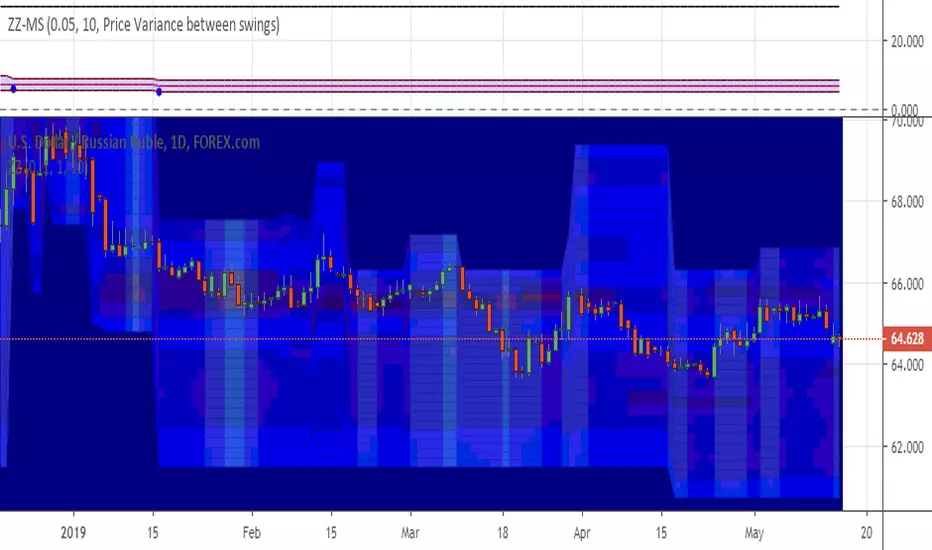
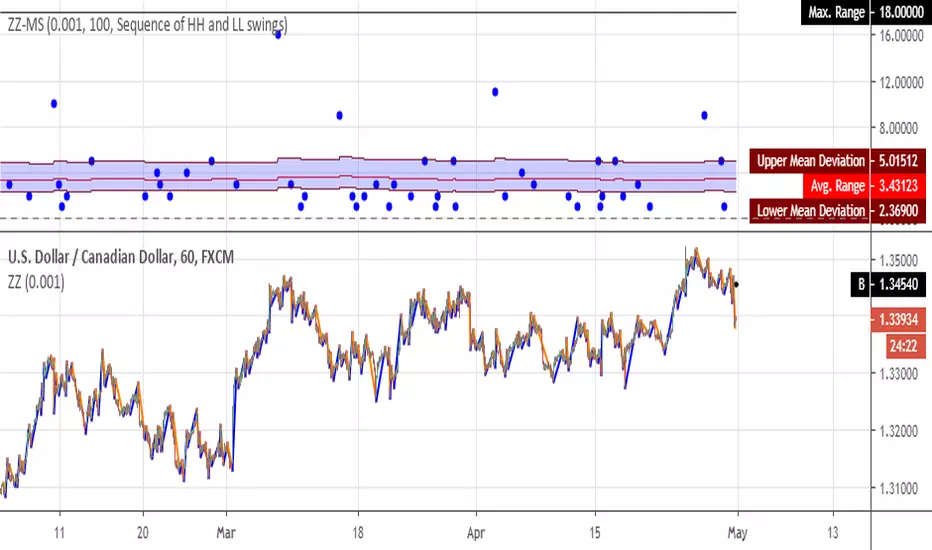
[RS]ZigZag Percent Reversal - Multiple StatisticsMultiple Statistics from zigzag:
• Price range between swings.
• Bar range between swings.
returns maximum value, avg value and mean deviation.
if you find something missing, please leave a message bellow.