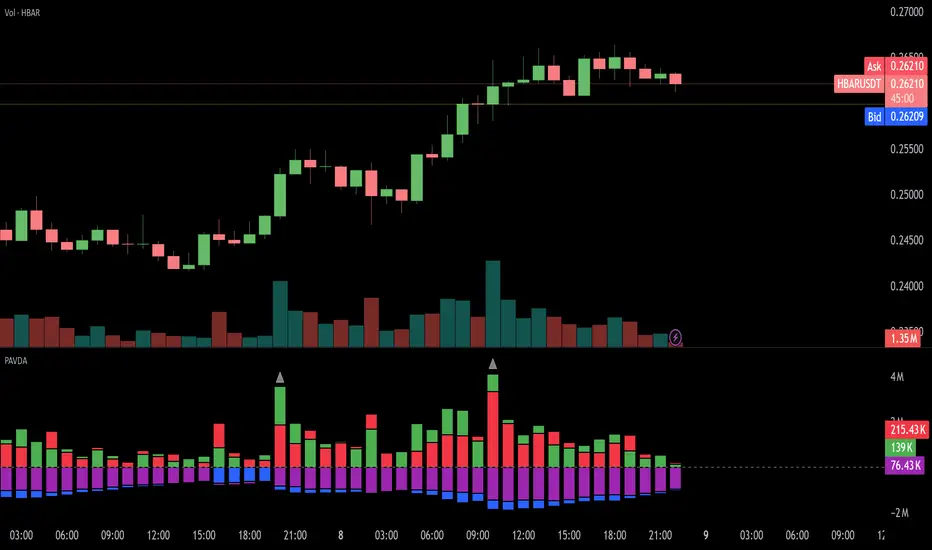
Price and Volume Divergence Analyzer
How to Use the Indicator
Main Purpose:
Identify divergences between price movement, the volume line, and the weighted volume line to predict potential reversals.
Volume Line Explanation:
At zero: Equal buying and selling volume.
At 1: Double the buying volume vs. selling.
At -1: Double the selling volume vs. buying.
Divergence:
Price rising, volume line falling: Sellers offloading to buyers—likely reversal downward.
Price falling, volume line rising: Buyers stepping in—likely reversal upward.
Higher/Lower Volume Movement Line:
At zero: Equal volume required for price movement.
At 1: High efficiency—half the volume needed to move price.
At -1: Low efficiency—double the volume needed to move price.
Above volume line: Movement aligns with efficient volume.
Below volume line: Inefficient price movement.
Candle Fill Colors:
Shaded based on whether the current close is higher or lower than the previous close.
Settings Overview
EMA Settings:
Timeframe Selection:
Use a lower timeframe than your chart for accuracy. Avoid selecting a timeframe higher than your chart.
EMA Length Option:
Default: Sets lengths automatically (EMA = 14, EMA of EMA = 3).
User Input: Allows custom EMA length.
Calculation Type:
EMA: Standard exponential moving average.
EMA of EMA: Applies EMA three times for smoother values.
Volume Line Settings:
Line Width: Adjust thickness.
Colors:
More Buying: Green (default).
More Selling: Red (default).
Higher/Lower Volume Movement Line:
Line Width: Adjust thickness.
Colors:
Higher Volume Movement: Indicates higher volume required.
Lower Volume Movement: Indicates lower volume required.
Up/Down Candle Fill:
Colors:
Up Candle: Green (default).
Down Candle: Red (default).
Transparency: Adjust percentage for visibility.
Balance Line Settings:
Line Width and Color: Equilibrium line showing equal buying/selling volume at zero.
Pine Script®指标