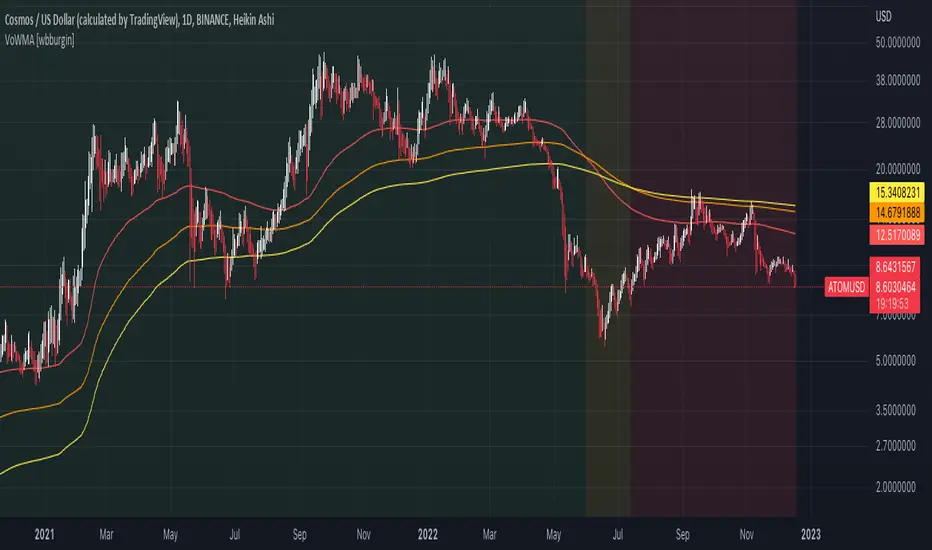
Volatility-Weighted Moving Average SystemThis simple script creates a moving average system weighted by volatility. The moving averages are less sensitive to price action than the typical moving averages we use, and their crossovers can be used to identify extended trends.
I've colored the background depending on trend. Ideally in the future, I'll draw long or short signals on-chart depending on the width between the bands, which works as a faster indicator of trend-change than crossover does.
Hope you all enjoy. Happy holidays.
加权移动平均线(WMA)
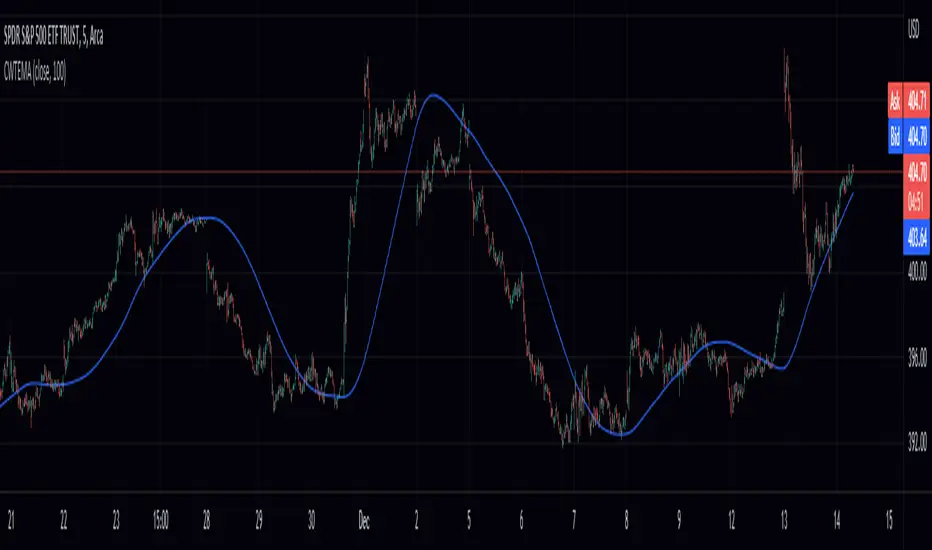
Cumulative Weighted Triple Exponential Moving Average (CWTEMA)This Pine Script code defines an indicator called "CWTEMA" that plots a custom weighted triple exponential moving average (TEMA) on a chart. The indicator takes two inputs: a source series (usually the close price of a security) and a length parameter that specifies the number of periods over which the moving average is calculated.
The code first defines a tema() function, which calculates the TEMA for a given series of data and a given length. The function uses the ta.ema() function from the ta library to compute the exponential moving average of the source data, and then applies the triple exponential moving average formula to calculate the TEMA.
The wma() function is then defined, which calculates the weighted moving average of a given series of data using a set of weights. This function computes the weighted sum of the source data using the given weights, then divides this sum by the sum of the weights to calculate the weighted moving average.
Finally, the cweema() function is defined, which calculates the custom weighted TEMA. This function first computes the weights for each value in the moving average using the given length parameter, then calls the wma() and tema() functions to calculate the weighted moving average using the TEMA values. The cweema() function is then plotted on the chart.
Cumulative Weighted Exponential Moving Average (CWEMA)This is a Pine Script for the "Cumulative Weighted Exponential Moving Average" (CWEMA) indicator. The script defines the CWEMA indicator using the ema() and wma() functions, which respectively calculate the exponential moving average and weighted moving average of a given data series. The cwema() function computes the weights for each value in the moving average and then uses the wma() function to calculate the weighted moving average of the exponentially weighted moving average of the input data series. The resulting CWEMA values are plotted on a chart.

Center Weighted Moving Average (CWMA)This is a pine script that defines and implements a custom weighted moving average (WMA) indicator. The script first defines a function called wma that calculates the weighted moving average of a given data source (src) with a specified set of weights (weights) over a specified length (len). The wma function first computes the weighted sum of the source data by multiplying the source data with the weights and summing over the length. It then calculates the sum of the weights. Finally, it divides the weighted sum by the sum of the weights to compute the weighted moving average.
The script then defines a second function called cwma that calculates a custom WMA by defining the weights for each value in the moving average as the length plus one divided by two minus the absolute value of the length minus the source data. It then uses the wma function to calculate and return the weighted moving average.
The script then specifies the input parameters for the cwma function: the source data (close) and the moving average length (length). It then plots the custom weighted moving average on the chart.

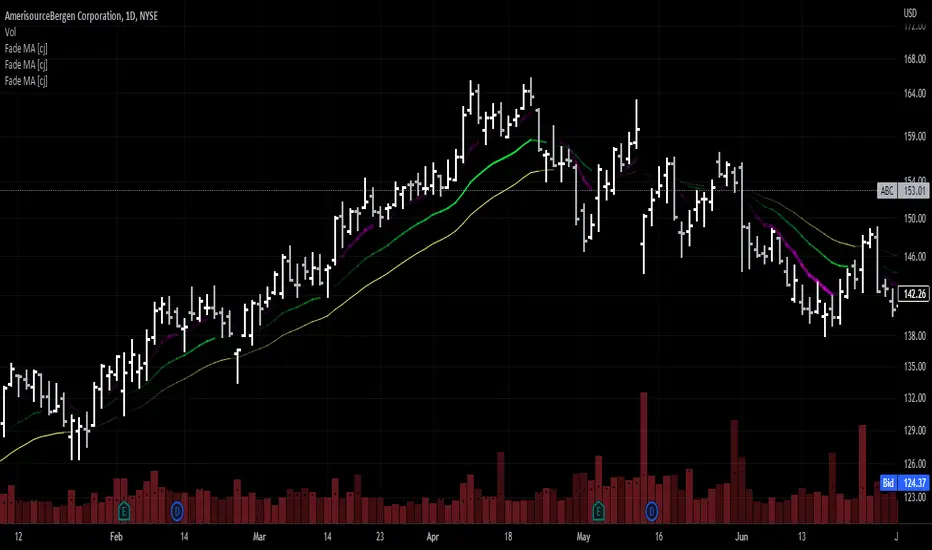
Moving Average - fade when crossed [cajole]This indicator simply provides a moving average (SMA, EMA, etc. can be selected) which hides itself when touched by the price.
Two potential uses:
Set the growth rate to be slow, to highlight only very rapid moves on a chart.
Use the default settings and change the averaging period until the MA line remains bright. This MA can then act as a good trailing stop for the specific security.
TradingView does not remember indicator settings for specific charts. Consider adding a text label to your chart after you identify the ideal trailing stop. Similar trailing-stop methods are recommended by Kristjan Qullamagie is identical to Jesse Stine's "magic line" concept .
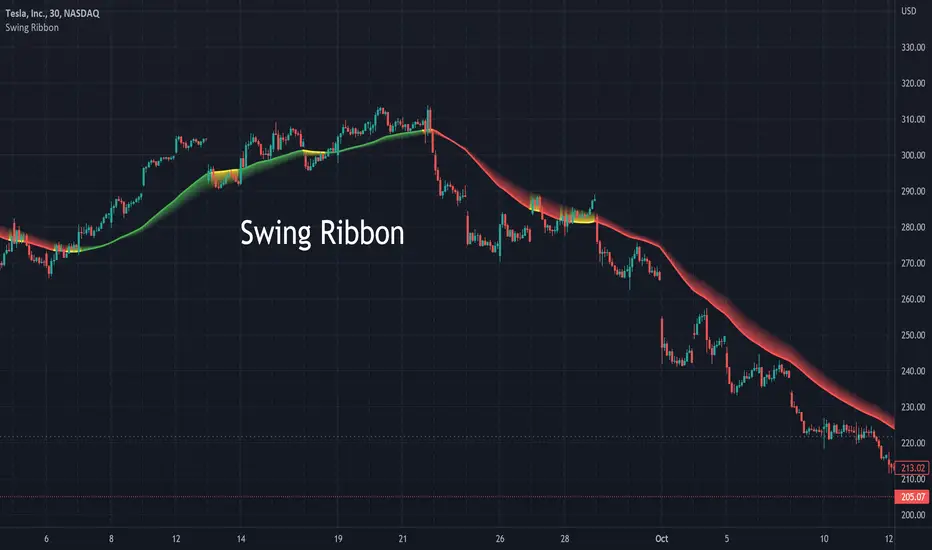
Swing RibbonA configurable fast and slow moving average combined to help visualize the current trend and potential changes in trend.
Allows for specifying a fixed set of minutes or days instead of just bars so that the visualization is similar when changing time-frames.
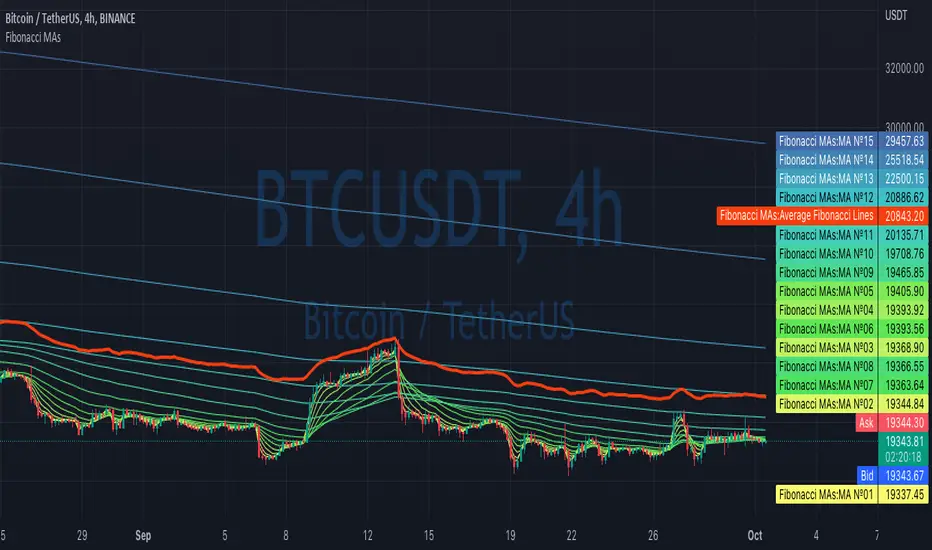
Fibonacci MAsIt's a pretty simple script. Idea is to compute MAs with the length of Fibonacci numbers and then compute an average of them all.
In the script, you can choose the type of MAs and how many Fibonacci numbers to use for it.
You can also adjust the length of these MAs manually and choose the color of every one of them.
Thanks to @MUQWISHI for helping me code it.
Disclaimer
Please remember that past performance may not be indicative of future results.
Due to various factors, including changing market conditions, the strategy may no longer perform as well as in historical backtesting.
This post and the script don’t provide any financial advice.
Trend SuggestionsThis brings together a number of variables to produce trend predictions that could be utilized as decision-making tools.
Uses the aforementioned price and volume derivatives
- A moving average and three weighted moving averages (WMA1, WMA2, WMA3)
- Super Trend Line (ST)
- Opening Range Breakout on Five Minutes, Resistance Bands Pocket pivots, support, and price volume
he Direction is determined by the High and Low Bands of WMAs and the Supertrend Line, which are used to determine the Upper and Lower Lines around the Price. When the price passes below the lower boundary of the band, a downtrend is said to have begun.
Similarly, for an uptrend, this continues until the price passes over the upper edge of the band. Teal for an uptrend and fuchsia for a downturn area shared by the band to identify the trend.
The first five minutes of the breakout lines have a tiny buffer augmentation of 11% applied to them.
Based on what has been observed, support and resistance zones have been somewhat changed from the figures that are often utilized (might work other markets as well)
The markings that may be seen are as follows:
- Blue Triangle indicates a pocket pivot with an upward bias;
- Maroon Triangle indicates a pocket pivot with a downward bias;
- Teal colored Diamonds indicate price upthrusts and potential trend confirmation locations, depending on success or failure.
- Similar backdrop color changes that look as vertical shading are also used to identify them.
- Fuchsia-colored diamonds indicate price declines and a potential trend, depending on whether it persists or fails.
- Dark green and maroon square boxes indicate potential price reversals in the support and resistance bands, respectively.
It goes without saying that this work is derived from numerous other open-source community initiatives.
Feel free to adjust anything you'd like, and we appreciate any feedback.

EMA ON MA SETSOORY FOR MY EINGLISH
ITS NOT MY NATIVE AND IM NOT GOING TO GOOGLE TRANSLATE THIS
this is a beuaitful indicator that plot EMA that gat is calc from another ma and length for your choise so you will get an = 'ema on ma '
it can plot you more beautiful results and more smoothing results
i added golden/death cross for all ma
enjoy !
היי חברים זה בעצם אינדיקטור של ממוצע נע על ממוצע נע לנוחיכותכם
הפלט הראשי הוא EMA
הוא לוקח את החישוב שלו ממוצע אחר והאורך שתגדירו
נותן תוצאה יותר חלקה של ממוצעים נעים
הוספתי חתיוכים בין ההמוצעים
תהנו.

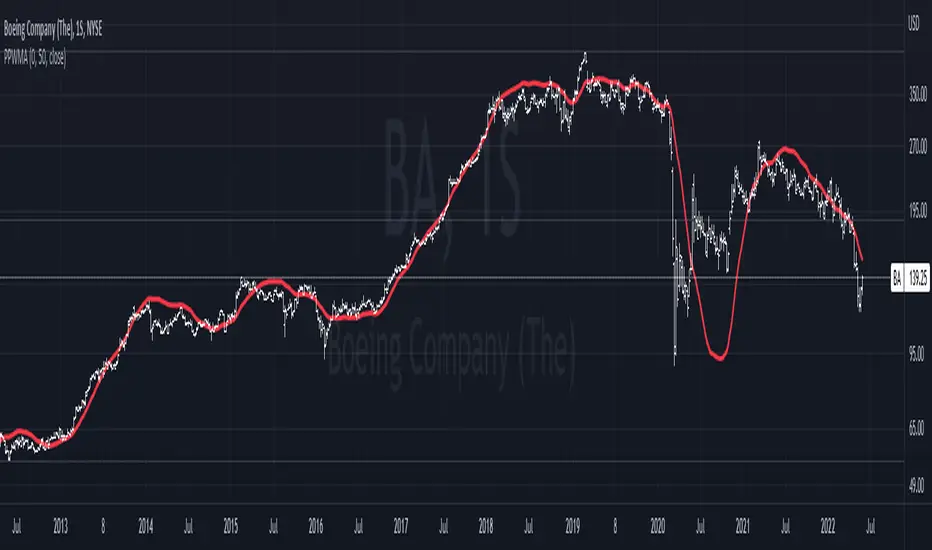
Pivot-Point Weighted Moving AverageThe Pivot-Point Weighted MA is very different from other weighted MAs, in the sense that the price weights can achieve negative values. For an example, if a length of 21 is used, the pivot point will be calculated as 13, meaning that the 13th prior candle will have 0 weight, and all prices before it will have a negative weight on the sum, so their impact is reversed rather than just unweighted.
The intent of this is to reduce lag by front-loading the prices. It works better in cyclic markets, and with a longer length, where the inflection point (the one with 0 weight) is aligned with the cyclic turn.
You can configure where the weight starts. If you leave it as 0, it will start with floor(length * 0.66) - 1.
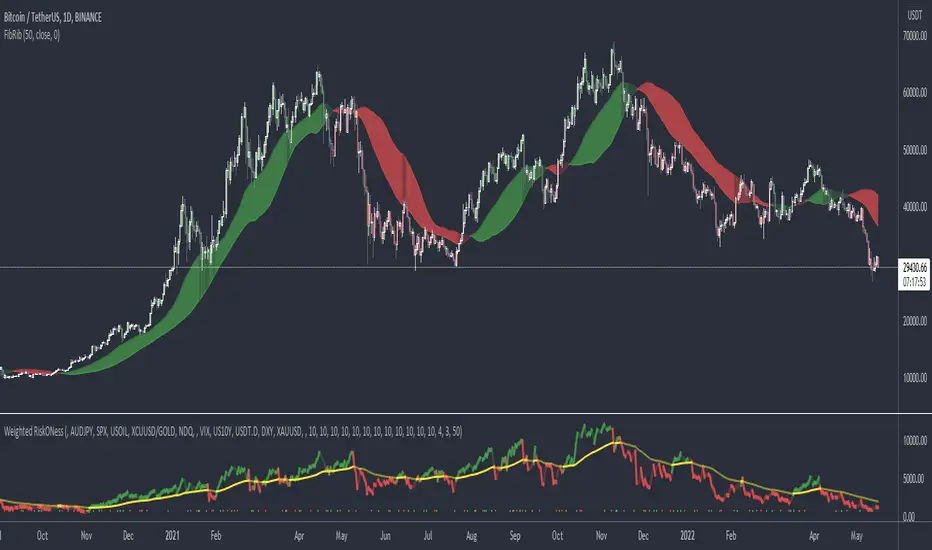
Fibonacci RibbonThe Fibonacci Ribbon (FibRib) creates two Fibonacci moving averages: essentially a Fibonacci WMA and a Fibonacci EMA.
The ribbon colors based on which is higher and where PA is relative to the ribbon.
Optional colored candles shades candles the same color as the ribbon.
super SSL [ALZ]This script is designed and optimized for MULTI TIME
by Ali Zebardast (ALZ)
1.in part of ssl
Original Version credits to Mihkel00
Actual Version i just set alerts and change the parameters for BTCUSDT 1min Chart.
He designed for daily time. I tried to optimize 1 min time-frame .
And fix the errors with OTT
"This script has a SSL / Baseline (you can choose between the SSL or MA), a secondary SSL for continiuation trades and a third SSL for exit trades.
Alerts added for Baseline entries, SSL2 continuations, Exits.
Baseline has a Keltner Channel setting for "in zone" Gray Candles
Added "Candle Size > 1 ATR" Diamonds from my old script with the criteria of being within Baseline ATR range."
2.in part of Range
two Filter Buy and Sell for 3min
Wait For Bar close
ssl2 :Be under the candle for buy
and The bar color must confirm the order of purchase (Blue)
3.in part of OTT
when candles close over HOTT, means an UPTREND SIGNAL
and to Fuchia when candles begin closing under LOTT line to indicate a DOWNTREND SIGNAL.
FLAT ZONE is highlighted also to have the maximum concentration on sideways market conditions.
There are three quantitative parameters in this indicator:
The first parameter in the OTT indicator set by the two parameters is the period/length.
OTT lines will be much sensitive to trend movements if it is smaller.
And vice versa, will be less sensitive when it is longer.
As the period increases it will become less sensitive to little trends and price actions.
In this way, your choice of period, will be closely related to which of the sort of trends you are interested in.
The OTT percent parameter in OTT is an optimization coefficient. Just like in the period
small values are better at capturing short term fluctuations, while large values
will be more suitable for long-term trends.
The final adjustable quantitative parameter is HIGHEST and LOWEST length which is the source of calculations.
Credits go to:
SSL Hybrid www.tradingview.com
HIGH and LOW OTT : www.tradingview.com
Range Filter www.tradingview.com

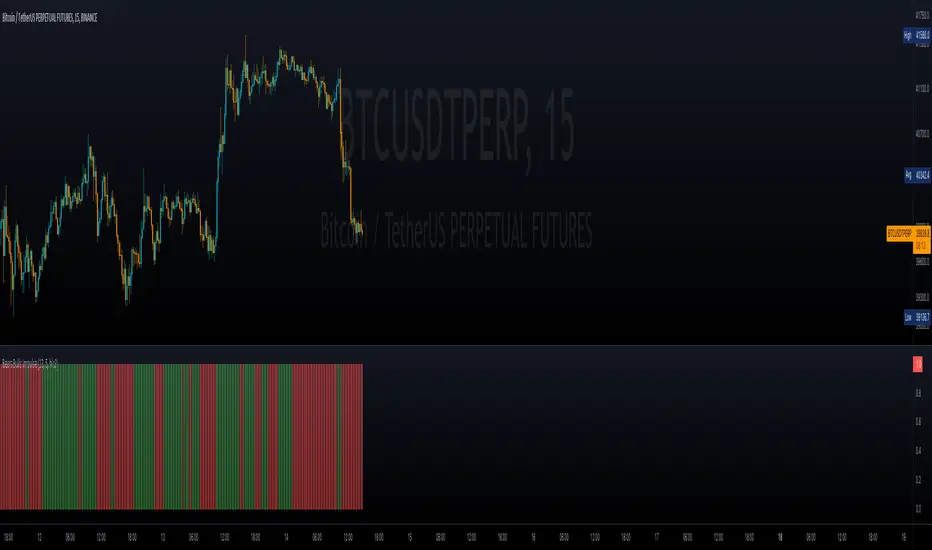
Bears Bulls Impulse█ OVERVIEW
Maybe another version of the Bears Bulls indicator, but with a unique interpretation on the scripts found here on Tradingview. Again, this indicator is not meant to be used alone but as an entry/exit confirmation with other indicators.
█ CONCEPTS
Using a modified version of the WMA indicator, the LWMA , this indicator will work similarly to the Bears Bulls Power indicator. Quoting from Admiral Markets, "Bulls Power measures the capability of buyers in the market to lift prices above an average consensus of value. Bears Power measures the capability of sellers to drag prices below an average consensus of value. Using them in tandem with a trend measure allows you to identify favorable entry points."
█ HOW TO USE IT
As soon as the color changes, it indicates a change in the price direction and divergences. Green buy, red sell? Not that simple, but following that pattern for scalping may result in some good entries. Following this indicator blindly will not be accurate as using another indicator to filter the signals in favor of a major trend (that indicator could be another Bears Bulls Inpulse from a higher time frame)
jma + dwma crossoverThis crossover system was originally conceptualized by Jurik Research and made public to the world on their website .
The indicator consists of the faster Jurik Moving Average (JMA) and the slower Double Weighted Moving Average (DWMA). A long signal is shown when the JMA line crosses above the DWMA line (indicating a possible reversal in trend). A short signal is shown when the JMA line crosses below the DWMA line. Take profit signals are shown when the JMA line reverses directions. Alerts for signals are included in this indicator.
The default settings are not optimized for any timeframe. Both JMA and DWMA lines are defaulted to hidden.
Credit to @everget for the re-creation of the Jurik Moving Average in pinecsript.

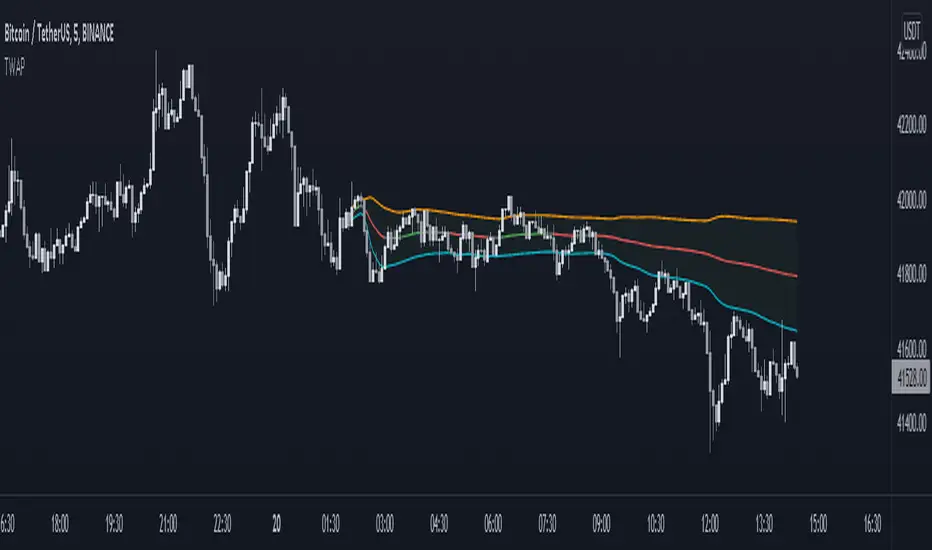
Anchored TWAP with StDev Bands [MrShadow]TWAP with:
- Anchoring: Custom, Day, Week, Month, Quarter, Year (custom anchoring can be selected by dragging a vertical line through the chart)
- Standard Devation Bands
- Auto-coloring depending on the trend
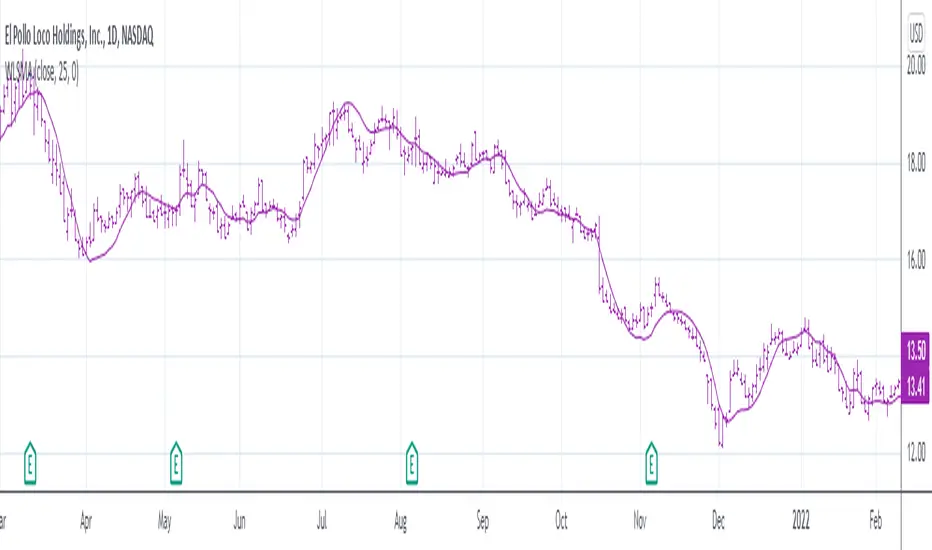
Weighted Least Squares Moving AverageLinearly Weighted Ordinary Least Squares Moving Regression
aka Weighted Least Squares Moving Average -> WLSMA
^^ called it this way just to for... damn, forgot the word
Totally pwns LSMA for some purposes here's why (just look up):
- 'realistically' the same smoothness;
- less lag;
- less overshoot;
- more or less same computationally intensive.
"Pretty cool, huh?", Bucky Roberts©, thenewboston
Now, would you please (just look down) and see the comparison of impulse & step responses:
Impulse responses
Step responses
Ain't it beautiful?
"Motivation behind the concept & rationale", by gorx1
Many been trippin' applying stats methods that require normally distributed data to time series, hence all these B*ll**** Bands and stuff don't really work as it should, while people blame themselves and buy snake oil seminars bout trading psychology, instead of using proper tools. Price... Neither population nor the samples are neither normally nor log-normally distributed. So we can't use all the stuff if we wanna get better results. I'm not talking bout passing each rolling window to a stat test in order to get the proper descriptor, that's the whole different story.
Instead we can leverage the fact that our data is time-series hence we can apply linear weighting, basically we extract another info component from the data and use it to get better results. Volume, range weighting don't make much sense (saying that based on both common sense and test results). Tick count per bar, that would be nice tho... this is the way to measure "intensity". But we don't have it on TV unfortunately.
Anyways, I'm both unhappy that no1 dropped it before me during all these years so I gotta do it myself, and happy that I can give smth cool to every1
Here is it, for you.
P.S.: the script contains standalone functions to calculate linearly weighted variance, linearly weighted standard deviation, linearly weighted covariance and linearly weighted correlation.
Good hunting
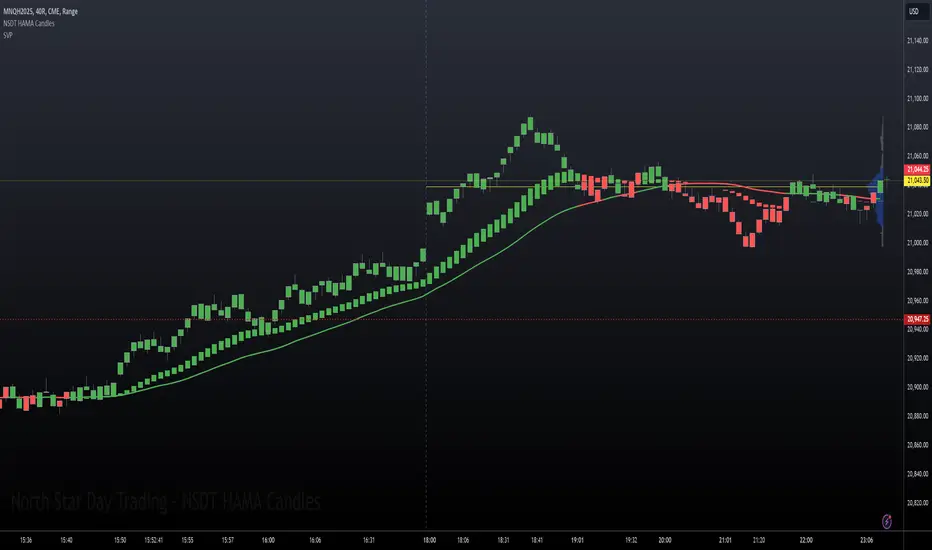
NSDT HAMA CandlesHAMA (Heiken-Ashi Moving Average) Candles are built using different moving average lengths for the open, high, low, and close. Those levels are then run through the Heiken-Ashi Candle formula to create a new hybrid candle on the chart. There is an additional Moving Average plotted as well for overall direction.
This may be used best for identifying trending markets. By referencing the HAMA Candle indicator, it may help guide you to stay in a trade a bit longer, or wait a bit longer before entering at the beginning of a potential trend.
We added a Gradient Color scheme option for a more colorful view of potential trend directional changes. The gradient code is taken from the Pinecoders Gradient Framework (Pro Advance/Decline Gradient example) at
There are three different Moving Average types to choose from. (EMA, SMA, WMA). All MA lengths can be modified. All colors can be modified. All options can be turned on or off.
This was previously an "invite-only" indicator, but we decided to publish it publicly and open source.
R950S- MehmetAltun
hello, it allows you to see both rsi and ma and ema values on the same screen. You can set the levels you want in the Aarlar section. You can make the coloring you want.

JC blended MAs v3The best, simplest moving averages you'll find.
Well not really. But it does have SMA, WMA, and EMA in one place. Plus an additional one that averages those, that might give you a leg up because it's not really a standard thing and you won't create a massive worldwide machine-driven feedback loop that crashes the markets (instead profit from them). Or something like that.
Each moving average has their own definable averaging length.
The master time resolution is also definable, or you can use the chart's. (The latter which is not very useful for moving averages, yet so many of them on trading view don't let you specify otherwise.)
For example you can set the master resolution to 5 minutes, 1 hour, 1 day, etc. (Default is 1 hour.) The graphs don't change, only the resolution.
Note: There are a few rare, extreme edge cases where the graphs won't render, which are obvious. In which case all you need to do is choose a more sane resolution. This is more about the limits of Trading View than specific script bugs.

Cloud Ribbon ++ by [JohnnySnow]Inspired by my favorite EMA ribbon - "EMA Ribbon " by fskrypt.
This Ribbon ADD the option to choose the avarage algorithm of the ribbon .
Created also to be more friendly to read along with trendlines and Fibonacci retracements.
For those like me that NOT use this ribbon to find exact price action but instead, to have a grasp of possible Support/Resistance strenght ahead.
High transparency lines and a configurable color palette for filling the background give the ribbon a look of support/ Resistance cloud Strenght.
Each MA length, line, and background color can be easily configured.

Inverse Fisher Transform on Williams %RInverse Fisher Transform On Williams %R
Since Williams R indicator produces negative values, I preferred to add 50 instead of subtracting 50.
It produces values between 0.5 and -0.5.
Generates clear buy and sell signals.
Williams %R determines overbought and oversold levels.
You can see more softly.

Dr.Om's SuperTrend IndicatorRiding along the Super Trend -
Super Trend Bullish candle (STBullCandle) is a candle where low is lower than supertrend and close is greater than super trend.
Conditions for going Long -
1. High of current candle should be higher than high of STBullCandle.
2. We can consider 1 or 2 candles after the STBullCandle for this condition.
3. If filterRsi is enabled, then we make an additional check of RSI being greater than the weighted moving average.
4. Should not be holding an existing long position
5. SuperTrend should be positive
Super Trend Bearish candle (STBearCandle) is a candle where high is higher than supertrend and close is lower than super trend.
Conditions for going Short -
1. Low of current candle should be lower than low of STBullCandle.
2. We can consider 1 or 2 candles after the STBearCandle for this condition.
3. If filterRsi is enabled, then we make an additional check of RSI being lower than the weighted moving average.
4. Should not be holding an existing short position
5. SuperTrend should be negative.
If holding long, EXIT LONG Position Criteria -
1. SL would be if close is lesser than the ST candle low
2. Direction of ST becomes Negative
3. If Reward to Risk ratio is given, then exit if target is achieved.
If holding short, EXIT SHORT Position Criteria -
1. SL would be if close is higher than the ST candle high
2. Direction of ST becomes +ve
3. If Reward to Risk ratio is given, then exit if target is achieved.
