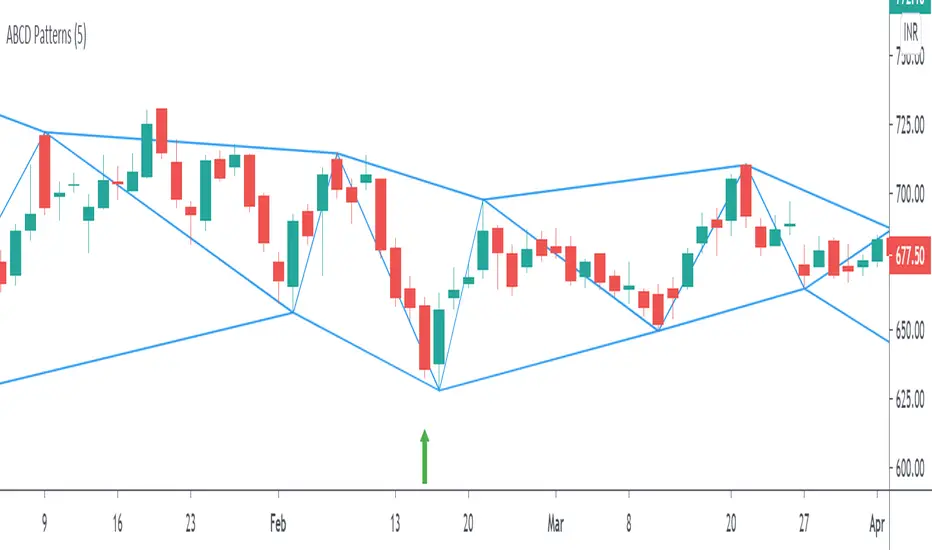
ABCD Harmonic PatternsShows Bullish and Bearish AB=CD Harmonic Patterns with Pivot High, Pivot Low and Pivot Line
之字转向指标(Zig Zag)
GreyPool ZigZag Cumulative VolumeThis indicator shows the cumulative volume between the zigzag segments (waves) and plots the percentage change from the previous segment
Let us know if there's anything you'd like added to the indicator and please click LIKE to support us

Double Top Double Bottom [MS]Automatic Double Top and Double Bottom pattern scanner for any time frame, any asset.
Simple to use, just add to your chart, and set the size (in the settings) for the patterns you want to find.
• Green patterns are bullish
• Red patterns are bearish
• Alerts are available for when new patterns are displayed
• When a pattern completes (at the neckline), it will change from dotted lines to solid lines.
To scan for multiple sizes of patterns, add the script to your chart multiple times.
Use the link below or PM us to obtain access to this indicator.

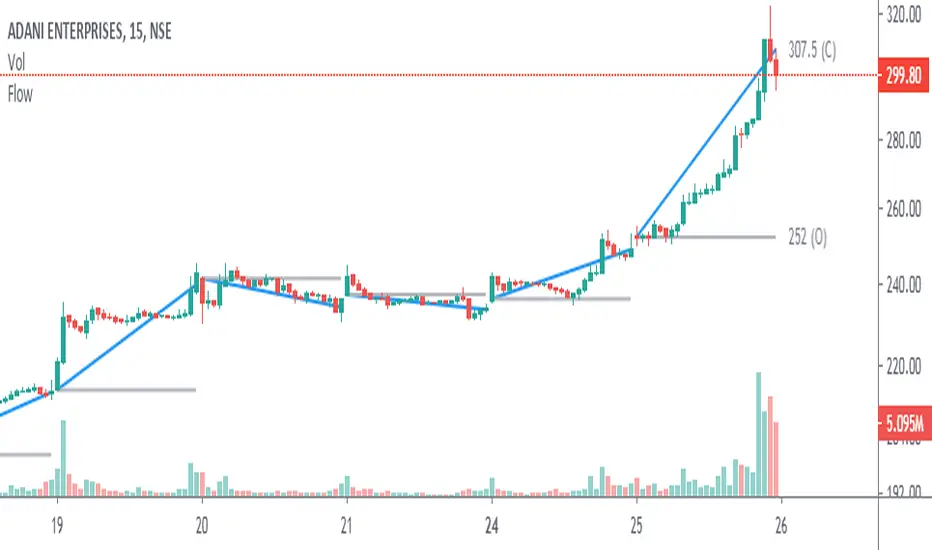
Angle & Price FlowThis is a simple end of the day indicator based on open and close values.
Angles:
Identifying narrow angles helps to find breakouts
Maximum angle = High chance of reversal
Minimum angle = Chance of breakouts on the next day or upcoming days.
Price Flow:
I personally use price flow to simplify the flow of candlestick chart and to identify breakouts using rounding bottoms and rounding top patterns, sharp corners for reversals.
Features:
Multi time frame
Labels
Hide previous period
Combine it with other indicators for better result.

Ultimate Pattern Scanner ProChart Patterns and Harmonic Patterns using just ONE indicator!
This is a automatic scanner for well know patterns like Head and Shoulder to get started. I'm planning to add more patterns in the near future. It works as follows:
1. Is going to plot the pattern on the chart, lines in blue
2. Is going to show you when the pattern has finished to form, triangles and diamonds
3. It is possible to get an alert when the pattern has form
For example: is going to give a possible entry when the price has broken the trend line of the two shoulders if we take the Head and Shoulder pattern as an example.
Please let me know in the comments if you would like to have more patterns.
======================================================
This versions supports:
1. Head And Shoulder Pattern
- Show possible entries when the trend formed by the shoulders has been broken
2. Bat Harmonic Pattern
- Show Possible Reversals Zones in green or red boxes
- Alerts when any pattern has form
======================================================
======================================================
Next Versions:
- All the harmonic patterns
- Triangles
- Elliot Waves impulses
- Double Top and Bottom
- Triple top and bottom
- Rising and Falling Wedge
- The cup and the handle, etc
- ABCD pattern
Let me know in the comments if you are interested in something like this so I CAN GIVE YOU ACCESS. I'll appreciate your feedback.
thanks

Ultimate Pattern ScannerThis is a automatic scanner for well know patterns like Head and Shoulder to get started. I'm planning to add more patterns in the near future. It works as follows:
1. Is going to plot the pattern on the chart, lines in blue
2. Is going to show you the long entry or short entry bar, red or green triangles
3. It is possible to get an alert when there is a potential long or short entry depending on the pattern
For example: is going to give a possible entry when the price has broken the trend line of the two shoulders if we take the Head and Shoulder pattern as an example.
Please let me know in the comments if you would like to have more patterns.
======================================================
I have planned the release of a pro version with all the well know patterns for invite only users. Patterns like:
- All the harmonic patterns
- Triangles
- Elliot Waves impulses
- Double Top and Bottom
- Triple top and bottom
- Rising and Falling Wedge
- The cup and the handle, etc
- ABCD pattern
Let me know in the comments if you would be interested in something like this please. I'll appreciate your feedback.
thanks!
Channel Support ResistanceHello friends, I wish you all the best.
you can measure the success rate of this indicator from the past.
It works well on indicator stocks.
You can use the time period you want
I'd like to talk a little bit about how it works
The lower channel support shows the upper channel resistance.
sub-channel is expected when it goes under the channel
When it rises above the canal, it can be expected to go to the upper channel.
Stay tuned to be notified of new analysis and indicators don't forget to like


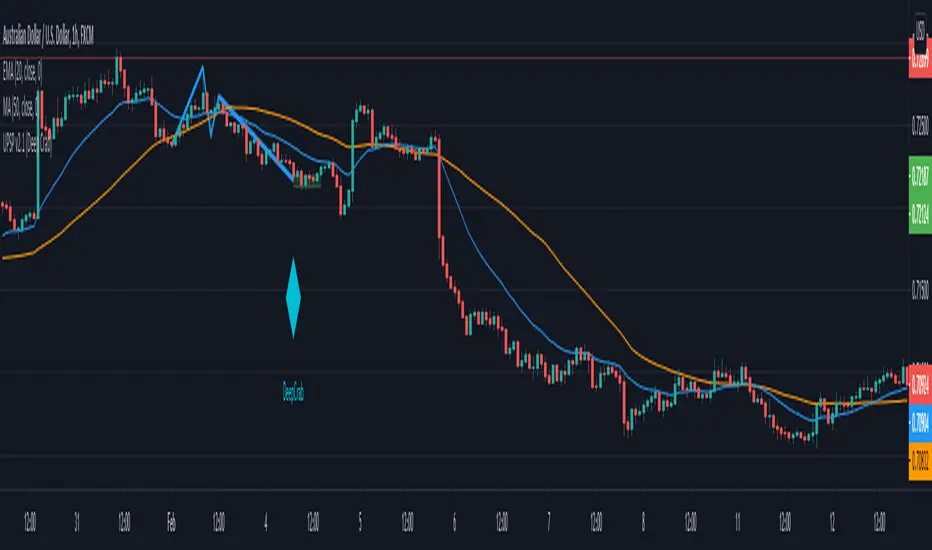
Harmonic auto-detect [PRO]Automatically detects and visually displays Harmonic patterns,
from small ZigZag to large ZigZag.
17 types of Harmonic patterns are supported.
Pattern5-0 / 3Drive / AB=CD / Gartley / Butterfly / Bat / A Bat / Crab / Deep Crab /
Cypher / A Cypher / Shark / Nenstar / A Nenstar / Dragon / Black Swan / White Swan
The alert function allows you to be alerted when a Harmonic pattern is detected.
Use the link below to obtain access to this indicator.

Harmonic auto-detect [FREE]Automatically detects and visually displays Harmonic patterns,
from small ZigZag to large ZigZag.
5 types of Harmonic patterns are supported.
Pattern5-0 / 3Drive / AB=CD / Gartley / Butterfly
小さいZigZagから大きいZigZagまですべてを監視し、ハーモニックパターンを自動的に検出します。
検出したパターンは視覚的に表示されます。
インジケーターは、5種類のハーモニックパターンに対応しています。
Pattern5-0 / 3Drive / AB=CD / Gartley / Butterfly

[AKM] Setup4This indicator will divide the area to Buy and Sell zone with a divider line.
Buy Signal
The Buy signal will only appear when current price is above the divider line and break the last peak zigzag.
Buy signal with yellow color indicate that momentum value is between 0 and below the value set at Low Momentum Upper.
Buy signal with green color indicate that momentum value is exceeds the value set at Low Momentum Upper.
-Buy Momentum
The Buy signal will only appear when current price is above the divider line and break the last peak zigzag but the momentum is in Sell zone.
The -BM will be in blue color.
Sell Signal
The Sell signal will only appear when current price is below the divider line and break the last bottom zigzag.
Sell signal with yellow color indicate that momentum value is between 0 and above the value set at Low Momentum Bottom.
Sell signal with red color indicate that momentum value is exceeds the value set at Low Momentum Bottom.
-Sell Momentum
The Sell signal will only appear when current price is below the divider line and break the last bottom zigzag but the momentum is in Buy zone.
The -SM will be in blue color.
MX
If the MX signal appear above the divider line, it's time to close your Buy position. The momentum has changed from Buy zone to Sell zone.
If the MX signal appear below the divider line, it's time to close your Sell position. The momentum has changed from Sell zone to Buy zone.
Yellow MX means that the momentum value is between Low Momentum Upper and Low Momentum Bottom.
MX signal with green color indicate that momentum value is exceeds the value set at Low Momentum Upper.
MX signal with red color indicate that momentum value is exceeds the value set at Low Momentum Bottom.
Send us private message on TV to gain access to the indicator.

Consolidation Zones - LiveHello Traders!
This is the script that finds Consolidation Zones in Realtime.
How it works?
- The script finds highest/lowest bars by using "Loopback Period"
- Then it calculates direction
- By using the direction and highest/lowest bar info it calculates consolidation zones in realtime
- If the length of consolidation area is equal/greater than user-defined min length then this area is shown as consolidation zone
- Then Consolidation Zone extends automatically if there is no breakout
if you increase the Loopback Length then you get bigger consolidation zones:
You have option to "Paint Consolidation Area" or not:
Enjoy!

[HWVZ] Hiubris WeisVolume ZigZagThis script follows the Zig Zag pattern of price movement, based on the Weis Wave Volume indicator.
The Weis Wave Volume shows the cumulative volume from the lowest point of the price swing to the highest point (or vice versa)
The user has the option to change the Trend Detection Length of the indicator to adjust the swings frequency (from say 5 to any value above or below)
The user has the option to display Support & Resistance lines based on those turning points
The user has the option to display Info Labels for each swing
The user has the option to change the Weis Wave Volume Timeframe
*This is a Tradingview interpretation of the Weis Wave Plugin

Key price levelsFunction: labelling recent highs and lows automatically. Easy and clean.
In this example, we can see the previous low of the ticker is around 105.5, the previous high is around 120.
We can set up our entries and exits by referring to the last lows and highs.
Users can adjust the searching bar range by themselves.

RSI Swing Indicator v2The 2nd version of this indicator came quick :)
As the previous one, it draws swings on the candlesticks, based on price action and RSI.
Also in the labels you can see if the current swing is higher or lower to the previous one.
HH stands for Higher High
LL stands for Lower Low
LH means Lower High
HL means Higher low
THIS IS NOT A STRATEGY, this is for TREND analysis.
Please stop asking if it "redraws", because it doesn't matter.
The labels are not SELL or BUY signals

RSI Market StructureThis indicator draws swings on the chart based on the RSI configured within.
The swings are drawn from Overbought to Oversold or vice-versa.
Logic:
From Overbought to Oversold, a line is drawn from the highest price before oversold to the lowest price of the oversold.
The labels can be deactivated from the style menu, it was easier for me to implement this way (It's my first indicator)

Zig Zag High LowZig Zag script that uses local minimums and maximums as pivot points. It can be used as a source for pattern recognition.

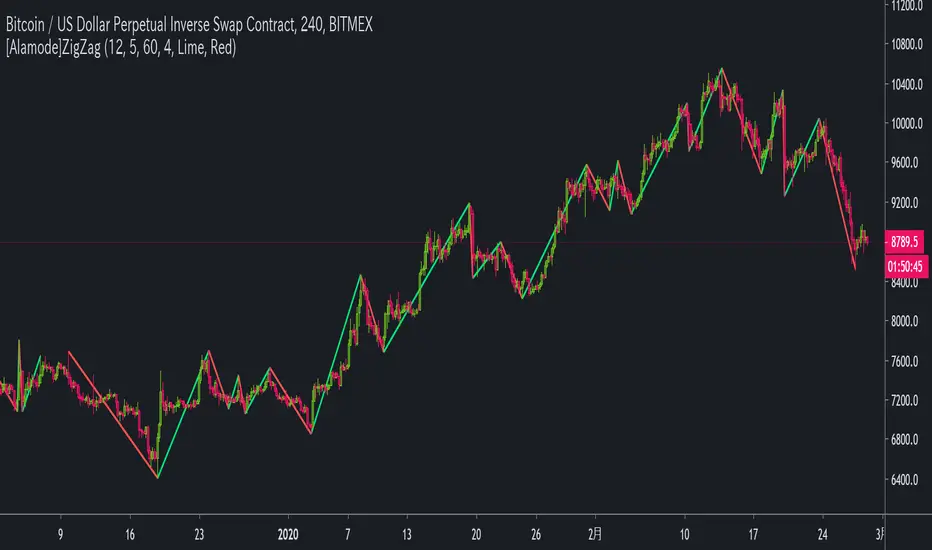
[Alamode]ZigZagOne of the Alamode series that allows you to visually judge trends.
Helps you draw Fibonacci retracements and Fibonacci expansions.
Smart Indicator 28 - Swing Pivots (Higher Highs and Lower Lows)A simple way to find Higher Highs and Lower Lows (HH and LL) whit automatic Fibonacci Lines in the most common levels.
In this indicator the Higher Highs only happens when a high value are rising from each other in the last "Length of Real Pivots" highs and the next same number of highs are falling in every single bar.
The Lower Lows are inverted, LL only appears if a low is falling in every single bar in the last number of length and the lows price of the "n" bars next are rising.
You can use this Indicator in any kind of market.

Trend LinesHello Everyone! This is my new trend lines script (after beta version that was published almost one year ago)
The idea is to find Pivot Highs (PH) and Pivot Lows(PL) first.
Then, If current PH is smaller then previous PH (means no new higher high and possible downtrend) then draw trend line using them. and also it checks previous trend line (if exits) and if current angle is smaller then don't extend previous one.
Same idea when using Pivot Lows, If current PL is higher then previous PL (means no new lower low and possible uptrend) then draw trend line using them. and also it checks previous trend line (if exits) and if current angle is smaller then don't extend previous one.
Optionally style of old trend lines drawn as dashed.
Hope you enjoy it!

AB=CD Pattern_ULTRA V1 [NXT2017] Autodrawing Harmonic PatternPrivate indicator.
HI BIG PLAYERS AROUND THE WORLD,
this script allows to draw automatically lines of AB=CD Pattern . The AB=CD Pattern is part of Harmonic Pattern .
Parallel to the automatic drawing, the indicator can give signals as soon as the typically Fibonacci extension immediately reached or has been reached. This allows the indicator AB=CDPattern_ULTRA V1 to give early signals. In the default settings, the signals are displayed with a blue background on the chart.
NO REPAINT
As soon as the most points of the pattern are developed, the last point is a fix prediction without any repaints!
AB=CDPattern_ULTRA V1 is offered for sale. More information can be found below in the signature.
In the settings it is possible to change the degree of details. This is sometimes necessary because TradingView limited only 55 lines per indicator in Pinescript Version 4.
Furthermore, you can set a range how much bars back you want go from current bar for the automatic drawings. As default is setting 2000 bars back.
In extreme cases it is possible to change the settings to "lite" that the AB=CD Pattern represent waves only with 2 lines. This allows the indicator to detect far more AB=CD Pattern on the same chart.
For more great indicators everyone is invited to follow me on TradingView.
Kind regards
NXT2017

CypherPattern_ULTRA V1 [NXT2017] Autodrawing Harmonic PatternPrivate indicator.
HI BIG PLAYERS AROUND THE WORLD,
this script allows to draw automatically lines of Cypher Pattern . The Cypher Pattern is part of Harmonic Pattern .
Parallel to the automatic drawing, the indicator can give signals as soon as the typically Fibonacci extension immediately reached or has been reached. This allows the indicator CypherPattern_ULTRA V1 to give early signals. In the default settings, the signals are displayed with a blue background on the chart.
NO REPAINT
As soon as the most points of the pattern are developed, the last point is a fix prediction without any repaints!
CypherPattern_ULTRA V1 is offered for sale. More information can be found below in the signature.
In the settings it is possible to change the degree of details. This is sometimes necessary because TradingView limited only 55 lines per indicator in Pinescript Version 4.
In extreme cases it is possible to change the settings to "lite" that the Cypher Pattern represent waves only with 2 lines. This allows the indicator to detect far more Cypher Pattern on the same chart.
For more great indicators everyone is invited to follow me on TradingView.
Kind regards
NXT2017
