SMC - Institutional Confidence Oscillator [PhenLabs]📊 Institutional Confidence Oscillator
Version: PineScript™v6
📌 Description
The Institutional Confidence Oscillator (ICO) revolutionizes market analysis by automatically detecting and evaluating institutional activity at key support and resistance levels using our own in-house detection system. This sophisticated indicator combines volume analysis, volatility measurements, and mathematical confidence algorithms to provide real-time readings of institutional sentiment and zone strength.
Using our advanced thin liquidity detection, the ICO identifies high-volume, narrow-range bars that signal institutional zone formation, then tracks how these zones perform under market pressure. The result is a dual-wave confidence oscillator that shows traders when institutions are actively defending price levels versus when they’re abandoning positions.
The indicator transforms complex institutional behavior patterns into clear, actionable confidence percentiles, helping traders align with smart money movements and avoid common retail trading pitfalls.
🚀 Points of Innovation
Automated thin liquidity zone detection using volume threshold multipliers and zone size filtering
Dual-sided confidence tracking for both support and resistance levels simultaneously
Sigmoid function processing for enhanced mathematical accuracy in confidence calculations
Real-time institutional defense pattern analysis through complete test cycles
Advanced visual smoothing options with multiple algorithmic methods (EMA, SMA, WMA, ALMA)
Integrated momentum indicators and gradient visualization for enhanced signal clarity
🔧 Core Components
Volume Threshold System: Analyzes volume ratios against baseline averages to identify institutional activity spikes
Zone Detection Algorithm: Automatically identifies thin liquidity zones based on customizable volume and size parameters
Confidence Lifecycle Engine: Tracks institutional defense patterns through complete observation windows
Mathematical Processing Core: Uses sigmoid functions to convert raw market data into normalized confidence percentiles
Visual Enhancement Suite: Provides multiple smoothing methods and customizable display options for optimal chart interpretation
🔥 Key Features
Auto-Detection Technology: Automatically scans for institutional zones without manual intervention, saving analysis time
Dual Confidence Tracking: Simultaneously monitors both support and resistance institutional activity for comprehensive market view
Smart Zone Validation: Evaluates zone strength through volume analysis, adverse excursion measurement, and defense success rates
Customizable Parameters: Extensive input options for volume thresholds, observation windows, and visual preferences
Real-Time Updates: Continuously processes market data to provide current institutional confidence readings
Enhanced Visualization: Features gradient fills, momentum indicators, and information panels for clear signal interpretation
🎨 Visualization
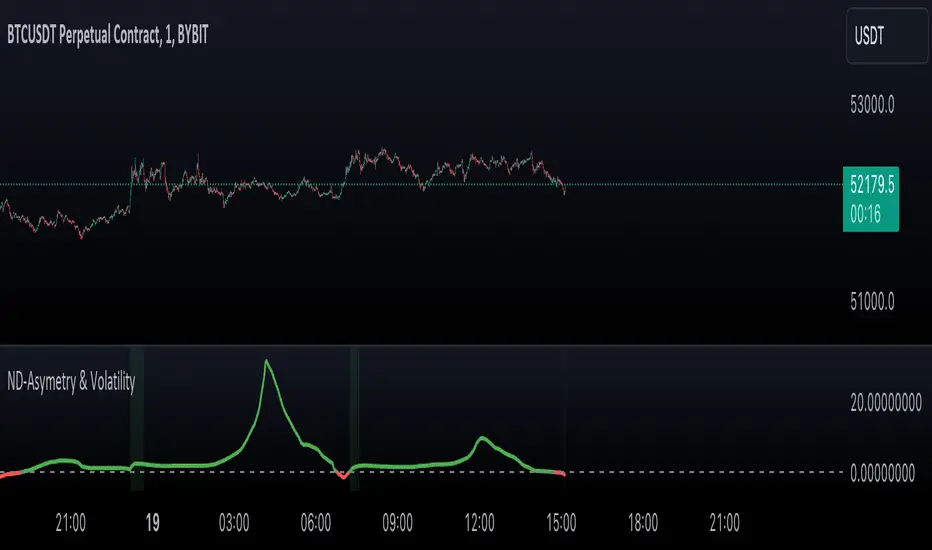
Dual Oscillator Lines: Support confidence (cyan) and resistance confidence (red) plotted as percentage values 0-100%
Gradient Fill Areas: Color-coded regions showing confidence dominance and strength levels
Reference Grid Lines: Horizontal markers at 25%, 50%, and 75% levels for easy interpretation
Information Panel: Real-time display of current confidence percentiles with color-coded dominance indicators
Momentum Indicators: Rate of change visualization for confidence trends
Background Highlights: Extreme confidence level alerts when readings exceed 80%
📖 Usage Guidelines
Auto-Detection Settings
Use Auto-Detection
Default: true
Description: Enables automatic thin liquidity zone identification based on volume and size criteria
Volume Threshold Multiplier
Default: 6.0, Range: 1.0+
Description: Controls sensitivity of volume spike detection for zone identification, higher values require more significant volume increases
Volume MA Length
Default: 15, Range: 1+
Description: Period for volume moving average baseline calculation, affects volume spike sensitivity
Max Zone Height %
Default: 0.5%, Range: 0.05%+
Description: Filters out wide price bars, keeping only thin liquidity zones as percentage of current price
Confidence Logic Settings
Test Observation Window
Default: 20 bars, Range: 2+
Description: Number of bars to monitor zone tests for confidence calculation, longer windows provide more stable readings
Clean Break Threshold
Default: 1.5 ATR, Range: 0.1+
Description: ATR multiple required for zone invalidation, higher values make zones more persistent
Visual Settings
Smoothing Method
Default: EMA, Options: SMA/EMA/WMA/ALMA
Description: Algorithm for signal smoothing, EMA responds faster while SMA provides more stability
Smoothing Length
Default: 5, Range: 1-50
Description: Period for smoothing calculation, higher values create smoother lines with more lag
✅ Best Use Cases
Trending market analysis where institutional zones provide reliable support/resistance levels
Breakout confirmation by validating zone strength before position entry
Divergence analysis when confidence shifts between support and resistance levels
Risk management through identification of high-confidence institutional backing
Market structure analysis for understanding institutional sentiment changes
⚠️ Limitations
Performs best in liquid markets with clear institutional participation
May produce false signals during low-volume or holiday trading periods
Requires sufficient price history for accurate confidence calculations
Confidence readings can fluctuate rapidly during high-impact news events
Manual fallback zones may not reflect actual institutional activity
💡 What Makes This Unique
Automated Detection: First Pine Script indicator to automatically identify thin liquidity zones using sophisticated volume analysis
Dual-Sided Analysis: Simultaneously tracks institutional confidence for both support and resistance levels
Mathematical Precision: Uses sigmoid functions for enhanced accuracy in confidence percentage calculations
Real-Time Processing: Continuously evaluates institutional defense patterns as market conditions change
Visual Innovation: Advanced smoothing options and gradient visualization for superior chart clarity
🔬 How It Works
1. Zone Identification Process:
Scans for high-volume bars that exceed the volume threshold multiplier
Filters bars by maximum zone height percentage to identify thin liquidity conditions
Stores qualified zones with proximity threshold filtering for relevance
2. Confidence Calculation Process:
Monitors price interaction with identified zones during observation windows
Measures volume ratios and adverse excursions during zone tests
Applies sigmoid function processing to normalize raw data into confidence percentiles
3. Real-Time Analysis Process:
Continuously updates confidence readings as new market data becomes available
Tracks institutional defense success rates and zone validation patterns
Provides visual and numerical feedback through the oscillator display
💡 Note:
The ICO works best when combined with traditional technical analysis and proper risk management. Higher confidence readings indicate stronger institutional backing but should be confirmed with price action and volume analysis. Consider using multiple timeframes for comprehensive market structure understanding.
Pine Script®指标