CFDGOLD交易观点

金汇得手:黄金开盘拉升 接近3363继续做多 美元指数昨天收长下影阴线,今日关注97.8-97.2区间,强支撑96.9附近。
黄金昨天震荡上涨,不过晚间触及3370附近出现回落,日线收十字星。早盘3356一线企稳拉升10美金多,目前不是太好操作,不过我们还是建议低多为主。目前支撑就是日内地点附近,触及可以做多。小周期支撑在3362附近,接近这个位置可以先多。目标先看3371附近,破位依旧看3378,行情一旦站稳3378,大概率还会去3400上方。
操作建议:接近3362或日内低点多,3380或90上方再短空。昨天3343多,3350多,3354多,3374空单没到。
原油昨天比较符合预期,62.6受阻回落,最低到61.3附近企稳,日线收阴线十字星。结合大周期,今天倾向震荡偏多,因为周线不支持大涨。建议接近61.7或昨天低点多,上方接近昨天高点不破小止损空,或63.2附近再空。分析仅供参考,实盘为准。


如何利用前一日的高低点来判断市场偏见(daily bias)和流动性抽离(draw on liquidity)?如何利用前一日的高低点来判断市场偏见(daily bias)和流动性抽离(draw on liquidity):
使用前一日高低点、周高低点、摆动点(swing points)、失败位移(failure to displace)以及次日模型(next day model)等概念。
前一日的高点和低点是判断市场偏见和流动性抽离的重要参考:
如果价格没有突破前一日的高点或低点,则可能趋向于触及这些水平。
前一日高点和低点也可以作为流动性池,用于框定反转。
如何根据前一日高低点来预测价格走势?
例如在上升趋势中预期价格会触及前一日高点,在下降趋势中预期价格会触及前一日低点。
每周的高点和低点可以用来框定更长时间周期的市场偏见和反转点:
当价格触及或未能突破周高低点时,可以预期价格会出现反转。
在周线图上标记出周高低点,并观察价格在这些点位附近的反应。
旧的高点和低点可以作为潜在的反转点。
当价格未能突破摆动点时,可以形成市场偏见。
如果价格未能跌破一个摆动低点,偏见可能是上涨;反之,如果价格未能突破一个摆动高点,偏见可能是下跌。
利用前一天的价格行为来预测次日的价格走势。
当价格未能突破前一天的低点时,预期次日价格上涨。
当价格触及并回撤到前一天的高点时,预期次日价格下跌。
如何在不同时间框架上应用次日模型,例如在日线图和小时图上。
使用前一日高低点和摆动点来确定入场时机和目标。
如何在伦敦时段识别价格模式并执行交易?
结合公平价值缺口(fair value gap)和次日模型来制定交易计划。
如何在纽约时段利用相应工具进行交易,并设置止损和盈利目标?
核心观点是通过分析前一日的高低点、周高低点、摆动点以及价格对这些关键点的位移情况,交易员可以有效地判断市场的短期偏见和流动性抽离点。这些技术可以帮助交易员在不同的时间框架上制定交易策略,并提高交易的成功率。个人多个实例进一步说明这些概念的实际应用,展示了如何将理论转化为具体的交易决策。

CPI公布后黄金强势拉升——337x 或成反转前最后目标? MMFLOW 技术展望
📌 市场概览
在 CPI 数据公布后,黄金迅速出现强劲买盘(FOMO BUY),价格从 333x 区域快速拉升至 335x。
主要驱动力来自多头利用上方剩余流动性缺口,目标突破关键阻力 3358 —— 这是到达 337x 前的首个重要关口,而 337x 则是此前空头防守的核心平衡区间。
当前结构显示:
短期趋势:偏多,但已接近关键分配区。
流动性捕猎:如果在成交量配合下有效突破 3358,价格可能快速冲击 337x,触发挂单的空头成交量。
宏观背景:今日无重大消息,预计日内波动约 35–40 美元,存在突破前震荡吸筹的可能。
🧐 技术分析 – MMFLOW 视角
市场结构:黄金在 333x 附近形成 Higher Low(更高低点),目前正在测试短期阻力。
关键价位与流动性区:
买盘流动性区(BUY ZONE)位于 3338–3336,已多次被防守,显示多头意愿强。
供应区 / CP 区(SELL ZONE)在 3375–3377,与 H1 时间框架的订单区重合,聚集了大量挂单空单。
成交量流向:随着价格逼近阻力,成交量增加,可能出现“最后一推”后反转。
🎯 MMFLOW 交易计划
🔹 BUY SCALP – 顺势做多
入场:3338 – 3336
止损:3332
止盈:3342 – 3346 – 3350 – 3355 – 3360 – 3370 – 3380
🔹 SELL SCALP – 分配区做空
入场:3375 – 3377
止损:3382
止盈:3370 – 3365 – 3360 – 3355 – 3350 – 3340
📊 关键技术位
阻力:3358 – 3365 – 3376
支撑:3342 – 3337 – 3330 – 3310
💡 MMFLOW 观点:
当前行情下,最优策略是在早期支撑位(334x 附近)等待买入机会,顺势跟进短线多头动能;随后密切关注 337x 的价格反应,一旦上方流动性被扫,可寻找做空机会。

PPI数据公布后,黄金价格小幅回升OANDA:XAUUSD 指数小幅反弹,目前交易价格在3,351美元/盎司附近。美国7月份通胀数据利好,强化了市场对美联储9月份降息的预期,而美元走弱则增强了黄金的吸引力。
温和的通胀支撑了降息预期。
美国劳工统计局的数据显示,7月份消费者物价指数(CPI)同比上涨2.7%,低于预期的2.8%,且与6月份持平。
核心CPI同比上涨3.1%,环比上涨0.3%,为六个月以来的最大涨幅。
尽管核心通胀率仍高于美联储的目标,但整体数据被市场解读为支持降息。美元指数跌至98.02,使非美元黄金更具吸引力。
市场数据显示,交易员押注美联储在9月和12月降息的可能性仍然很高。
随后美国将公布每周生产者价格指数、零售额和初请失业金人数数据,这些数据可能会影响政策前景。
观点:低利率和政治不确定性正在为金价新一轮飙升铺平道路。
美联储独立性的不确定性以及各国央行持续购买黄金是支撑金价的关键因素。今年上半年,黄金ETF需求增速达到2020年初以来的最快水平。
如果美联储的独立性受到越来越多的质疑,黄金作为避险资产的价值将大幅提升。黄金是法定货币(美元)的制衡货币,一旦投资者对各国央行的独立性产生质疑,黄金需求就会增加。
外汇市场波动与避险需求
近期围绕贸易政策的不确定性加剧了全球外汇市场的波动性。
印度卢比兑美元汇率接近历史低点,印度储备银行至少抛售了50亿美元以支撑汇率。
美元在短暂上涨后走弱,人民币则保持稳定。
美元走弱略微增加了黄金的相对吸引力,导致避险需求复苏。
技术前景分析 OANDA:XAUUSD
金价有所走强,但其反弹势头依然受限,关键阻力位为 21 点均线 (EMA) 和 0.236% 斐波那契回撤位。若金价突破 0.236% 斐波那契回撤位,则金价或将继续上涨至 3,400 美元,从而开启新的看涨周期。
然而,在当前水平,受 21 点均线 (EMA) 和 0.236% 斐波那契回撤位的支撑,金价仍有可能重新测试 3,310-3,300 美元区域。这意味着 3,310-3,300 美元区域为上涨趋势提供了重要支撑。只要金价维持在 3,300 美元上方,短期内仍有上涨空间。然而,如果价格跌破 3,300 美元(由 3,292 美元以下的价格走势确认),将开启下行趋势,短期内下一个目标价位在 3,246 美元左右。
全天金价走势总体呈横盘整理,市场行情和指标均衡,相对强弱指数 (RSI) 徘徊在 50 左右,反映出市场犹豫不决。我个人倾向于看涨,并建议一旦突破 3,300 美元关口,就保护未平仓的多头仓位。
关键仓位也列于下方。
支撑位:3,310 – 3,300 – 3,292 美元
阻力位:3,350 – 3,371 – 3,400 美元
卖出 XAUUSD:价格 3,391 - 3,389⚡️
↠↠ 止损 3,395
→止盈 1 3,383
↨
→止盈 2 3,377
买入 XAUUSD:价格 3,299 - 3,301⚡️
↠↠ 止损 3,295
→止盈 1 3,307
↨
→止盈 2 3,313

Gold - Sell near 3358, target 3340-3320Gold Market Analysis:
Yesterday's daily doji formed a doji, signaling a short-term market swing. The broader selling trend in gold remains evident. This is the first correction after the sharp daily drop, and it's a normal technical correction. Trading can be done by scalping back and forth by a dozen or so pips. If you want to follow the trend, sell at a high price. Yesterday, we planned to sell at 3358, 3355, and 3348. Today, I'm sticking with the strategy of selling. We're focusing on a single point; if it doesn't break, we can continue selling. Yesterday, we analyzed 3380, a bottleneck in the market. If it breaks, it will essentially form a large V-shaped pattern, leaving us with time to adjust our strategy. Yesterday's low was 3330, so it's almost certain that selling will continue today. However, the volatile market is also likely to continue. Try to sell only after the market rebounds.
During the Asian session, keep an eye on the first resistance level at 3358. Continue selling near this level. If it unexpectedly breaks above, 3367 is also a selling opportunity. The longer gold hovers within this range, the greater the potential for further declines. The probability of a direct reversal on the daily chart is low. The next level of support is around 3300, where we anticipate a major daily rebound.
Support levels are 3330 and 3300, while resistance levels are 3358 and 3367. The dividing line between strength and weakness is 3350.
Fundamental Analysis:
Yesterday's CPI data was mixed, generally supporting gold while suppressing the US dollar. However, the price action was minimal, and gold is expected to maintain a period of volatile correction.
Trading Recommendations:
Gold - Sell near 3358, target 3340-3320

Gold prices are waiting for a major breakthrough!Market News:
Spot gold prices fluctuated in early Asian trading on Wednesday (August 13), currently trading around $3,345/oz. Mild US inflation data for July has further intensified market bets on a September Federal Reserve rate cut, and a weakening US dollar has boosted the appeal of international gold. Combined with the positive news of an extended US-China tariff truce, the gold market is at a critical turning point!
For London gold prices, expectations of a rate cut are a strong catalyst, as lower interest rates weaken the dollar's appeal and reduce the opportunity cost of holding gold. While gold could face short-term pressure if inflation unexpectedly spikes, the current data reinforces its position as a safe-haven asset, attracting buyers from other currencies, particularly as a weaker US dollar further reduces the cost of gold.
While the market will focus in the short term on this week's PPI, unemployment benefits, and retail sales data, in the long term, the Federal Reserve's accommodative policy and geopolitical uncertainty will continue to support gold's upside potential.
Technical Analysis:
The US dollar index surged, then retreated back to 98.0. Gold dipped to 3330.9 in late trading before bottoming out and rebounding, closing with a small bullish candlestick pattern on the daily chart. The daily chart is currently trading at the middle Bollinger Band level, with the RSI indicator adjusting towards its neutral 50-value midpoint. The hourly Bollinger Bands are converging, the moving averages are converging, and the RSI is moving towards its midpoint. The four-hour chart saw heavy volume dip to the 30-level, testing the lower Bollinger Band before re-entering 3350. The 10-day and 7-day moving averages are converging. Gold trading strategies continue to favor short-term trading in a wide range.
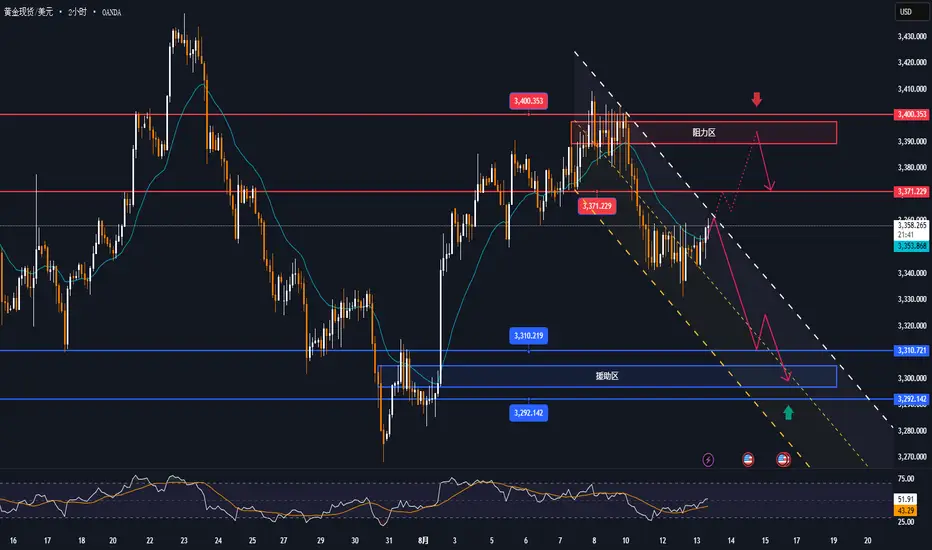
Based on the current gold market trend analysis, the prevailing pattern remains a broad, sweeping range between 3450 and 3250, a stalemate that has persisted for two to three months. This pattern of holding highs, breaking lows, and maintaining a sustained decline indicates that the previous bullish, volatile market has been disrupted. The new structure could face two potential scenarios: one is a transitional period of neither strong nor weak sweeping activity, building momentum through broad consolidation for subsequent direction; the other is a turning point above 3400, with the market gradually extending downward, leading to a volatile selling strategy.
Given the non-unilateral nature of the structure, after such a significant decline, caution is warranted regarding the need for corrections in the Asian session. The intraday strength will depend on the strength and duration of the correction. If the rebound is weak and the market is effectively suppressed, the market may continue to fluctuate in a bearish, volatile market. Conversely, if key support is maintained and the market stabilizes, a return to a sweeping transition could occur.
Trading strategy:
Short-term gold: Buy at 3322-3325, stop loss at 3314, target at 3350-3370;
Short-term gold: Sell at 3357-3360, stop loss at 3369, target at 3330-3310;
Key points:
First support level: 3332, second support level: 3318, third support level: 3303
First resistance level: 3355, second resistance level: 3368, third resistance level: 3380

GOLD还是突破回踩做多, 其他要接多形成SMC 模式后确认多以及扫流动性后形成模型再做多,低吸继续保留。TVC:GOLD 还是突破回踩做多, 其他要接多形成SMC 模式后确认多以及扫流动性后形成模型再做多,低吸继续保留。


金汇得手:黄金昨日震荡下跌 今日主多辅空操作 美元指数昨天二次上探没新高回落,日线收阴,今日关注98-97.3区间。
黄金昨天早盘3359附近受阻回落,日内来回震荡洗盘,晚间触及3331关键支撑反弹,日线收十字星。今天倾向低多,日线支撑3340附近,触及可以做多。不过凌晨回落的低点在3345附近,如果行情走强会在3345上方运行。上方目标先看3354附近,一旦上破3359昨天高点大概率挡不住,还会去3368甚至3377附近,不破可以继续空。下方如果意外跌破3331,先看3320附近,强支撑3291附近。
操作建议:先跌接近3340多,走强的话3345先多,看破3359。接近3368或3377再空。昨天给出3363空,3342和3331多单。
原油二次上探没新高回落,日线收阴。早盘回落出新低,建议接近62.7不破先空,震荡的话63附近空。目标62.3破位看61.6附近,然后小止损博多。分析仅供参考,实盘为准,注意原油报价未统一。


黄金本周开盘暴跌50美元——逼近流动性区——静待CPI决定下一步走向📌 市场回顾
黄金本周开盘大幅下跌50美元,连续跌破关键趋势线和临近支撑位。
本轮抛压主要来自:
前期涨势后的获利了结
市场预期美元走强,因为CPI数据预测比上期好约0.1%
地缘政治因素:乌克兰–俄罗斯停火谈判接近尾声,触发避险情绪
🧐 接下来怎么走?
如果CPI优于预期 → 美元走强 → 黄金可能进一步下探至333x – 330x 流动性区
如果CPI不及预期 → 美元走弱 → 黄金可能迅速反弹至337x关键价位(此前跌破的区域)回测后再选择方向
🎯 MMFLOW 交易计划
1️⃣ 短线多单(BUY SCALP)
📌 入场:3331 – 3329
📌 止损:3325
📌 止盈:3335 – 3340 – 3345 – 3350 – 3360 – 3370 – 3380
2️⃣ 买入区(BUY ZONE)
📌 入场:3310 – 3308
📌 止损:3304
📌 止盈:3314 – 3318 – 3322 – 3326 – 3330 – 3335 – 3340 – 3350 – 3360 – ???
3️⃣ 短线空单(SELL SCALP)
📌 入场:3363 – 3365
📌 止损:3370
📌 止盈:3360 – 3356 – 3352 – 3348 – 3344 – 3340
4️⃣ 卖出区(SELL ZONE)
📌 入场:3376 – 3378
📌 止损:3382
📌 止盈:3372 – 3368 – 3364 – 3360 – 3355 – 3350 – 3340
⚠️ 风险提示
CPI将成为市场的“掷骰子”时刻——即使是微小差异,也可能引发大规模止损扫盘。
下单前请务必关注图表上标注的关键价位(KeyLevel)。

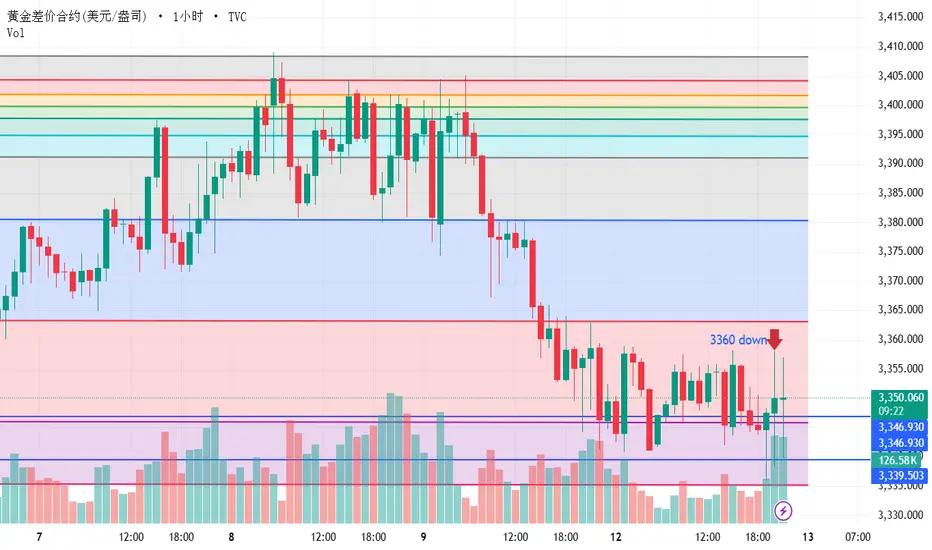
After the release of CPI, the short-term gold operation strategyThe CPI data for gold is bullish. Gold has soared directly from around 3340, reaching a high of around 3354 and starting an oscillation mode. Currently, gold is still oscillating around 3349, with strong pressure from above. We will continue to focus on the pressure at 3366 and 3370 to go short and bearish.
如何交易一根周蜡烛图?一根蜡烛图从出生到成长到成熟到最后死亡必不可少的四个过程:积累、操纵、派发、延续或反转。这就是市场构架,也是银行算法交易的运行过程。你交易前必须领悟到的东西。否则你就会乱撞。这只是演示,不代表后面一定这样走的,需要实时跟踪,根据变化而灵活地做出决定。

黄金因等待通胀数据而犹豫不决OANDA:XAUUSD 货币对在 8 月 11 日星期一承压,并在 8 月 12 日星期二上午小幅回升。美国总统特朗普确认不会对黄金进口征收关税,缓解了市场对全球供应链中断的担忧。投资者目前正等待本周公布的美国通胀数据,以评估美联储的利率前景。
关税疑虑终结
特朗普在推特上写道:“黄金不会征收关税!”,但没有提供更多细节。这一声明为全球黄金市场带来了一丝慰藉。
作为全球黄金运输和精炼中心,瑞士曾被认为是“最大的受害者”,但特朗普的最新声明实际上消除了这一风险。
投资者的注意力现在转向通胀。
随着关税不确定性的缓解,交易员将转向其他市场因素,其中最重要的是美联储的利率前景。
• 如果美国通胀数据高于预期,美联储可能会推迟 9 月份的降息,这将给金价带来压力。
• 相反,如果数据温和甚至疲软,这将支撑金价,因为市场对降息的预期增强。
市场前景
短期来看,关税担忧缓解后,金价进入回调阶段,价格走势可能进一步受到美元和通胀数据的影响。
如果通胀保持在低位,且美联储发出鸽派信号,金价将维持强劲支撑位。反之,如果通胀超预期且美元走强,金价可能面临进一步回调的风险。
中长期来看,在全球经济不确定性和低利率可能持续的背景下,黄金仍是避险资产和宝贵的资产配置渠道。
市场预计7月份核心CPI同比涨幅将达3.0%,高于6月份的2.9%。关税成本的征收可能引发商品通胀反弹。
• 如果数据好于预期,美联储可能会推迟降息。
• 相反,降息将增加9月份降息的可能性,目前期货合约的降息概率为87%。
技术前景分析 OANDA:XAUUSD
黄金价格走强,交投于 21 点移动平均线 (EMA) 附近,表明整体市场情绪依然犹豫,等待基本面突破。
短期内,黄金价格面临来自 21 点移动平均线 (EMA) 和 0.236% 斐波那契回撤位的技术压力。黄金价格要满足持续看涨前景的所有条件,必须突破该斐波那契回撤位,之后短期目标位为 3,400 美元。
如果黄金价格继续突破 3,400 美元并保持在此水平之上,则可能开启新的看涨周期,下一个目标位为 3,430-3,450 美元。
另一方面,黄金价格仍保持在 3,300 美元上方,避免出现熊市。这意味着,只要金价维持在 3,300 美元的初始价格和 0.382% 的斐波那契回撤位上方,短期内仍可能走强。
如果金价跌破 3,300 美元,则将进入熊市。短期目标价位为 3,246 美元,高于 0.50% 斐波那契回撤位。
动量方面,相对强弱指数 (RSI) 徘徊在 50 左右,表明市场情绪犹豫不决,但突破 50 则可能是看涨潜力的积极信号。
就今日而言,整体前景依然看涨,以下列出了需要注意的要点。
支撑位:3,340 美元 – 3,310 美元 – 3,300 美元
阻力位:3,371 美元 – 3,400 美元
卖出 XAUUSD:价格 3,377 - 3,375 ⚡️
↠↠ 止损 3,381
→止盈 1 3,369
↨
→止盈 2 3,363
买入 XAUUSD:价格 3,298 - 3,300 ⚡️
↠↠ 止损 3,294
→止盈 1 3,306
↨
→止盈 2 3,312

Gold - Sell around 3362, target 3340-3320Gold Market Analysis:
Yesterday's daily close was a large negative candlestick, which wiped out five days of gains. We sold at 3369 yesterday to take profits. Yesterday's close was a clear reversal signal, and the analysis chart also shows a breakout signal. The large negative candlestick pattern on the daily chart reaffirms the sell position. Today's strategy is undoubtedly bearish, and we should continue to sell on rebounds. Today's CPI data is out, and I believe we can still maintain our selling strategy before the data is released. Let's look at the daily chart. The current selling is only short-term, and the long-term direction remains uncertain. The daily chart is still in a wave structure and is still in the process of correction. Its overall direction is unclear. We are just followers, and we need to find its rhythm and follow it, either buying or selling. The 1-hour profit-taking chart shows that 3366 is the first minor resistance level in the Asian session today, and 3362 is the hourly high. We will continue to sell based on this level. The 1-hour high of yesterday's rebound was around 3380, which has become a new strong resistance level. If this level is not broken, it is basically a sell-off. On the contrary, if it unexpectedly breaks, it is necessary to adjust the strategy and rhythm. Gold's recent fundamentals and data have a significant impact on the market, and the buying and selling cycles are very fast.
Support 333 and 3341, resistance 3366 and 3380, and the watershed between strength and weakness is 3362.
Fundamental Analysis:
Today, focus on the most important data this week, CPI. This economic data has recently moved significantly, even surpassing the non-farm payroll data.
Trading Recommendation:
Gold - Sell around 3362, target 3340-3320


Gold prices plummeted! Gold was sold off strongly!Market News:
Spot gold prices fluctuated narrowly in early Asian trading on Tuesday (August 12), currently trading around $3,355 per ounce. Gold prices plummeted on Monday after Trump announced he would not impose tariffs on gold imports, putting significant pressure on London gold prices. The renewed extension of the US-China trade tariff truce, potential progress in Russia-Ukraine peace talks, and market anxiety over upcoming US inflation data have collectively weakened gold's safe-haven appeal, accelerating a price decline and sell-off. Amidst multiple negative headwinds, market attention is turning to the upcoming US inflation data. The Consumer Price Index (CPI) will be released on Tuesday, followed by the Producer Price Index (PPI) on Thursday. These figures will provide key insights into the Federal Reserve's interest rate path. If inflation data falls short of expectations, bets on a rate cut will strengthen, benefiting gold. Conversely, if inflation exceeds expectations, further dollar strength will weigh on international gold prices.
Technical Analysis:
Technically, the gold daily chart closed with a single, large, bearish candlestick, breaking below 3345, the low since August 4th. The New York closing price fell below the 10/7-day moving average at 3350. Gold is poised for a short-term correction due to data news. The short-term four-hour moving average formed a downward crossover at 3380, the RSI indicator is trading below its mid-axis, and the Bollinger Bands on the hourly chart are opening downward, with prices trading within the lower mid-range. Looking at the current gold market, yesterday's sharp drop has wiped out the buying advantage created by last week's weekly close. Next, focus on the direction of the market after the major market move: Support in the 3375-3380 area has been broken, and subsequent resistance could continue to be based on the intraday high and last week's high, maintaining a selling strategy. The 3340 area below is a key support level. If this level holds, buying could trigger a rebound at any time. However, if it does, the market will immediately return to selling.
Trading Strategy:
Short-term gold buy at 3332-3335, stop loss at 3324, target at 3360-3380;
Short-term gold sell at 3376-3379, stop loss at 3388, target at 3350-3330;
Key Points:
First Support Level: 3340, Second Support Level: 3333, Third Support Level: 3320
First Resistance Level: 3368, Second Resistance Level: 3381, Third Resistance Level: 3396
