【XAUUSD】黄金打破上方趋势阻力?回踩等待多头机会?【0827黄金日报】
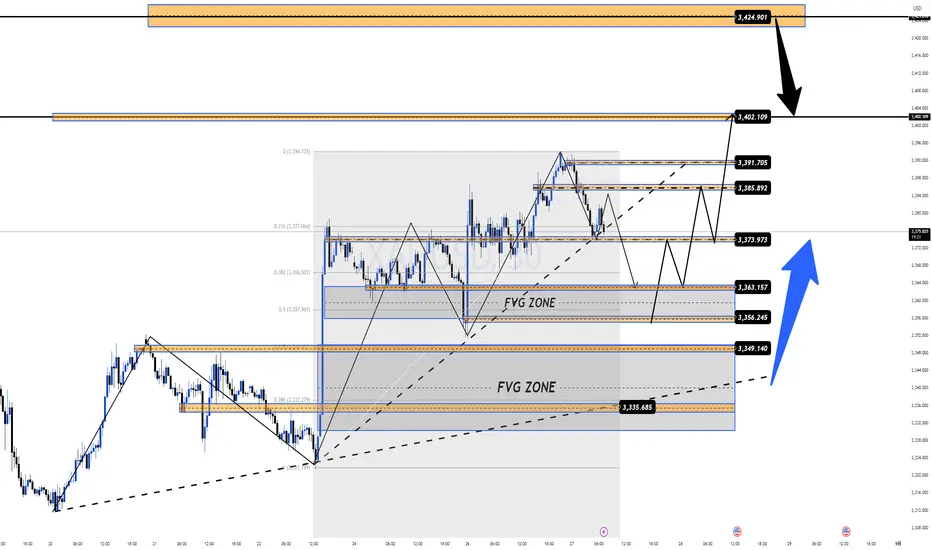
昨日行情在3370-80区间震荡,随后在晚间突破;从当前1小时周期来看,目前行情上破上沿趋势线压制走“震荡上行”态势,但目前临近潜在“886反转区域”耐心等待合适结构性机会——日内多空关键位3380
PlanA:回踩多关键位3380+多头信号进场,备选关键位3370
PlANB:当前临近88.6反转区域,耐心等待关键位3398+RCT反转信号
PS:remind 提醒信号----confirm确认信号----trade交易信号,需要学习资料可以主页添加我vx
(详细思路看图,以上内容仅供参考学习,不构成投资买卖建议)
交易观点

美元回升,金价下跌近20美元摘要:金价 OANDA:XAUUSD 继上一交易日大幅上涨后,8月27日(周三)亚洲时段大幅下跌。目前金价在3,374美元/盎司左右,当日下跌近20美元。
金价 OANDA:XAUUSD 已从周三早盘触及的两周高点3,400美元/盎司附近回落。然而,对美联储独立性的担忧以及近期美国关税威胁可能会缓解金价的下行压力。
美元指数 TVC:DXY 周三反弹,给金价带来下行压力。然而,美元的涨幅似乎受到对美联储和关税担忧的限制。
OANDA:XAUUSD 有可能走弱,因为投资者寻求逢低买入。周二,美国总统唐纳德·特朗普宣布解雇美联储主席蒂姆·库克,此举动摇了投资者对美联储独立性的信心,并提振了对避险资产的需求,金价创下两周新高。
此外,彭博社周二报道称,美国总统特朗普威胁将对先进技术和半导体征收新的关税和出口限制,以报复其他国家对美国科技公司征收的数字服务税。特朗普最近的大胆举动再次引发了美国贸易伙伴之间的关税不确定性。本月早些时候,在与数十个伙伴就针对特定国家的关税问题结束谈判后不久,特朗普宣布对一系列进口商品征收新的关税。上周,他又宣布对进口家具征收新的关税。
技术展望分析 OANDA:XAUUSD
黄金尚未触及 3,400 美元的上行目标,但在此水平附近承压,今日早盘有所下跌。现货黄金目前交易价为 3,376 美元,接近 0.236% 的斐波那契回撤位。突破该水平后,黄金目前处于最近的技术支撑位,跌破该支撑位后,黄金可能重新测试 21 日移动平均线 (EMA),即 3,350 美元左右。
正如之前向读者报告的那样,黄金整体走势仍处于横盘整理阶段。RSI 在 50 左右,表明市场对动能的不确定性持续存在。当黄金具备形成长期趋势的充分条件时,我会立即向读者更新最新动态。然而,目前短期内,黄金存在多项技术因素支撑金价可能上涨,支撑位位于0.236%斐波那契回撤位、21日移动平均线(EMA)以及50上方的RSI。
然而,在当前横盘整理期间,短期持仓仍应优先考虑,同时需关注以下关键点:
支撑位:3,371 – 3,350美元
阻力位:3,400 – 3,430美元
卖出XAUUSD,价格:3,430 – 3,428⚡️
↠↠ 止损位:3,434
→止盈1,价格:3,322
↨
→止盈2,价格:3,316
买入XAUUSD,价格:3,350 – 3,352⚡️
↠↠ 止损3,346
→止盈 1 3,358
↨
→止盈 2 3,364

黄金日内计划 – 关键支撑与阻力位解析黄金近期继续保持强劲的上涨势头,受到美元走弱预期及市场FOMO买盘的推动。当前价格逐渐逼近关键阻力区间,短线或将迎来 1-2 天的小幅回调。对于交易者来说,等待价格回落至重要支撑位后布局多单,仍是更具优势的策略。
🔎 短线展望
若价格跌破 337x 区域结构,可能会快速回落至 335x-334x 区域,以回补流动性。
长期趋势依旧保持看涨,潜在目标指向 新高 (ATH)。
📍 关键价位参考
支撑位:3363 – 3356 – 3349 – 3335
阻力位:3385 – 3391 – 3402 – 3425
🎯 交易计划
✅ 多单思路
BUY SCALP: 3356 – 3354
SL: 3350
TP: 3360 / 3365 / 3370 / 3375 / 3380 / 3390 / 3400+
BUY ZONE: 3336 – 3334
SL: 3330
TP: 3340 / 3345 / 3350 / 3360 / 3370 / 3380 / 3400+
❌ 空单思路
SELL SCALP: 3385 – 3387
SL: 3390
TP: 3380 / 3375 / 3370 / 3365 / 3360 / 3350
SELL ZONE: 3401 – 3403
SL: 3407
TP: 3396 / 3390 / 3380 / 3370
📌 总结
短线或有小幅调整,但中长期趋势仍偏多。建议重点关注下方关键支撑区域,耐心等待价格回落后布局多单,顺势持有,机会更优。
👉 各位交易员怎么看?你是倾向于 逢低做多 还是 高位短空?欢迎在评论区分享你的观点!

XAUUSD – 中期交易情景XAUUSD – 中期交易情景
各位交易者好,
黄金正在进入旗形形态的最后阶段。中期交易者正等待一个明确的突破信号,因为这将决定接下来的中长期交易方向。一旦价格确认突破,策略就是顺势立即进场。
与此同时,短线和日内交易者依旧在旗形区间内寻找剥头皮的机会。
在我看来,经过长时间的整理后,黄金向上突破并延续主要多头趋势的概率更高。为了优化进场,可以在下方趋势线附近买入,如果形态被跌破则立即止损。需要特别关注的关键区域是 斐波那契回撤 0.5(3354) —— 这里既是动态支撑,也是静态支撑,同时还是重要的斐波那契位置。这一区域是非常理想的中长期买入点。
另外,在 3372 附近也存在一个较早的买入机会,前一根K线显示了强烈的买盘动能。此处可尝试轻仓买入,并将止损设置在最近的支撑位下方。
该做多情景仅会在价格跌破下方趋势线并收出有效K线时失效,那将确认趋势反转。
祝大家在这一交易计划中取得好成绩。如果你也持相同观点,欢迎在评论区留言交流


金汇得手:黄金日线再次收阳 接近3380继续做多 美元指数昨天收阴,今日关注98.35-97.7区间,倾向继续收阴。
黄金昨天早盘急跌3351附近,迅速收回,日线震荡为主,后半夜拉升到目标3393附近。日线收阳,正常今天继续看涨,但是最近走势都是大阳之后小阴修正,所以今天要防止行情收阴。日线支撑3372附近,触及可以做多。小时线支撑在3382附近,如果走强顶底转换3386附近先涨。上方目标先看3394,站稳继续看3408-3415附近,强阻力趋势线3421附近,触及做空。
操作建议:先跌接近3382多,走强3386先多,3408附近或3420上方再空。昨天早盘建议3351附近多,3373和3368附近多。
原油昨天收阴,正常今天还有一跌,但是周线不支持大跌,所以今天暂时按照震荡思路。先涨建议接近63.8或64.3空,先跌接近62.7或62附近多。分析仅供参考,实盘为准。


XAU/USD – MMFLOW交易计划更新📅 2025年8月26日
黄金在H4级别突破了下降趋势线,显示出多头的强劲动能。
但下方依然存在较大的流动性缺口,市场可能会先洗盘回落,再继续拉升。
📊 市场背景
美元因政治和美联储的不确定性持续走弱。
特朗普推动降息 → 金价受益。
技术面:H4下降趋势线已被突破,多头占据主动。
短期可能震荡整理 + 快速扫止损。
⚡️ 关键位置
阻力位: 3378 → 3384 → 3400
支撑位: 3363 → 3354 → 3340
🔥 交易计划
✅ 短线做多 (Scalp Buy)
入场:3355 – 3353
止损:3349
目标:3360 → 3365 → 3370 → 3380 → 3390 → 3400+
✅ 多头主力区 (Buy Zone)
入场:3341 – 3339
止损:3335
目标:3345 → 3350 → 3355 → 3360 → 3365 → 3370 → 3380 → 3390 → 3400+
💠 短线做空 (Scalp Sell)
入场:3382 – 3384
止损:3388
目标:3378 → 3374 → 3370 → 3365 → 3360 → 3350
💠 高位做空区 (Sell Zone)
入场:3400 – 3402
止损:3406
目标:3395 → 3390 → 3385 → 3380 → 3370 → 3360
⚠️ 风险提示
可能会出现快速扫盘 → 止损触发很快。
日内行情大概率先震荡,再伴随急跌急涨。
交易需等待价格在关键位置的确认信号。
🎯 总结
黄金大方向依然偏多,但短期可能会有快速回踩收集流动性。
策略:支撑/流动性区间找多,阻力位止盈。
MMFLOW = 市场规则 | 关键位置 = 盈利
👉 问题:你认为黄金会直接冲击 3400 🚀,还是先快速下探支撑再拉升?

Smart Money Playbook:黄金下一步将猎取哪里流动性?黄金 SMC 每日计划 – 26/08
市场背景(SMC 视角):
价格在经历强劲的多头推动后,正于 3375 附近盘整。3385–3400 上方仍有未被触及的流动性,3354 附近存在 FVG,并且 3323–3327 有深度买入区。市场结构保持多头,除非价格跌破 3327。
SMC 关键区域
流动性池:3385–3400(可能先被扫清再反转)
FVG:3354 区域 – 关注价格反应
买入区:3323–3327(止损 3320)
BOS/ChoCH:3354 上方确认多头;若跌破 3327 则转为空头结构
交易情景(SMC逻辑)
1) BUY SCALP – 快速捕捉流动性
入场:3350–3352(FVG 支撑)
止损:3343
目标:3355 → 3360 → 3375 → 3385 → 3400+
理由: FVG 回补 + 多头 BOS 延续
2) BUY ZONE – 波段买入
入场:3339–3336(深度 OB)
止损:3334
目标:3340 → 3350 → 3360 → 3365 → 3370 → 3380 → 3390 → 3400+
理由: 价格可能先扫 3340 下方流动性再延续上行
3) SELL SCALP – 快速反转
入场:3380–3383(短线流动性上方)
止损:3385
目标:3378 → 3374 → 3370 → 3365 → 3360 → 3350
理由: 扫局部高点 → BOS 向下
4) SELL ZONE – 高风险大幅反转
入场:3400–3402
止损:3406
目标:3395 → 3390 → 3385 → 3380 → 3370 → 3360
理由: 猎取 3400 上方主要流动性后反转
今日 SMC 操作思路:
关注 3354 FVG 或 3327 深度买区 的 买入确认
若价格先扫 3385–3400,留意 BOS 确认后的卖出机会
空头结构仅在价格收盘低于 3327 时确认

黃金多頭格局未改,逢回檔尋找佈局良機黃金在創下歷史新高後進入高檔盤整,但推動其上漲的核心動力並未消失。短期波動加劇,但中長線的上行趨勢依然穩固。
核心利多 (Why Bullish?):
央行強力買盤 (The Central Bank Put):全球央行持續將黃金作為主要儲備資產,為金價提供了堅實的長期底部。
降息預期 (Rate Cut Looms):市場對聯準會(Fed)最終將降息的預期是最大催化劑。降息將降低持有黃金的成本,並可能削弱美元。
避險需求 (Safe-Haven Demand):地緣政治風險持續存在,黃金的避險屬性使其在市場不確定時仍受青睞。
潛在風險 (What to Watch):
聯準會立場:強於預期的美國經濟數據可能推遲降息時點,對金價造成短期壓力。這是目前最大的不確定性。
操作思路:
策略上,維持「逢低做多」的思路。
只要關鍵的技術支撐位未被跌破,任何因短期消息引發的顯著回檔,都應視為重新佈局多單的機會。留意本週將公布的通膨與就業數據,可能為市場帶來切入點。
免責聲明:本分析僅為個人觀點分享,不構成任何投資建議。


特朗普举措后,黄金价格飙升,但技术条件OANDA:XAUUSD 特朗普的决定引发美元飙升。美国总统唐纳德·特朗普决定解雇被指控伪造抵押贷款文件的美联储理事丽莎·库克。这一消息导致美元指数在8月26日星期二亚洲早盘大幅下跌,而现货黄金价格则上涨近35美元。
当地时间周一晚,美国总统特朗普在社交媒体平台Truth Social上发布了一封致美联储理事丽莎·库克的信,宣布立即免去她的职务。
在信中,特朗普表示:“根据美国宪法第二条和经修订的1913年《联邦储备法》赋予我的权力,我特此下令立即解除库克先生在联邦储备系统理事会的职务。
鉴于库克先生的欺诈性且可能构成犯罪的金融行为,我对他的诚信没有信心。”
至少,这些行动表明了他在金融事务上的严重疏忽,并质疑了他作为金融监管者的能力和可信度。
特朗普表示:“美国人民应该对制定政策和监督美联储的人的正直品格充满信心。但鉴于他在金融问题上的欺诈甚至犯罪行为,他们无法拥有这种信心,我对他的正直品格也没有信心。”
此前,美国司法部宣布计划对库克展开调查,此前联邦住房金融局局长比尔·普尔特因涉嫌抵押贷款欺诈被刑事起诉。
彭博社报道称,此次调查是特朗普政府加强对民主党人物监管并向美联储施压的一系列举措中的最新举措。
TVC:DXY 金价短期内暴跌至35美元附近。
特朗普解雇美联储理事库克后,美元兑所有主要货币均走弱。彭博社报道称,特朗普的决定削弱了公众对美元——世界储备货币——的信心。
库克的离职对美元造成冲击,因为这为特朗普总统任命一位可能更倾向于降低利率的新理事铺平了道路。这使人们对美元避险地位的基石——联邦公开市场委员会(FOMC)的独立性产生了质疑,并可能导致进一步的抛售。与美元直接相关的黄金无疑将从中受益。
技术前景分析 OANDA:XAUUSD
消息公布后,金价一度突破 0.236% 斐波那契回撤位,但目前已将盘中涨幅回吐至该水平下方。
然而,短期看涨前景的初步技术条件已经具备,金价突破 21 点均线,且相对强弱指数 (RSI) 高于 50。RSI 高于 50 且斜率明显,将是动量支撑的可靠信号。
总体而言,从技术角度来看,黄金尚未形成明确的长期趋势,横盘整理持续数月,如绿色矩形所示。
因此,在当前的技术条件下,短期交易是首选。本交易日的要点如下。
支撑位:3,350 – 3,310 – 3,300 美元
阻力位:3,371 – 3,400 – 3,430 美元
卖出 XAUUSD:价格 3,407 – 3,405⚡️
↠↠ 止损 3,411
→止盈 1 3,399
↨
→止盈 2 3,393
买入 XAUUSD:价格 3,350 – 3,352⚡️
↠↠ 止损 3,346
→止盈 1 3,358
↨
→止盈 2 3,364

黄金GOLD趋势与基本交易策略周线复合:混合周低点可能在未来2-3周确认。
日线复合:未来2-3天整体横盘上涨,完成⼀个⼩型修正。(牛)
关键因素:时间因素上,9⽉12⽇之前很可能出现周低点。8⽉19⽇的低点不太可能是周低点。
交易策略建议:⽬前没有交易策略,⽬标是识别黄⾦完成周度低点的位置。但在未来两周左右不太可能出现。
⚠ 短期交易者应以TradingBox信号系统为准!


黄金走势情景 – 跟随中期上升趋势黄金走势情景 – 跟随中期上升趋势
各位交易者好,
黄金依然在按照预期的路线运行。价格在斐波那契 1.618 阻力位 出现反应,相当于完成了一次流动性测试。目前,3368 区域被视为合理的买入区间。
此前的艾略特波浪 ABC 浪结构 已经走完,现在黄金似乎正在进入一个新的波浪循环。目前处于 第 3 浪上升阶段,在 H4 下降趋势线位置出现轻微回调,之后有望完成 第 5 浪突破,并向上突破通道,从而验证 H4 图上的旗形形态。
交易策略:在 3368 附近买入,止损严格设在前一波低点之下。
目标位:3410 附近是一个合理的获利点。之后预计进入第 4 浪调整,再寻找做空机会。
MACD 指标依旧表现积极,运行在均线之上,确认了上升动能仍然占据主导。当前关键在于把握合理的入场时机。
这是我对黄金短期至中期的个人观点,供大家参考。欢迎在评论区分享你的看法,一起交流。

黄金周计划 —— Jackson Hole 之后,是回调还是突破?上周,黄金在 Jackson Hole 年会 和美联储鸽派言论的推动下,出现了强势上涨。美元走弱让黄金迅速反弹,市场投资者开始期待 新的历史高点。但要注意,经历这样的大幅拉升后,价格往往会先经历一次 健康的回调,为下一轮上涨积蓄力量。
📊 技术面观察(H4)
黄金目前在一个 收敛三角形结构 内震荡,预示着即将迎来方向性突破。
上周五的大阳线确认了多头的主导,但历史经验告诉我们:黄金在大突破之前,经常会进行一次 深度回踩,借此洗出浮筹。
本周交易的关键在于:关注 FIBO 回调位 + 供需区间,耐心等待确认信号。
📌 关键水平(Key Levels)
阻力位:3370 – 3383 – 3400 – 3425
支撑位:3350 – 3340 – 3326 – 3315
🔥 交易计划(Trade Plan)
多单区域 🟢
入场:3340 – 3338
止损:3334
目标:3345 – 3350 – 3355 – 3360 – 3370 – 3380 – 3390 – 3400+
空单区域 🔴
入场:3400 – 3402
止损:3407
目标:3395 – 3390 – 3385 – 3380 – 3375 – 3370
MMF 思路提示
策略核心:逢低做多,而不是盲目追高。
交易前务必等待关键价位的确认信号。
黄金市场考验的是 耐心与心态,只有纪律性强的交易者才能抓住真正的大行情。
✨ 本周黄金正酝酿大动作,你认为会先回调还是直接突破? 🚀
👉 欢迎在评论区分享你的观点!

Gold SMC Playbook 25/08 – 流动性猎杀 3400 & 3325市场背景(SMC 视角)
价格在强劲上行后,目前在 3367 附近盘整,并在小阻力区域附近反应。
清晰的 ChoCH 和 BOS 形态确认了 H1 周期的看涨意图;然而,流动性池仍位于 3343 和 3325 下方(买方流动性)。
识别出的不平衡区:3343–3341 以及更深的 3325–3323 订单块区域。
关键水平
**阻力(供给区):**3372 – 3382 – 3389
**支撑(需求区):**3350 – 3342 – 3325
SMC 偏向:中性 – 可围绕流动性布局多空双向策略
🔴 卖出场景(短期流动性捕捉)
**入场:**3400 – 3403(本地流动性扫单上方)
**止损:**3408
目标:
TP1:3390(部分止盈)
TP2:3380
TP3:3370
TP4:3360(打开 3350 流动性区域)
逻辑: 预期价格上扫 3400 进入供给区后回调并下跌。
🟢 买入场景(需求 OB 的看涨延续)
**入场 1(短线买入):**3343 – 3341(反应区),止损 3337
**入场 2(主要 OB):**3325 – 3323(强订单块),止损 3319
目标:
TP1:3330
TP2:3340
TP3:3350
TP4:3370(打开 3390 流动性)
逻辑: 价格可能回调至 3340 下方以填补不平衡,并测试 3325 OB 区后再度上涨。
执行计划(SMC 流程):
等待价格在高点或低点(3400 上方或 3325 下方)扫流动性,并确认入场信号。
在低周期(M5–M15)关注 OB 附近的 ChoCH 和 BOS 信号以确认入场。
TP1 达成后移动止损保护利润;部分止盈,其余仓位持有到最终流动性目标。


智者生存:黄金或将迎来单边机会,抓住机会交易小Tips:好的调整心态方法,是弄懂自己在干嘛
复盘分析:黄鱼小有下行,但并没有能延续下行,走趋势
市场分析:已经盘整数月,上方的3430空头表现很活跃,下方的多头受基本面刺激,也当仁不让,黄金短期亦来回拉扯,震荡区间在3200-3260-3400-3430-3500。当前金价震荡区间中在收窄,行情或将迎来比较强势的单边,短期区间在3350-3360之间,管制这块的多空博弈情况就得方向。
中期、个人比较倾向会向下突破,关注未来几天行情的多空表现
若上行,关注3400/3430的压力表现
若直接下行,关注下行的强度以及延续情况即可
以具体价格表现为准

