🔍Important Add-On: RSI Divergence Strategy in Swing Trading (Stock Options)
In the previous educational video on swing trading using stock options, one key element was missing — RSI Divergence.
📉 What is RSI Divergence?
RSI Divergence occurs when the price of a stock makes a higher high, but the RSI forms a lower high on the daily chart. This is a strong signal of weakening momentum and a potential reversal.
📌 Key Guidelines to Follow:
Avoid Taking Long Positions:
If you observe a higher high in price but a lower high in RSI (bearish divergence), avoid entering into a long (buy) trade — even if all other criteria align.
Use the Divergence as a Filter:
Among the pre-selected 25 liquid F&O stocks I provided, if you identify such bearish divergence on the daily chart, that stock should be kept aside and not considered for a long trade setup.
Look for PE (Put Option) Opportunities:
If a stock is showing RSI divergence to the upside while the monthly and weekly charts are above the 9 SMA, this could indicate an upcoming downside move. In such cases, consider PE (Put Option) selling or downside trades (with proper risk management).
🧠 Always Combine with Multi-Timeframe Confirmation:
While divergence is a powerful signal, always validate it alongside your existing strategy rules like 9 SMA and market structure.
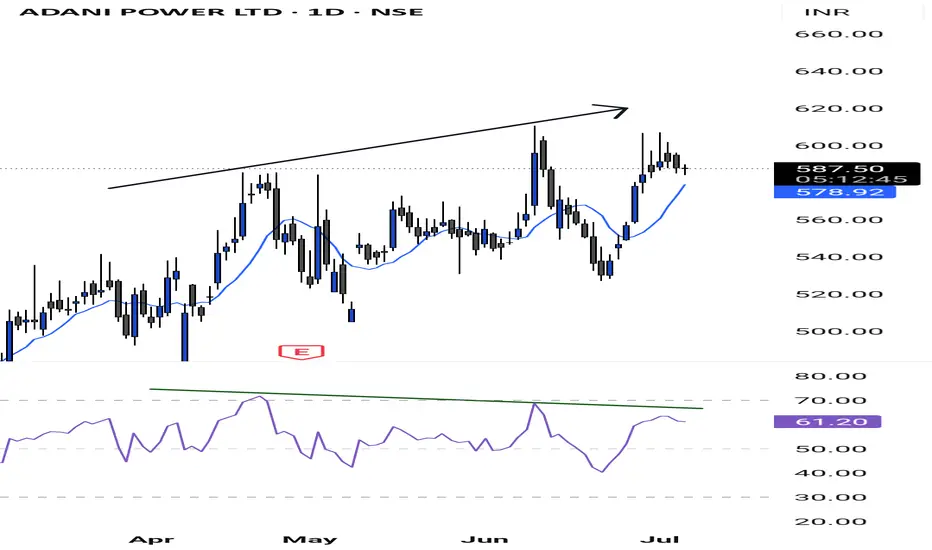
Note - You can see in the chart that prices are forming higher highs, while RSI levels are making lower lows. In this case, even if the momentum or the monthly and weekly trends push the price above the 9 SMA, we will not consider this option for entry.
Any doubts, please ask in the comment section.
In the previous educational video on swing trading using stock options, one key element was missing — RSI Divergence.
📉 What is RSI Divergence?
RSI Divergence occurs when the price of a stock makes a higher high, but the RSI forms a lower high on the daily chart. This is a strong signal of weakening momentum and a potential reversal.
📌 Key Guidelines to Follow:
Avoid Taking Long Positions:
If you observe a higher high in price but a lower high in RSI (bearish divergence), avoid entering into a long (buy) trade — even if all other criteria align.
Use the Divergence as a Filter:
Among the pre-selected 25 liquid F&O stocks I provided, if you identify such bearish divergence on the daily chart, that stock should be kept aside and not considered for a long trade setup.
Look for PE (Put Option) Opportunities:
If a stock is showing RSI divergence to the upside while the monthly and weekly charts are above the 9 SMA, this could indicate an upcoming downside move. In such cases, consider PE (Put Option) selling or downside trades (with proper risk management).
🧠 Always Combine with Multi-Timeframe Confirmation:
While divergence is a powerful signal, always validate it alongside your existing strategy rules like 9 SMA and market structure.
Note - You can see in the chart that prices are forming higher highs, while RSI levels are making lower lows. In this case, even if the momentum or the monthly and weekly trends push the price above the 9 SMA, we will not consider this option for entry.
Any doubts, please ask in the comment section.
免责声明
这些信息和出版物并不意味着也不构成TradingView提供或认可的金融、投资、交易或其它类型的建议或背书。请在使用条款阅读更多信息。
免责声明
这些信息和出版物并不意味着也不构成TradingView提供或认可的金融、投资、交易或其它类型的建议或背书。请在使用条款阅读更多信息。