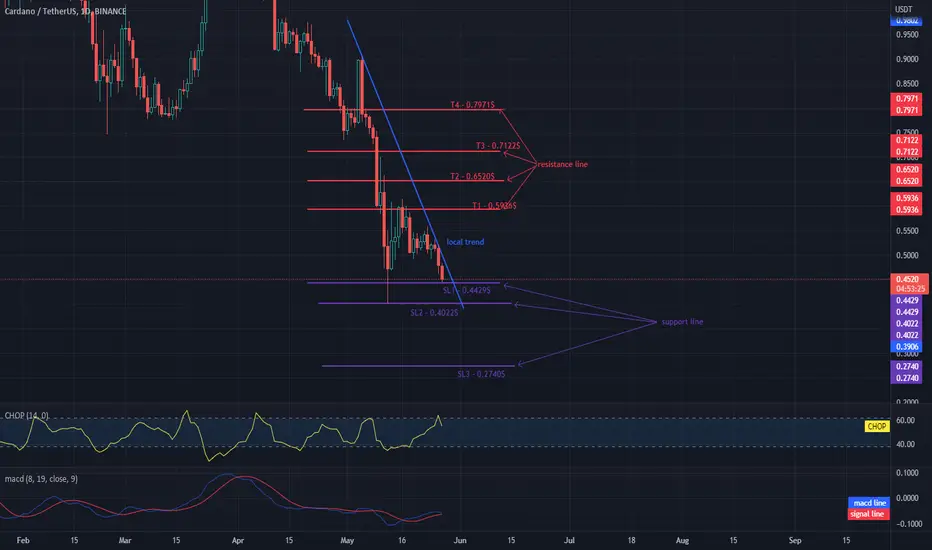
Hello everyone, let's take a look at the ADA to USDT chart on a 1 day time frame. As you can see, the price is moving below the local downtrend line.
Let's start with the designation of the support line and as you can see the first support in the near future is SL1 - $ 0.4429 which is currently in price, if the support breaks, the next one is SL2 - $ 0.4022 and SL3 - $ 0.2740.
Now let's move from the resistance line, as you can see, the first resistance is T1 - $ 0.5936, if you manage to break it, the next ones will be T2 - $ 0.6520 and T3 - $ 0.7122 and T4 - $ 0.7971.
Looking at the CHOP indicator, we can see that in the 1-day interval some energy has been used to reduce the price, but we still have a lot of energy that can be used in the coming days.
免责声明
这些信息和出版物并非旨在提供,也不构成TradingView提供或认可的任何形式的财务、投资、交易或其他类型的建议或推荐。请阅读使用条款了解更多信息。
免责声明
这些信息和出版物并非旨在提供,也不构成TradingView提供或认可的任何形式的财务、投资、交易或其他类型的建议或推荐。请阅读使用条款了解更多信息。