Hey team! Quick AMZN update based on the 4-hour chart setup.
📈 Technical Analysis (TA):
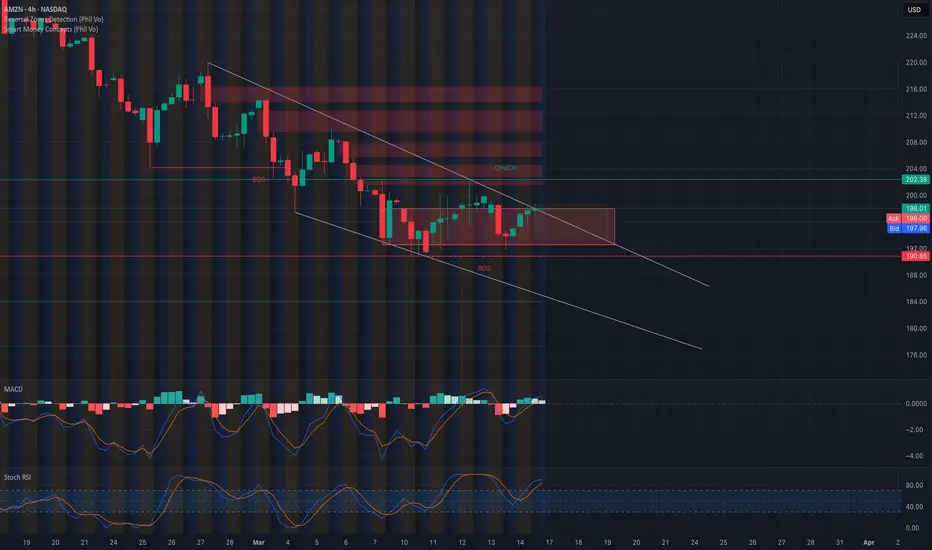
* AMZN is flirting with the top trendline of a descending wedge pattern—could hint at a bullish breakout.
* Crucial resistance zone immediately overhead between $198–$202; breaking this zone could ignite upward momentum.
* Recent BOS (Break of Structure) at $190.85 highlights strong support—this is a key area for bulls.
* Keep an eye on the supply zone around $202.38 if the breakout continues.
📊 GEX & Options Insights:

* Highest positive NET GEX and call resistance at $210; major gamma wall that could act as a price magnet if AMZN breaks higher.
* Strongest PUT support at $190.85; crucial floor level for price.
* IV Rank at 49.6%, indicating moderate volatility and premium—consider debit spreads or strategic premium selling.
* CALL ratio at just 4% signals heavily bearish sentiment in options, implying caution on bullish trades.
💡 Trade Recommendations:
* Bullish Play: A solid break and hold above $202 could set up a bullish run targeting the $210 gamma wall. Stops just below $197.
* Bearish Play: If AMZN rejects firmly at $202, puts targeting a move back down towards $190.85 could offer a solid risk-reward.
* Neutral traders: Iron Condors or credit spreads between clear ranges ($190–$210) could be attractive.
🛑 Risk Management: Stay tight on risk management, especially in a tricky range-bound scenario like this.
Trade smart, everyone!
Disclaimer: This analysis is for educational purposes only and does not constitute financial advice. Always do your own research and manage your risk before trading.
📈 Technical Analysis (TA):
* AMZN is flirting with the top trendline of a descending wedge pattern—could hint at a bullish breakout.
* Crucial resistance zone immediately overhead between $198–$202; breaking this zone could ignite upward momentum.
* Recent BOS (Break of Structure) at $190.85 highlights strong support—this is a key area for bulls.
* Keep an eye on the supply zone around $202.38 if the breakout continues.
📊 GEX & Options Insights:
* Highest positive NET GEX and call resistance at $210; major gamma wall that could act as a price magnet if AMZN breaks higher.
* Strongest PUT support at $190.85; crucial floor level for price.
* IV Rank at 49.6%, indicating moderate volatility and premium—consider debit spreads or strategic premium selling.
* CALL ratio at just 4% signals heavily bearish sentiment in options, implying caution on bullish trades.
💡 Trade Recommendations:
* Bullish Play: A solid break and hold above $202 could set up a bullish run targeting the $210 gamma wall. Stops just below $197.
* Bearish Play: If AMZN rejects firmly at $202, puts targeting a move back down towards $190.85 could offer a solid risk-reward.
* Neutral traders: Iron Condors or credit spreads between clear ranges ($190–$210) could be attractive.
🛑 Risk Management: Stay tight on risk management, especially in a tricky range-bound scenario like this.
Trade smart, everyone!
Disclaimer: This analysis is for educational purposes only and does not constitute financial advice. Always do your own research and manage your risk before trading.
免责声明
这些信息和出版物并不意味着也不构成TradingView提供或认可的金融、投资、交易或其它类型的建议或背书。请在使用条款阅读更多信息。
免责声明
这些信息和出版物并不意味着也不构成TradingView提供或认可的金融、投资、交易或其它类型的建议或背书。请在使用条款阅读更多信息。