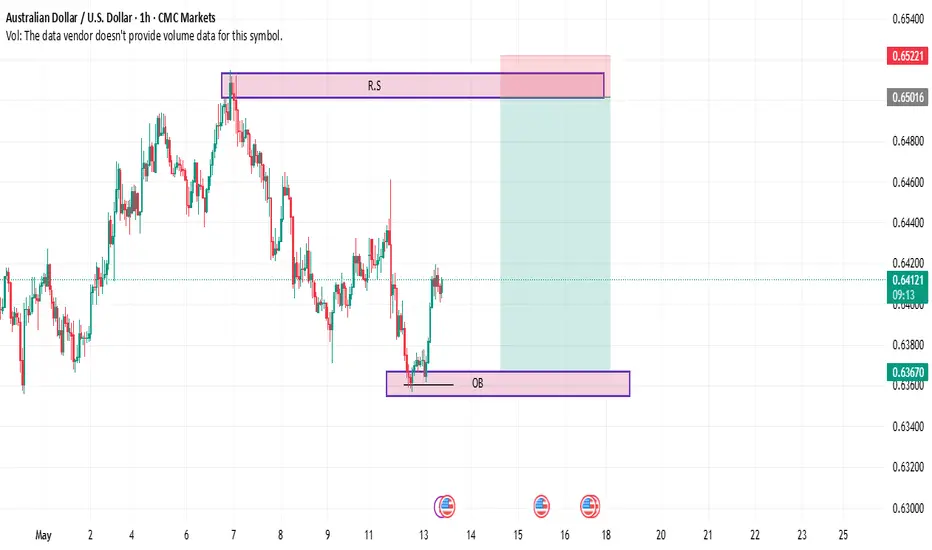
In this 1-hour chart of AUD/USD, we observe a well-defined **Order Block (OB)** at the lower level, acting as a potential demand zone, while a prominent **Resistance/Supply (R.S)** zone appears at the top. The pair recently bounced off the OB area, showing signs of a potential upward move towards the R.S zone. The highlighted green area represents the potential profit zone, while the red zone marks a risk area.
With the recent price action hinting at bullish momentum, traders should watch for reactions around the R.S level to assess whether the trend continues or reverses. Maintaining a balanced risk management strategy is essential in this setup.
With the recent price action hinting at bullish momentum, traders should watch for reactions around the R.S level to assess whether the trend continues or reverses. Maintaining a balanced risk management strategy is essential in this setup.
免责声明
这些信息和出版物并不意味着也不构成TradingView提供或认可的金融、投资、交易或其它类型的建议或背书。请在使用条款阅读更多信息。
免责声明
这些信息和出版物并不意味着也不构成TradingView提供或认可的金融、投资、交易或其它类型的建议或背书。请在使用条款阅读更多信息。