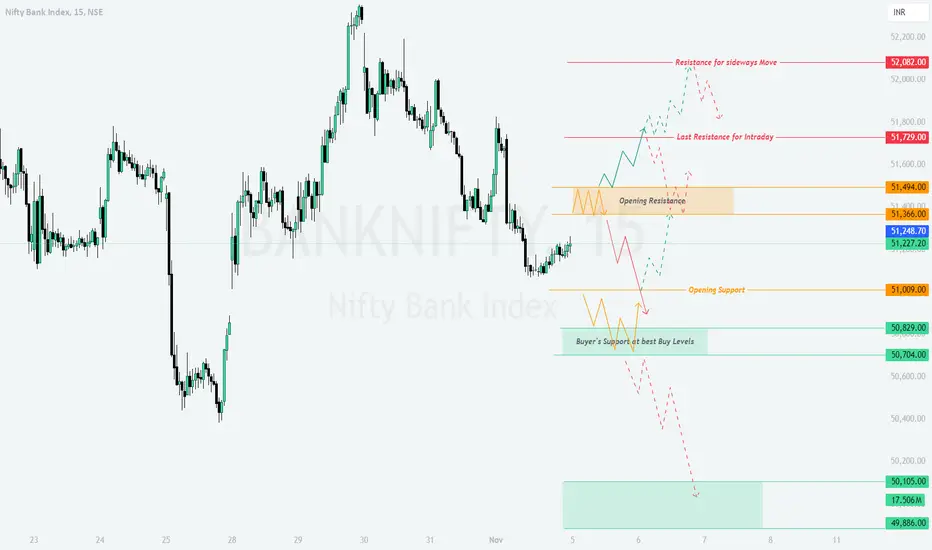
On 04-Nov-2024, Bank Nifty showed a bearish action with the first tick of opening, closing near **51,227** with noticeable volatility. The chart reflects clear support near **50,829** and **50,704**, while resistance zones are seen at **51,494** and **51,729**. The **Yellow trend** represents a sideways market, the **Green trend** signals bullish momentum, and the **Red trend** indicates bearish moves.
Trading Plan for 05-Nov-2024:
Risk Management Tips for Options Trading:
- Consider using spreads to limit risk while taking advantage of directional moves.
- Keep positions light during volatile openings and focus on defined support/resistance levels.
- Avoid holding short-term options over the weekend unless there’s a clear directional bias.
Summary and Conclusion:
Key levels to watch for 05-Nov-2024 include **51,494** as intraday resistance and **50,704** as strong support. A gap-up or flat opening presents potential opportunities for bullish trades above **51,366**, while a gap-down opening could provide buy opportunities near **50,704**. As always, respect support/resistance zones and wait for confirmation before entering positions.
Disclaimer: I am not a SEBI-registered analyst. This trading plan is based on technical analysis and should not be considered financial advice. Please consult with your financial advisor before making any trading decisions.
Trading Plan for 05-Nov-2024:
- Gap Up Opening (200+ points):
If Bank Nifty opens with a gap-up above **51,494**, the index will likely face intraday resistance at **51,729**. A breakout above this level can push Bank Nifty towards **52,082**, the next key resistance level, which might induce sideways movement.
However, failure to sustain above **51,729** could result in a pullback towards **51,494** or even a retest of **51,366**, the opening support/resistance level.
Actionable Plan:
- **Buy** on a sustained move above **51,729** with a target of **52,082**.
- **Stop Loss:** Below **51,494** on a 15-minute candle close. - Flat Opening:
If Bank Nifty opens flat near **51,227**, the focus will be on price action around the **51,366** level. A breakout above **51,494** could initiate bullish momentum, while a failure to break this resistance will result in a sideways trend (Yellow trend) with a potential retest of **51,009** (opening support).
In case Bank Nifty breaks **51,009**, expect a bearish move towards **50,829** and **50,704**.
Actionable Plan:
- **Buy** on a breakout above **51,366**, targeting **51,494**.
- **Sell** below **51,009**, with a target of **50,829**.
- **Stop Loss:** Place a stop loss near **51,227** for both buy and sell strategies. - Gap Down Opening (200+ points):
If Bank Nifty opens with a gap-down around **50,829** or below, the focus shifts to the **Buyer’s Support Zone** around **50,704**. A strong recovery from this zone could lead to a bounce back towards **51,009** or even higher.
However, if the index fails to hold **50,704**, expect further downside pressure, with the next major support at **50,105**. Keep in mind that aggressive selling could lead to a bearish continuation (Red trend).
Actionable Plan:
- **Buy** near **50,704**, with a target of **51,009**.
- **Sell** below **50,704**, aiming for **50,105**.
- **Stop Loss:** Below **50,704** on a 15-minute candle close.
Risk Management Tips for Options Trading:
- Consider using spreads to limit risk while taking advantage of directional moves.
- Keep positions light during volatile openings and focus on defined support/resistance levels.
- Avoid holding short-term options over the weekend unless there’s a clear directional bias.
Summary and Conclusion:
Key levels to watch for 05-Nov-2024 include **51,494** as intraday resistance and **50,704** as strong support. A gap-up or flat opening presents potential opportunities for bullish trades above **51,366**, while a gap-down opening could provide buy opportunities near **50,704**. As always, respect support/resistance zones and wait for confirmation before entering positions.
Disclaimer: I am not a SEBI-registered analyst. This trading plan is based on technical analysis and should not be considered financial advice. Please consult with your financial advisor before making any trading decisions.
免责声明
这些信息和出版物并不意味着也不构成TradingView提供或认可的金融、投资、交易或其它类型的建议或背书。请在使用条款阅读更多信息。
免责声明
这些信息和出版物并不意味着也不构成TradingView提供或认可的金融、投资、交易或其它类型的建议或背书。请在使用条款阅读更多信息。