Detailed Market Structure Breakdown
4-Hour Chart (Macro Trend)
Structure: The long-term trend remains bullish. The index has now corrected to test the lower end of its ascending channel and has found support. The bounce from this area on Monday is a strong signal that the overall uptrend is still intact.
Key Levels:
Major Supply (Resistance): 55,800 - 56,000. This level has proven to be a very strong supply zone, rejecting the price on its recent attempt. It is now a critical resistance to watch.
Major Demand (Support): The most crucial support for the bulls is the 55,050 - 55,200 zone. This area, which includes a prior breakout level, is the key "line in the sand" for the current bullish trend. A strong bounce from this area would confirm the trend's continuation.
1-Hour Chart (Intermediate View)
Structure: The 1H chart shows a clear MSS (Market Structure Shift) to the downside. The price had broken below the lower trendline of the rising channel, but Monday's session saw a strong rebound, bringing it back into the channel's vicinity. The index is now at a crucial decision point.
Key Levels:
Immediate Resistance: The 55,800 level, which is the high of the recent bounce.
Immediate Support: The 55,400 area, which is the bottom of the previous consolidation and the lower channel trendline.
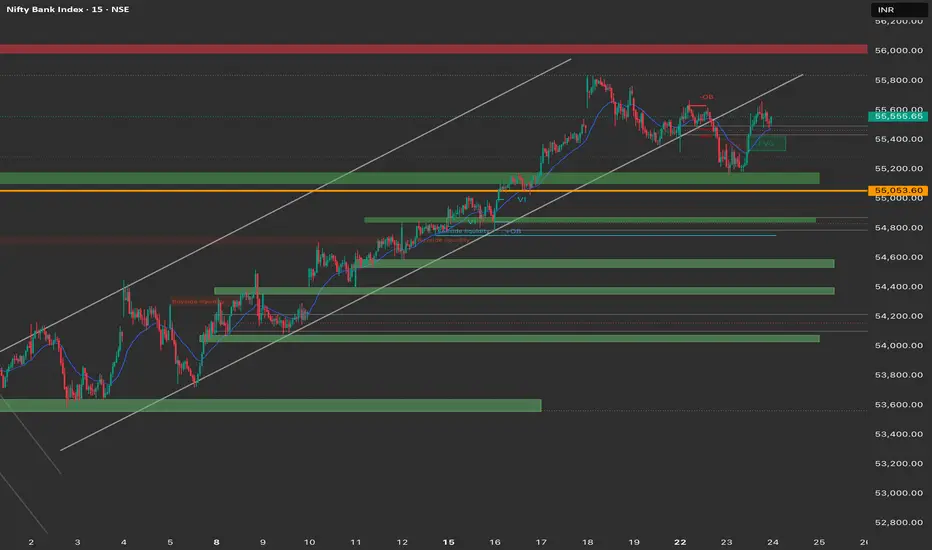
15-Minute Chart (Intraday View)
Structure: The 15M chart provides a clearer picture of the intraday price action. The index opened with a sharp move down but then rallied strongly, reclaiming its lost ground. The price is now trading within a corrective pattern, but the bullish momentum from the close is a positive sign.
Key Levels:
Intraday Supply: The 55,800 area, which is the high of Monday's session.
Intraday Demand: The low of Monday's session near 55,200.
Outlook: The intraday bias is now cautiously bullish, but the market is still in a corrective pattern. The key for today is to watch for a sustained move above or below the current consolidation range.
Trade Plan (Tuesday, 24th September)
Market Outlook: The market is now at a crucial decision point. While the recent bounce is bullish, the overall short-term structure is still in a corrective phase. A breakout from the recent consolidation would provide a clear signal.
Bullish Scenario (Primary Plan)
Justification: The market has shown a strong rebound from a key support area, suggesting that the long-term trend is likely to continue.
Entry: Look for a long entry on a sustained break and 15-minute candle close above the 55,800 resistance zone.
Stop Loss (SL): Place a stop loss below 55,700.
Targets:
T1: 56,000 (Psychological level and major resistance).
T2: 56,200 (Further extension of the rally).
Bearish Scenario (Counter-Trend Plan)
Justification: This is a counter-trend plan and should be approached with caution. It is based on the possibility that the bounce was short-lived and that the overall correction will continue.
Trigger: A confirmed breakdown and 15-minute candle close below the 55,400 immediate support.
Entry: Short entry on a breakdown retest of the 55,400 level.
Stop Loss (SL): Above 55,500.
Targets:
T1: 55,200 (Intraday support).
T2: 55,050 (Major demand zone).
Key Levels for Observation:
Immediate Decision Point: The 55,400 - 55,800 zone.
Bullish Confirmation: A break and sustained move above 55,800.
Bearish Confirmation: A break below 55,400.
Line in the Sand: The 55,050 - 55,200 zone. The overall bullish trend is in jeopardy if this level is decisively broken.
4-Hour Chart (Macro Trend)
Structure: The long-term trend remains bullish. The index has now corrected to test the lower end of its ascending channel and has found support. The bounce from this area on Monday is a strong signal that the overall uptrend is still intact.
Key Levels:
Major Supply (Resistance): 55,800 - 56,000. This level has proven to be a very strong supply zone, rejecting the price on its recent attempt. It is now a critical resistance to watch.
Major Demand (Support): The most crucial support for the bulls is the 55,050 - 55,200 zone. This area, which includes a prior breakout level, is the key "line in the sand" for the current bullish trend. A strong bounce from this area would confirm the trend's continuation.
1-Hour Chart (Intermediate View)
Structure: The 1H chart shows a clear MSS (Market Structure Shift) to the downside. The price had broken below the lower trendline of the rising channel, but Monday's session saw a strong rebound, bringing it back into the channel's vicinity. The index is now at a crucial decision point.
Key Levels:
Immediate Resistance: The 55,800 level, which is the high of the recent bounce.
Immediate Support: The 55,400 area, which is the bottom of the previous consolidation and the lower channel trendline.
15-Minute Chart (Intraday View)
Structure: The 15M chart provides a clearer picture of the intraday price action. The index opened with a sharp move down but then rallied strongly, reclaiming its lost ground. The price is now trading within a corrective pattern, but the bullish momentum from the close is a positive sign.
Key Levels:
Intraday Supply: The 55,800 area, which is the high of Monday's session.
Intraday Demand: The low of Monday's session near 55,200.
Outlook: The intraday bias is now cautiously bullish, but the market is still in a corrective pattern. The key for today is to watch for a sustained move above or below the current consolidation range.
Trade Plan (Tuesday, 24th September)
Market Outlook: The market is now at a crucial decision point. While the recent bounce is bullish, the overall short-term structure is still in a corrective phase. A breakout from the recent consolidation would provide a clear signal.
Bullish Scenario (Primary Plan)
Justification: The market has shown a strong rebound from a key support area, suggesting that the long-term trend is likely to continue.
Entry: Look for a long entry on a sustained break and 15-minute candle close above the 55,800 resistance zone.
Stop Loss (SL): Place a stop loss below 55,700.
Targets:
T1: 56,000 (Psychological level and major resistance).
T2: 56,200 (Further extension of the rally).
Bearish Scenario (Counter-Trend Plan)
Justification: This is a counter-trend plan and should be approached with caution. It is based on the possibility that the bounce was short-lived and that the overall correction will continue.
Trigger: A confirmed breakdown and 15-minute candle close below the 55,400 immediate support.
Entry: Short entry on a breakdown retest of the 55,400 level.
Stop Loss (SL): Above 55,500.
Targets:
T1: 55,200 (Intraday support).
T2: 55,050 (Major demand zone).
Key Levels for Observation:
Immediate Decision Point: The 55,400 - 55,800 zone.
Bullish Confirmation: A break and sustained move above 55,800.
Bearish Confirmation: A break below 55,400.
Line in the Sand: The 55,050 - 55,200 zone. The overall bullish trend is in jeopardy if this level is decisively broken.
免责声明
这些信息和出版物并非旨在提供,也不构成TradingView提供或认可的任何形式的财务、投资、交易或其他类型的建议或推荐。请阅读使用条款了解更多信息。
免责声明
这些信息和出版物并非旨在提供,也不构成TradingView提供或认可的任何形式的财务、投资、交易或其他类型的建议或推荐。请阅读使用条款了解更多信息。