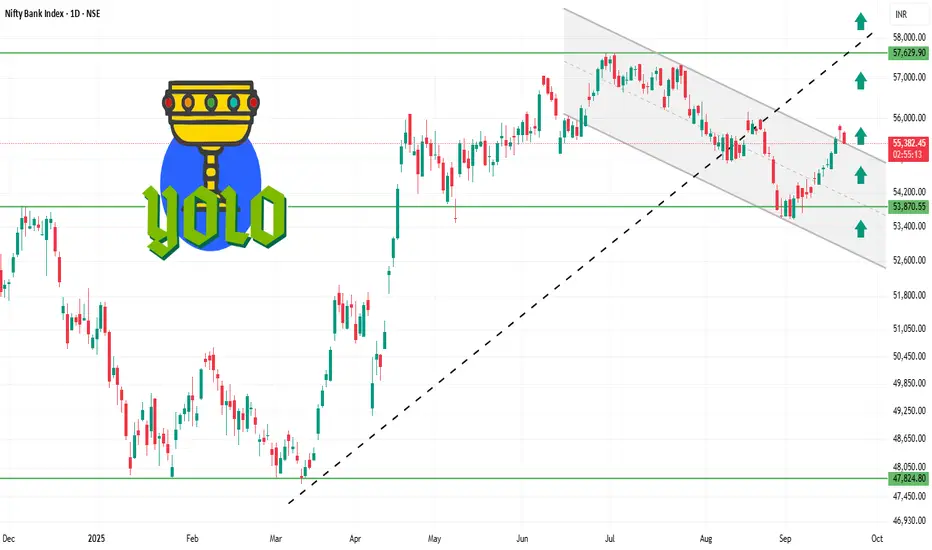
✅ Current Facts
Current Level: ~ 55,400 – 55,480
Trend: Mildly bullish; trading above short-term moving averages (20-day & 50-day EMA).
Momentum Indicators:
RSI (14-day): ~61 → bullish but not overbought.
MACD: Positive → supporting the upward trend.
Price Action: Daily candles show small upper wicks → minor profit-taking near resistance.
⚙️ Outlook
Bullish Scenario:
Holding above 55,350 → retest 55,550–55,600 and possibly 55,700–55,750.
Range / Consolidation:
Price oscillates between 55,350 – 55,550 → sideways trading likely.
Bearish Scenario:
Close below 55,350 → downside risk toward 55,150–55,200 or lower.
⚠️ Key Facts
55,400 – 55,500 is acting as a short-term pivot: above it favors bulls, below it favors bears.
Resistance at 55,550–55,600 is the first hurdle; breakout here can lead to further upside.
Support at 55,300–55,350 is critical; failing to hold may lead to short-term correction.
相关出版物
免责声明
这些信息和出版物并不意味着也不构成TradingView提供或认可的金融、投资、交易或其它类型的建议或背书。请在使用条款阅读更多信息。